BHARAT BIJLEEBharat Bijlee Ltd. is a leading industrial electrical equipment manufacturer specializing in power transformers, electric motors, drives & automation, and project solutions. It caters to segments such as infrastructure, real estate, utilities, and OEMs. The stock is currently trading at ₹3,267 and is attempting a trend continuation post a broad consolidation, with fresh volume and Fibonacci alignment supporting breakout momentum.
Bharat Bijlee Ltd. – FY22–FY25 Snapshot
Sales – ₹750 Cr → ₹842 Cr → ₹923 Cr → ₹1,015 Cr – Steady growth driven by infra push and OEM demand
Net Profit – ₹58.3 Cr → ₹72.1 Cr → ₹84.6 Cr → ₹96.5 Cr – Margin expansion with operating scale
Company Order Book – Moderate → Strong → Strong → Strong – Solid pipeline in drives & automation
Dividend Yield (%) – 0.84% → 1.07% → 1.28% → 1.38% – Consistent payout with moderate yield
Operating Performance – Moderate → Strong → Strong → Strong – Increasing efficiency and utilization
Equity Capital – ₹5.69 Cr (constant) – Tight capital structure
Total Debt – ₹24 Cr → ₹19 Cr → ₹13 Cr → ₹10 Cr – Deleveraging over time
Total Liabilities – ₹302 Cr → ₹312 Cr → ₹319 Cr → ₹325 Cr – Stable with managed debt component
Fixed Assets – ₹123 Cr → ₹129 Cr → ₹136 Cr → ₹141 Cr – Conservative capex, efficiency-focused
Latest Highlights FY25 net profit grew 14.1% YoY to ₹96.5 Cr; revenue increased 10% to ₹1,015 Cr EPS: ₹169.54 | EBITDA Margin: 24.2% | Net Margin: 9.51% Return on Equity: 23.8% | Return on Assets: 12.7% Promoter holding: 68.73% | Dividend Yield: 1.38% New orders secured in industrial automation and high-efficiency motor vertical Capacity utilization improving across transformer and drives segments
Institutional Interest & Ownership Trends Promoter holding remains strong at 68.73%, with no dilution or pledging Recent quarters show consistent DII interest, particularly from infrastructure-focused mutual funds Delivery volume breakout confirms accumulation by mid-cap value portfolios HNI buying noted on trend continuation days aligned with breakout zones
Business Growth Verdict Yes, Bharat Bijlee is scaling gradually with deep infrastructure penetration and technical pedigree Margins improving through high-value products and services Balance sheet remains lean and de-risked with low debt levels Capex aligned with energy efficiency and industrial modernization trends
Company Guidance Management expects mid-teen revenue growth in FY26, driven by expansion in transformer orders, industrial automation, and OEM tie-ups Operating margins projected to sustain above 23% Strategic investments planned in digital controls and smart motor solutions
Final Investment Verdict Bharat Bijlee Ltd. represents a focused electrical capital goods play with consistent profitability, de-risked balance sheet, and high promoter alignment. Supported by trend continuation on monthly charts and volume strength near breakout zones, the stock is a candidate for staggered entry for investors seeking infrastructure-led manufacturing exposure with margin stability and institutional tailwinds.

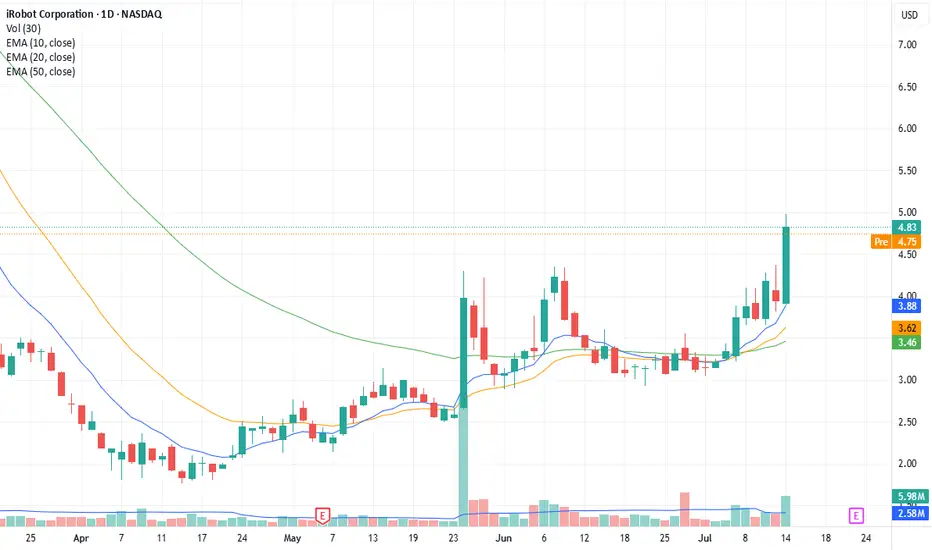
IRBT swing? 1) the uptrend is there
2) breakout already happened, maybe twice now $3.35 and $3.75 maybe ??
3) maybe look to enter at $4 if we comes back
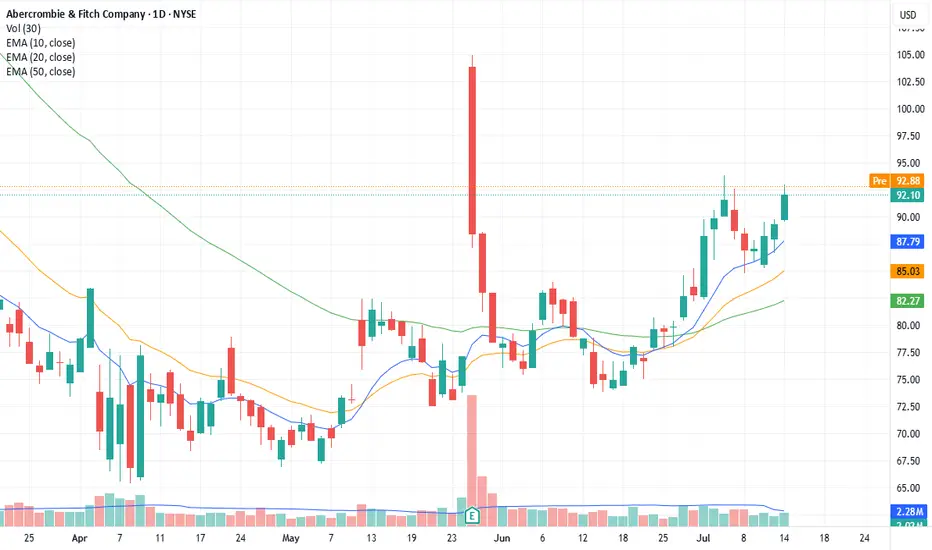
ANF break out1) uptrend since mid june
2) drying of volumes
3) breaking through the $92.10 line
4) entry $92, stop loss at $89.50
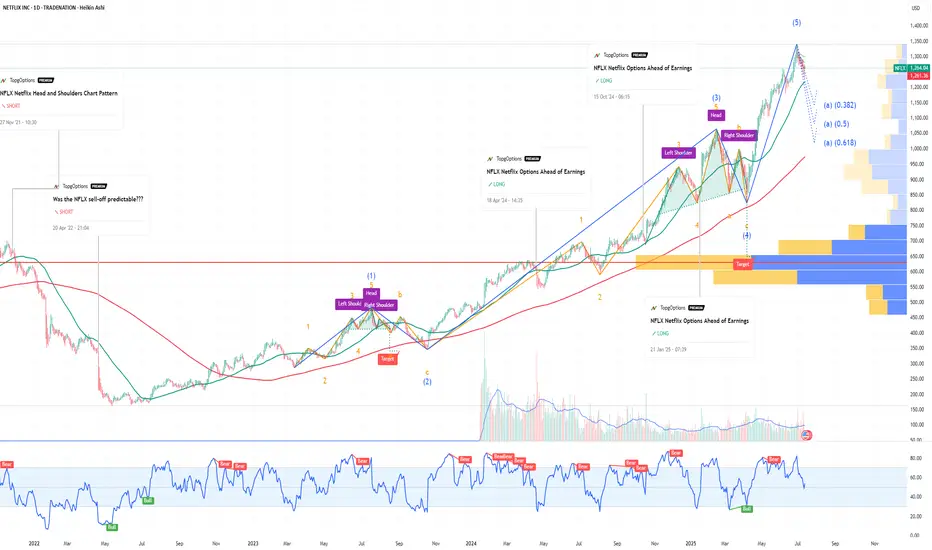
NFLX Netflix Options Ahead of EarningsIf you haven`t bought NFLX before the previous earnings:
Now analyzing the options chain and the chart patterns of NFLX Netflix prior to the earnings report this week,
I would consider purchasing the 1260usd strike price Puts with
an expiration date of 2025-9-19,
for a premium of approximately $71.10.
If these options prove to be profitable prior to the earnings release, I would sell at least half of them.
Disclosure: I am part of Trade Nation's Influencer program and receive a monthly fee for using their TradingView charts in my analysis.
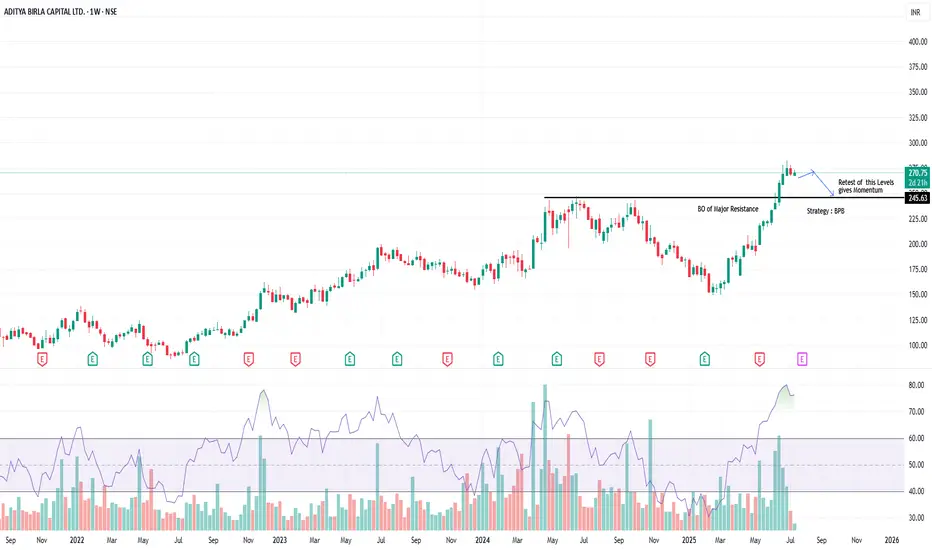
AB Capital – Clean Breakout of Multi-Year Resistance | BPB SetupTimeframe: Weekly | Strategy: Breakout–Pullback (BPB)
Technical Highlights:
========================
✅ BO (Breakout) of a major resistance zone around ₹250–₹255, which was acting as a multi-year supply zone.
📈 Strong bullish momentum seen with expanding volumes and wide-range candles.
🔄 BPB Strategy in Play: Price has broken out and now likely to retest the breakout zone.
🧠 Retest near ₹249–₹255 zone expected to provide fresh momentum.
📊 RSI confirms strength, currently above 70 – confirming a trending phase.
🔍 Key Zones:
===================
Breakout Level: ₹250 (Previous Resistance, now Support)
Immediate Resistance: ₹295–₹300
Target (Post BPB Confirmation): ₹330+
Support for Invalidating BPB: Weekly close below ₹245
📈 Trade Plan (for study purpose only):
=============================================
Wait for price to pull back into ₹250–₹255 zone.
Look for bullish candle confirmation on retest for entry.
SL: Below ₹245 | T1: ₹295 | T2: ₹330
⚠️ Disclaimer:
This idea is purely for educational purposes and does not constitute investment advice. Please consult your financial advisor before making any trading or investment decisions. Always do your own research and risk management.
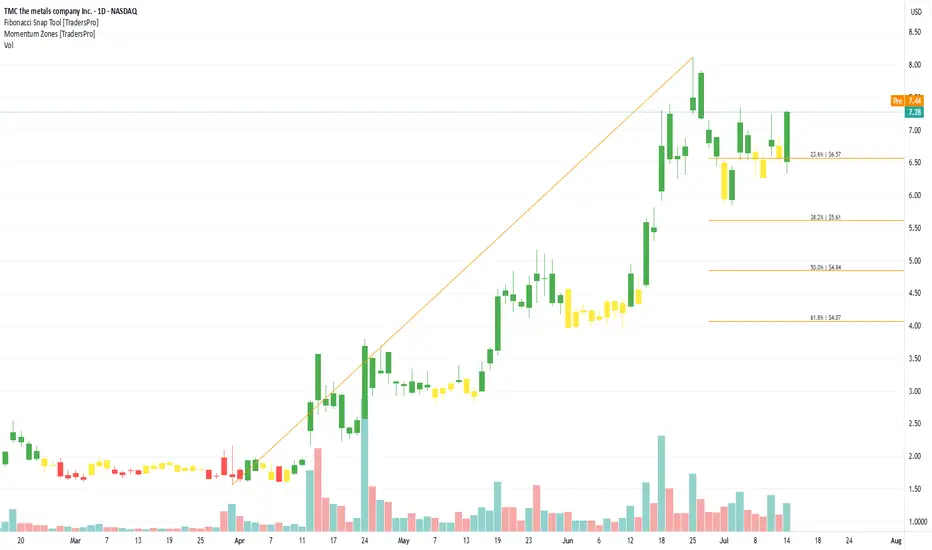
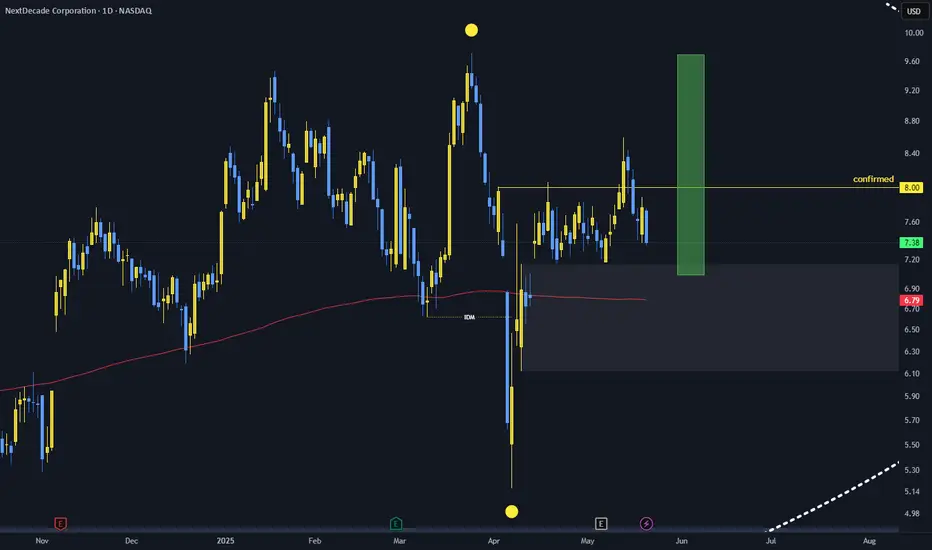
TMC the metals company Inc. (TMC) Mines Ocean NodulesTMC the metals company Inc. (TMC) is developing deep-sea mining solutions to source key battery metals like nickel, cobalt, copper, and manganese from polymetallic nodules found on the ocean floor. These metals are critical for electric vehicles and clean energy storage. TMC’s growth is driven by the rising demand for sustainable battery materials, global EV adoption, and the need to diversify away from traditional, land-based mining operations.
On the chart, a confirmation bar with increasing volume shows strong momentum. The price has entered the momentum zone by breaking above the .236 Fibonacci level. Traders can use the Fibonacci snap tool to set a trailing stop just below that level to protect gains while allowing for additional upside potential.
$BABA don’t miss this milky bottle. Called this out at $105 in minds. This Monthly declining volume, support at $100, and uptrend pattern. China will boom into the end of Q3 and early 2026. Target is $180 and $200.
WSL.

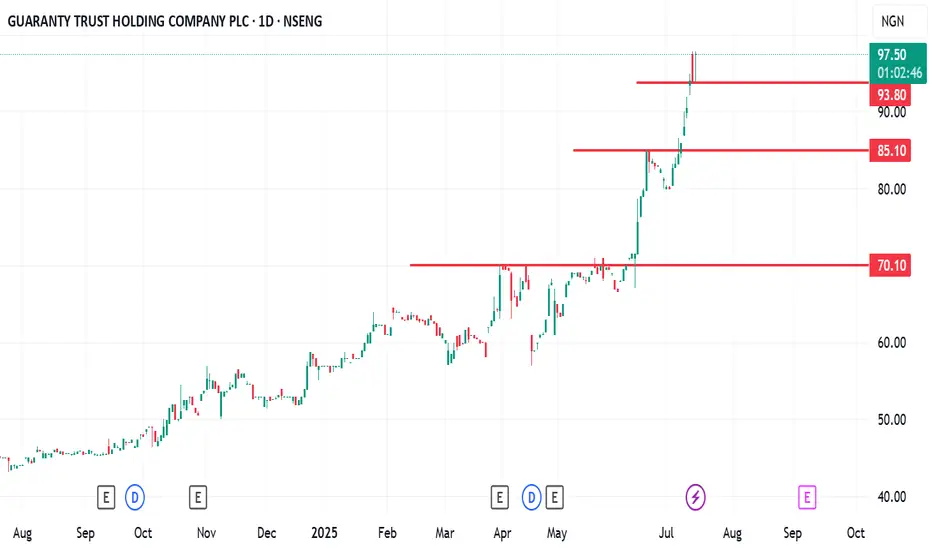
GTCO: has the sell off started.GTCO: Has the sell-off started?
Yesterday closed with a big sell day candle.
Be careful with this stock as the volatility will likely get worse between now and the end of this month.
I will be happy to accumulate this asset from N80 - N85 nzone
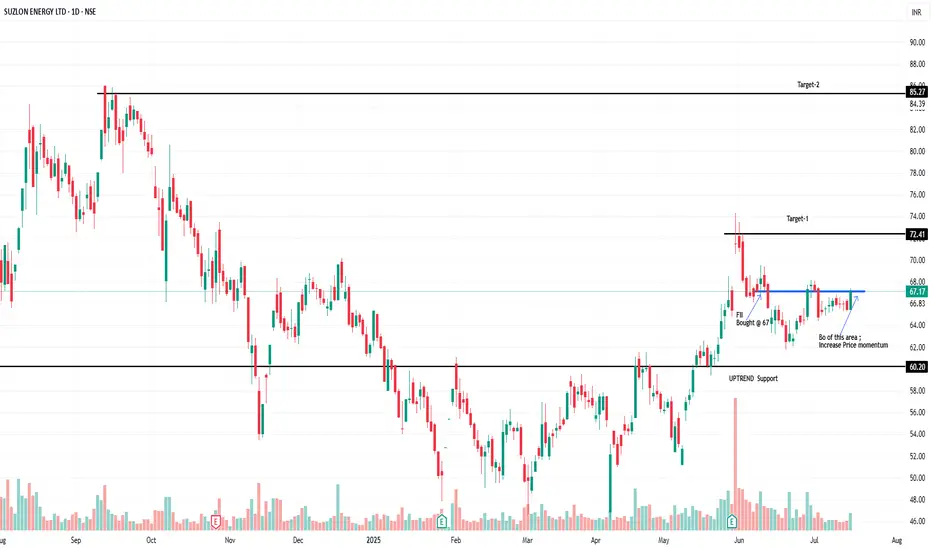
Suzlon Technical AnalysisPrice is currently at area where there was FII bought it earlier in June
-- Break out of current short-Term resistance can give lot of Momentum in price
-- BPB of current Resistance are can give Target-1 and thenTarget-2
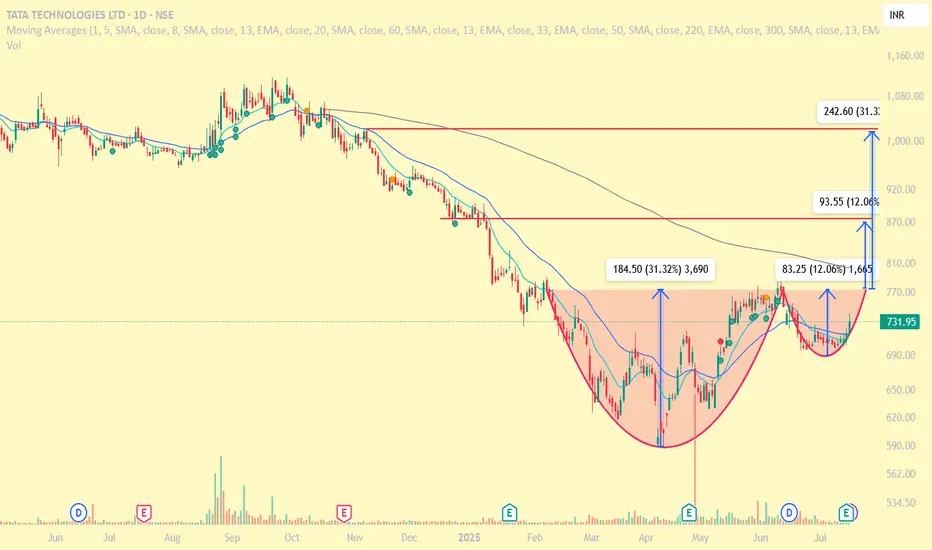
Tatatech: Formation of cup and handlethe chart shows the formation of cup and handle in progress. It may shoot the targets depending upon the market perception.
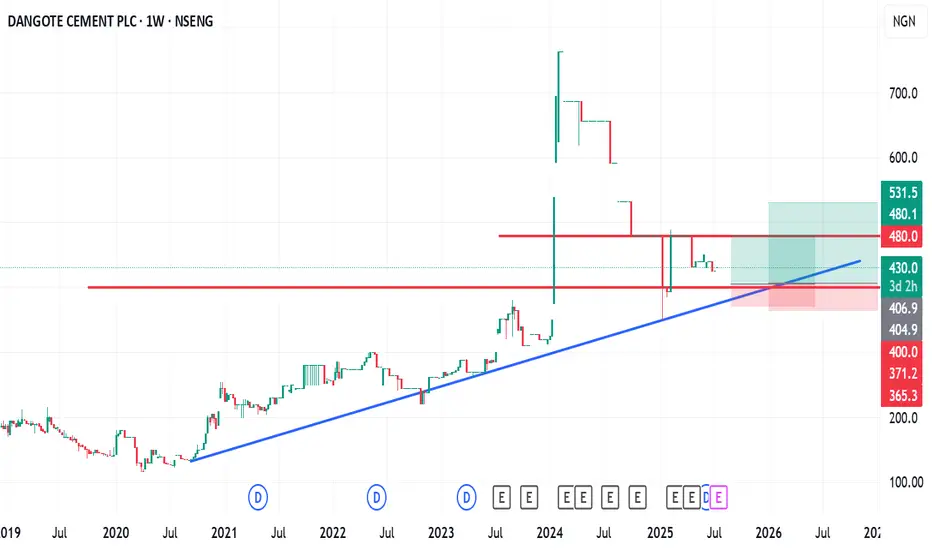
How I view Dangote CementHow I view Dangote Cement.
Technically:
N480 & N400 have been a strong psychological resistance zone for some time now.
Fundamentally:
The news that Dangote is planning to build a deep-sea port is a positive catalyst if it comes to fruition.
My entry:
I am looking at a buy entry from N400 using DCA.
I will continue to add if it falls below my N400 entry.
Trade with care
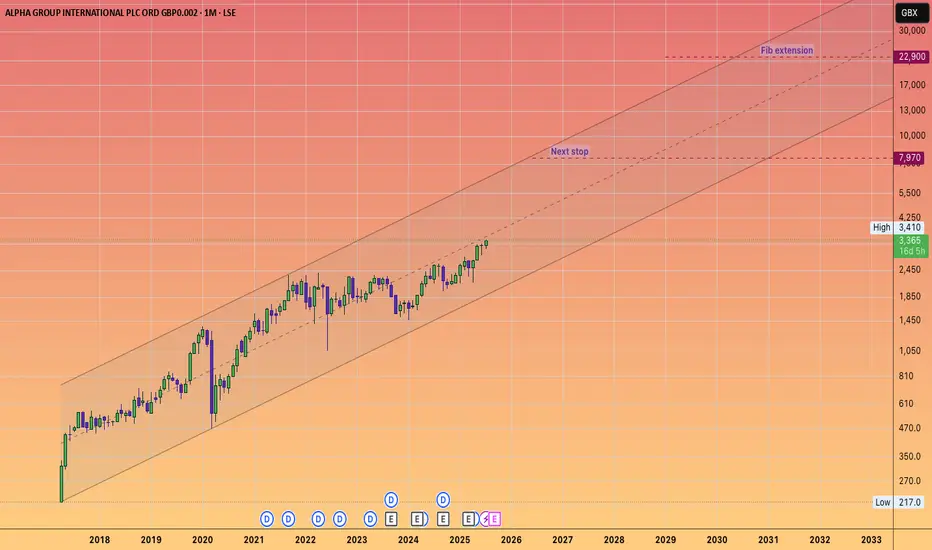
ALPHA GROUP INTERNATIONAL will keep its momentum going!#ALPHA is a fintech company that offers currency risk management and payment solutions.
With a price-to-earnings ratio of approximately 12,
it signifies a solid investment for a growth-oriented fintech firm that is increasing its earnings by about 20 to 25% annually.
In light of the #UKX breaking through and reaching new highs, and beginning to accelerate towards my long-standing projections that the FTSE would hit 5 figures, ALPHA appears to be a unique opportunity in the UK markets, which, as we know, are relatively sparse compared to the USA.
Given the inability to purchase shares of #Revolut, it is likely that capital will flow into this ticker.
Moving average has only one principle, solve the problem, earn mMoving average has only one principle, solve the problem, earn money,
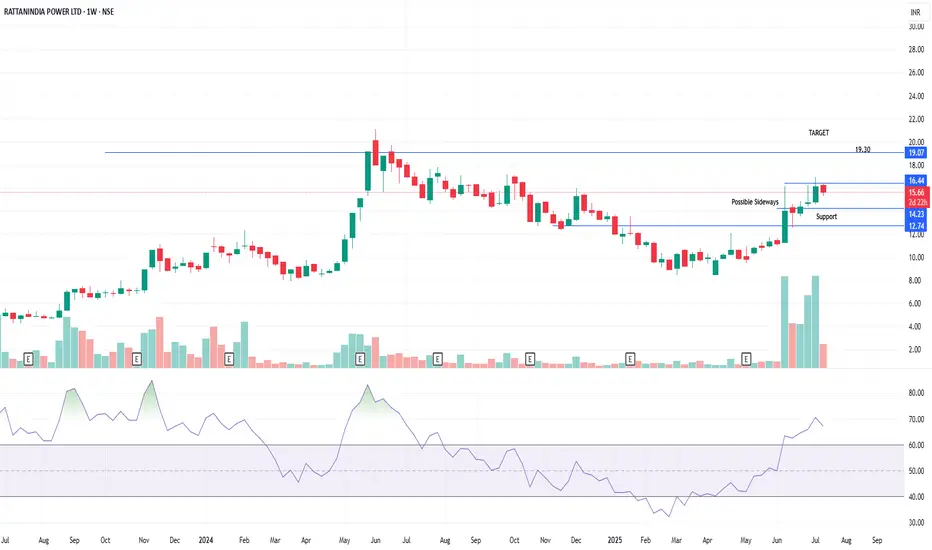
RattanIndia Power Ltd. – Breakout or Pause? A Technical & ShareTimeframe: Weekly | Idea Type: Technical + Smart Money Flow
🧠 Technical Analysis:
=============================================
📈 Stock is currently testing a key resistance zone around ₹16.44, after a strong uptrend.
📉 Possible sideways consolidation around ₹14.23–₹16.44 zone as shown on chart.
🧱 Support Levels:
₹14.23 (near-term support)
₹12.74 (base support zone)
🎯 Upside Target: ₹19.30 — if breakout sustains above ₹16.44 with strong volume.
📊 Volume Surge observed during recent rallies, suggesting accumulation.
💪 RSI above 70, signaling strength but also possible overbought conditions short-term.
💼 Shareholding Trend (as of June 2025):
=============================================
🏢 Promoter Holding stable at 44.06% (unchanged in 9 quarters).
🌍 FII/FPI holding increased from 0.31% (2023) to 4.95% (2025) — strong positive signal.
🏛️ DII holding steady around 6.63%.
📈 Non-Institutional holding has declined, suggesting smart money entry.
Conclusion:
================
“Smart money accumulation (FII/FPI rise), RSI breakout, and volume spike suggest a brewing breakout, but wait for confirmation above ₹16.44.”
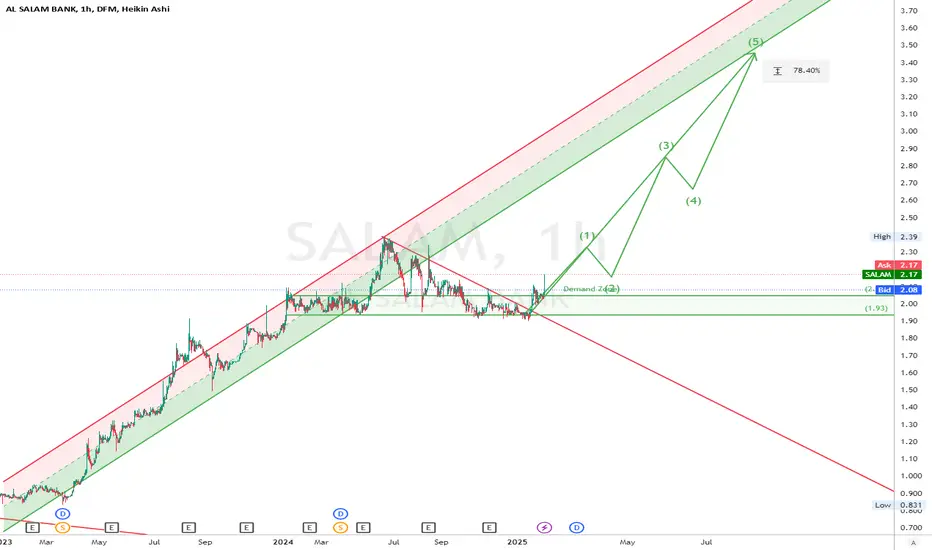
Al Salam (SALAM) DFM Buy Opportunity"SALAM " (Al Salam Bank) Recently bounced from a Daily Demand Zone, and breaking the downward correction trend line.
Buying Opportunity: The stock is currently at a discounted level and likely to resume the up trend again.
Trade safe.. :)
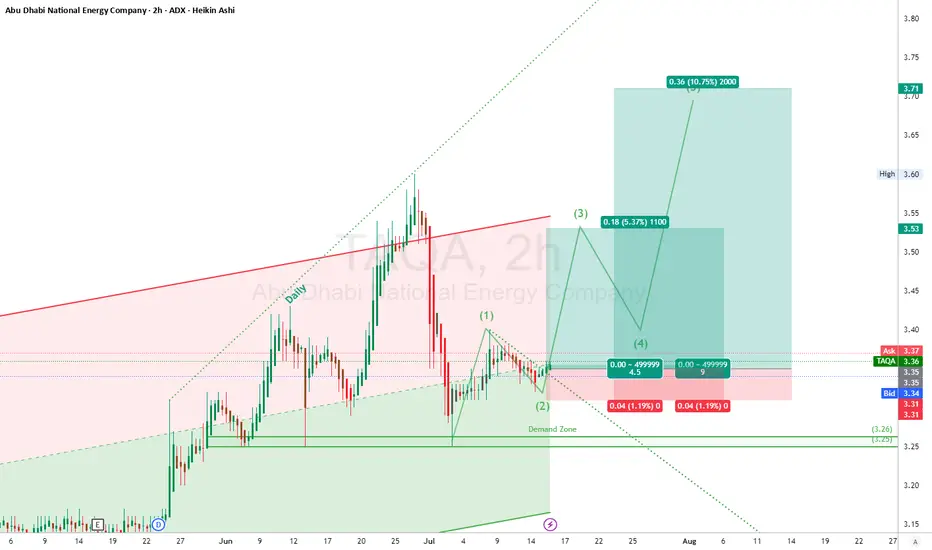
TAQA ADX Long setupTAQA just reset off that demand zone, carved out a clean Wave 2, and now revving for the Wave 3 engine. That 3.37 breakout could be the ignition — where the real fire starts.
Clear impulsive move starting late June; we’re likely in a Wave (3) of a new bullish sequence.
Wave (3) could extend toward 3.53–3.71 based on symmetry and momentum of previous wave.
🎯 Trade Setup (Long)
📍 Entry:** 3.36 (current level)
📉 Stop Loss:** 3.31 (below demand zone + Wave 2 low)
🎯 TP1: 3.53 (Wave 3 target)
🎯 TP2: 3.71 (Wave 5 target)
Risk/Reward Ratio
To TP1: \~4.5R
To TP2: \~9.0R+
“Opportunities come infrequently. When it rains gold, put out the bucket, not the thimble.”
⚠️ Disclaimer
This is not financial advice. Always do your own analysis and use stop losses. Markets carry risk — especially during earnings or news catalysts.
Bullish Gartley Pattern – Trade Setup on JD.comPotential Bullish Gartley pattern has formed with the following structure: XABCD.
initial low X = 23.45 , Price rallies to point A, then forms a corrective structure down to
D = 30.71 trough BCD. CD leg is downward, completing the pattern.
Despite the decline, point D is higher than X, suggesting a bullish setup. The area around D (30.71) is identified as a Potential Reversal Zone (PRZ).
Confluences Supporting a Long Entry
1. Gartley Completion at PRZ
Point D lies near the 78.6% Fibonacci retracement of the XA leg — a typical Gartley completion level.
2. Rising Support Trend Line
D is aligned with a yellow ascending trend line, reinforcing it as a potential bounce area.
3. MACD Bullish Divergence
Price makes a lower low into D, while MACD forms a higher low, signaling bullish momentum divergence.
Trade Plan
* Enter long after confirmation via a strong bullish candle*(e.g., bullish engulfing, hammer)
* Preferably accompanied by above-average volume
Stop Loss:
* Place stop just below point D (30.71)
* Allow a small buffer (e.g., 1–2% below) to account for noise
Targets – Fibonacci Retracement of CD Leg:
1. Target 1 – 38.2%
2. Target 2 – 61.8%
3. Target 3 – 78.6%
4. Target 4 – 100% (full retracement of CD)
Risk Management:
* Use appropriate position sizing (e.g., risk only 1–2% of total capital)
* Consider trailing the stop as targets are hit to lock in profits

PPL PROBABLY IN WAVE '' C '' - LONGThis is in continuation to our ongoing tracking of PPL wave structure
PPL is most probably in wave C of a Y or B wave which will target areas of 200 and further up 230 - 250 level. Our ideal buy zone is at 165 - 160, however looking at the market momentum we might not get to our buy zone and prices will rise directly.
We will enter long positions once market breaks above 178 level (keep eye on the volume), although entering market at 178 will significantly effect our risk/reward ratio compared to entering at the buy zone of 165 - 160, either ways we will take long positions.
Alternately, if the prices decline below 151.30 then this trade setup will get void, 151.25 can be used as stop loss.
Trade setup:
Entry price: 165 - 160 (Ideal) or 178
Stop loss: We are bullish on PPL long term therefore we will hold these positions
Targets:
T1: 198 - 200
T2: 230 - 250
Let see how this plays, Good Luck!
Disclaimer: The information presented in this wave analysis is intended solely for educational and informational purposes. It does not constitute financial or trading advice, nor should it be interpreted as a recommendation to buy or sell any securities.

Bullishpossible entry covering the green rectangle.
i see a new high but price do whatever it likes and may fail. so, as usual it's NOT a financial advice.
I share my thoughts, hope to hear from you. Auf Wiedersehen!
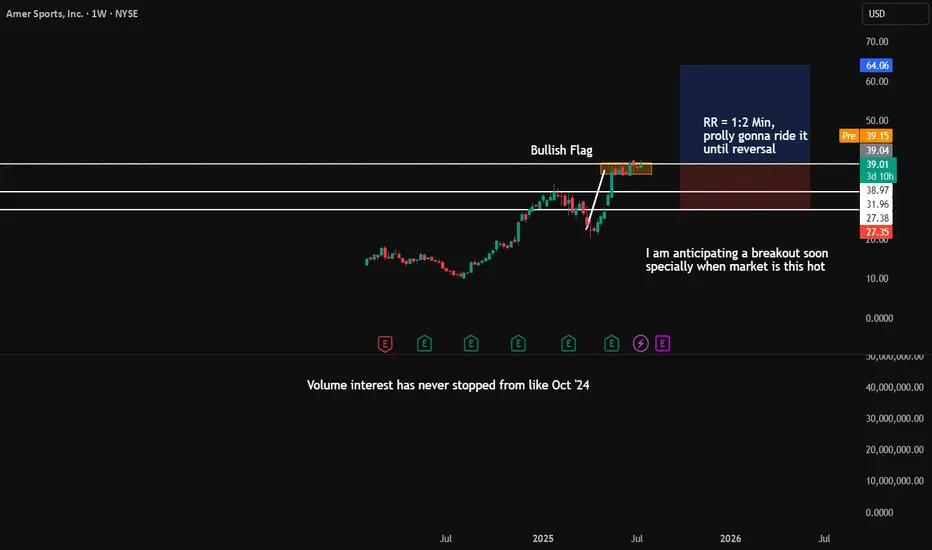
AS breakout anticipationThis company has regularly beaten the estimates.
The Fundamental trajectory is in uptrend.
What I love about this kind of stock is there is constant above average volume, the volume interest is keeping on rising from Oct '24. For me Bullish flag breakout is what's going to happen sooner or later.
Well pullback to $38.97 is possible, but with good risk management it will be easy for me to risk some for the potential huge breakout that I am anticipating.
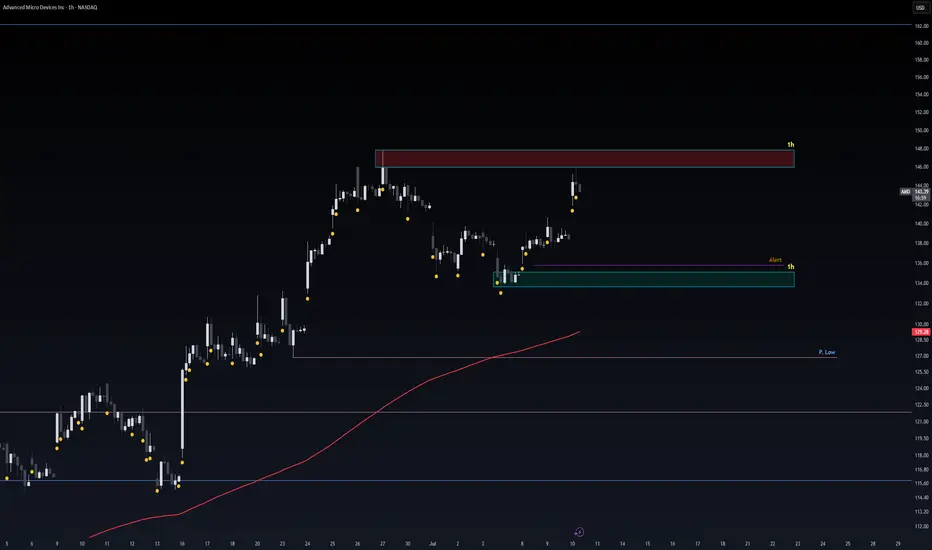
Safe Entry Zone AMDPrice Rejected From Resistance.
Safe Entry Green Zone.
Target after that 162$ price level.
Note: 1- Potentional of Strong Buying Zone:
We have two scenarios must happen at The Mentioned Zone:
Scenarios One: strong buying volume with reversal Candle.
Scenarios Two: Fake Break-Out of The Buying Zone.
Both indicate buyers stepping in strongly. NEVER Join in unless one showed up.
2- How to Buy Stock (safe way):
On 1H TF when Marubozu/Doji Candle show up which indicate strong buyers stepping-in.
Buy on 0.5 Fibo Level of the Marubozu/Doji Candle, because price will always and always re-test the
Take Care & Watch OUT !
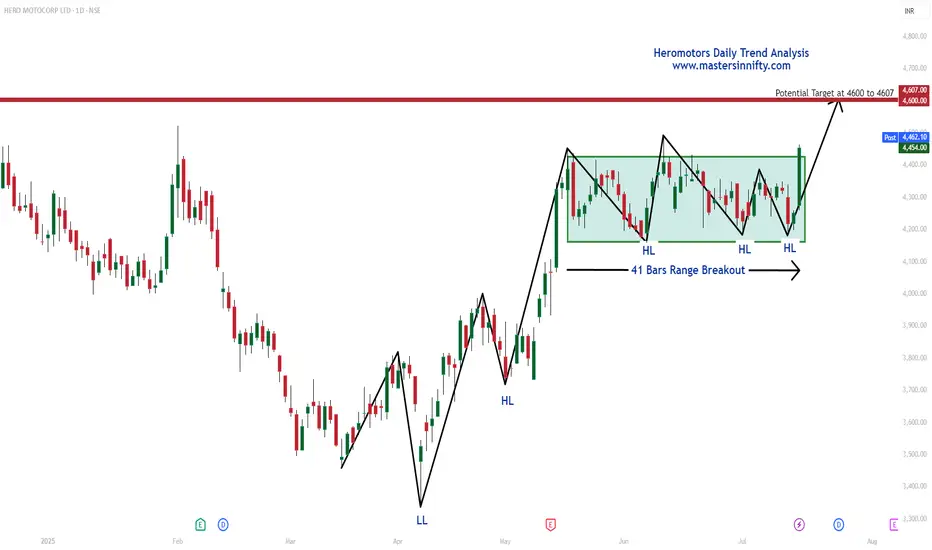
Heromotors Daily Trend Analysis"As per my Daily Trend Analysis, Heromotors Ltd has broken out of a 41-bar range and closed above it today. This breakout indicates a potential upward move toward the resistance zone of 4600 to 4607 in the coming sessions.
Traders are advised to perform their own technical analysis and ensure proper risk management before entering the trade."