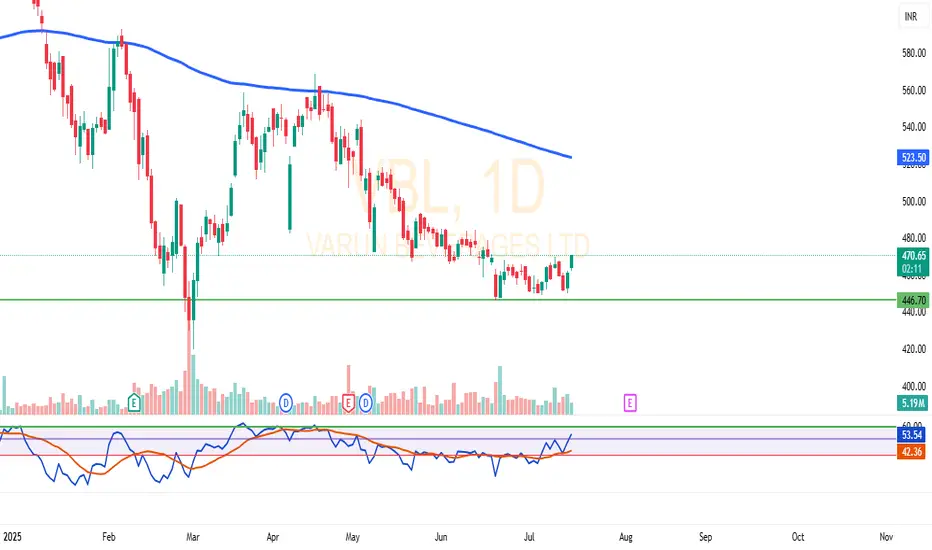
VBL Bounces from ₹446 Support – RSI Breakout with Volume SpikeVBL has shown multiple rebounds from the strong support zone around ₹446.
After several weeks of sideways consolidation, the stock is attempting a breakout with increased volume in the current session.
The RSI indicator has moved above the 50 level with a bullish crossover, indicating potential strength building up.
On the upside, the 200 EMA near ₹523 may act as a resistance level.
📊 This is a technical observation based on price structure, volume, and momentum — not a buy/sell recommendation.
The setup appears interesting for technical traders watching for a breakout from this range.
🔍 What’s your take on this pattern? Feel free to share your view in the comments.
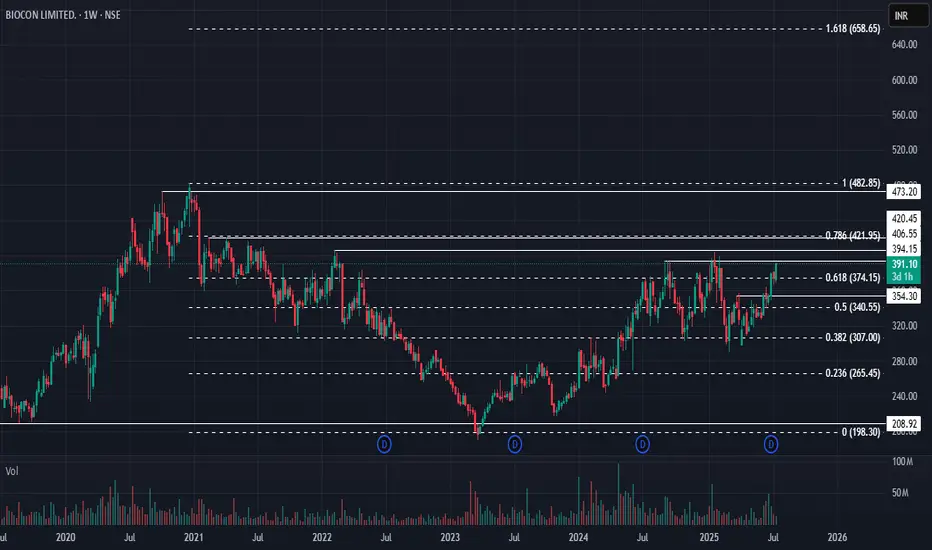
Biocon: Heading for All-Time High?🚀 Biocon: Heading for All-Time High? 🚀
📉 CMP: ₹390
🔒 Stop Loss: ₹330
🎯 Targets: ₹428 | ₹478 | ₹560
🔍 Why Biocon Looks Promising?
✅ Weekly Rounding Bottom Breakout: Breakout triggered above ₹390
✅ Weekly Box Breakout: Confirmation above ₹398 strengthens the setup
✅ Final Confirmation: A weekly close above ₹402 will validate the breakout for a potential strong upside
💡 Strategy & Risk Management:
📈 Phased Entry: Build positions gradually post confirmation to manage risk effectively
🔒 Strict SL: Maintain stop loss at ₹330 to protect capital in case of reversal
📍 Outlook: Biocon is showing strong technical signals with an all-time high on the radar, making it a compelling positional trade setup.
📉 Disclaimer: Not SEBI-registered. Please do your own research or consult a financial advisor before investing.
#Biocon #PharmaStocks #TechnicalBreakout #AllTimeHigh #SwingTrading #StockMarket #InvestmentOpportunities
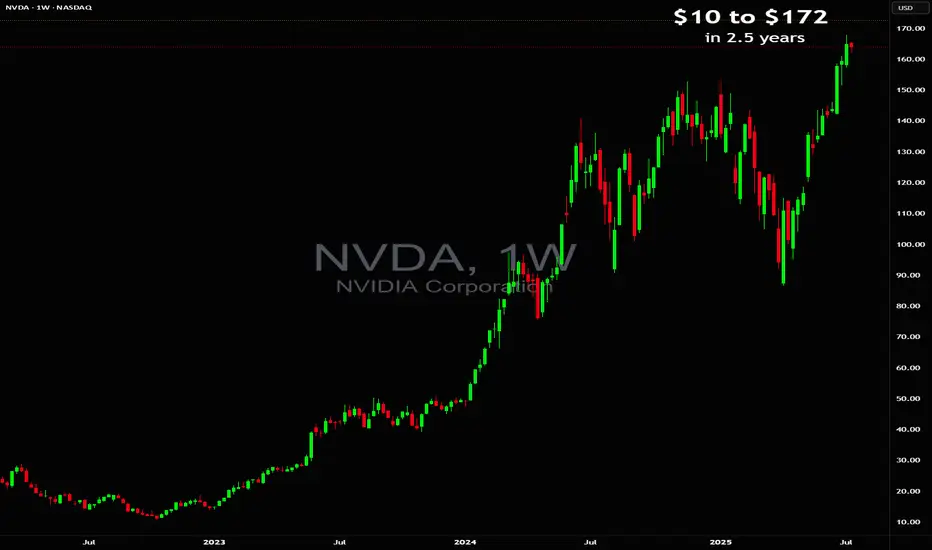
How expensive is Nvidia today?How expensive is NASDAQ:NVDA today?
❗ You're paying $40 today for $1 of next year's earnings
That's what Nvidia's forward P/E 40x means at current $172 per share
AI might be the future but you're prepaying for it like it's 2060 🤖
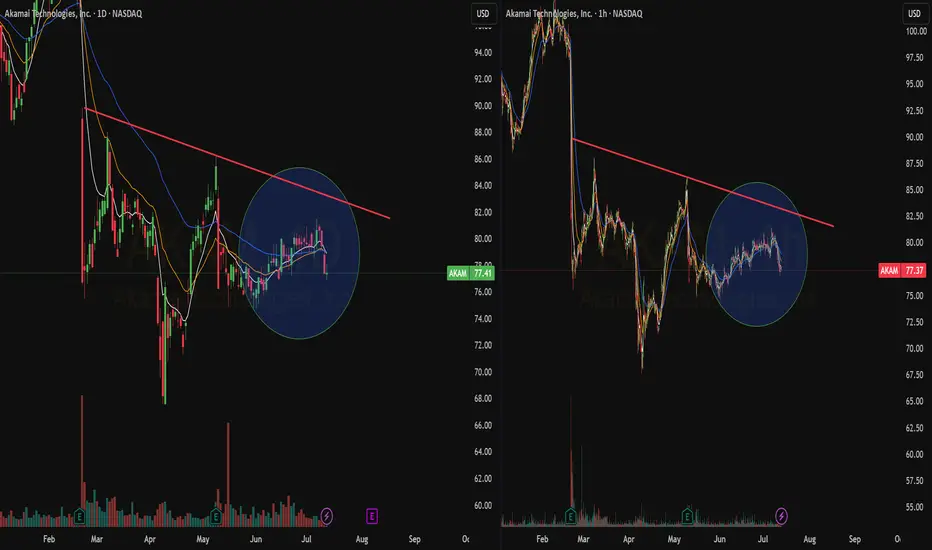
QuickView : AKAMOn the daily Chart the price is trying to make a move higher without success. Bears are still in control and a new bearish crossover is coming.
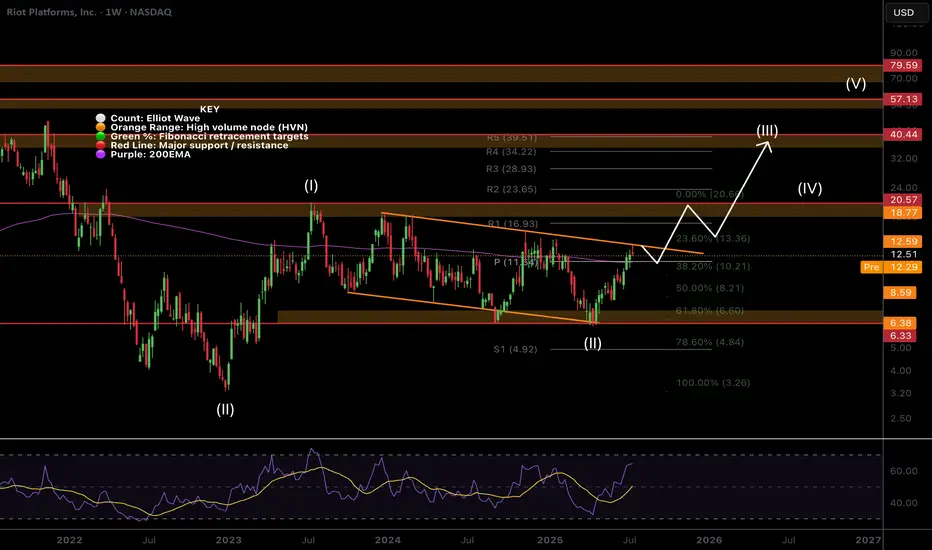
$RIOT Hit The Target Whats Next?NASDAQ:RIOT hit the descending orange resistance were I took partial take profits on my trade this week and it was immediately rejected as expected.
Price is now above the weekly pivot so that is the next support. This level also matches the weekly 200EMA.
Wave (II) hit the 'alt-coin' golden pocket of 0.618-0.786 Fibonacci retracement at the High Volume Node (HVN) support and descending support line which kicked off wave (III).
A breakout above the descending resistance line bring up the the next target of the HVN and previous swing high at $18-20 and $40 following a breakout above that.
Safe trading
$MARA Hits the Weekly PivotNASDAQ:MARA path has been grinding higher clearing the High Volume Node (HVN) resistance where it is sat as support.
The weekly pivot rejected price perfectly so far but if the count is correct and Bitcoin doesn't dump I expect this continue strongly towards the descending orange line resistance as my partial take profit target.
Once that line is broken i am looking at terminal bull market targets of $80 but will of course take profit at key areas along the way.
Wave 2 swung below the descending support and recovered at 0.5 Fibonacci retracement potentially kicking off wave 3.
Safe trading

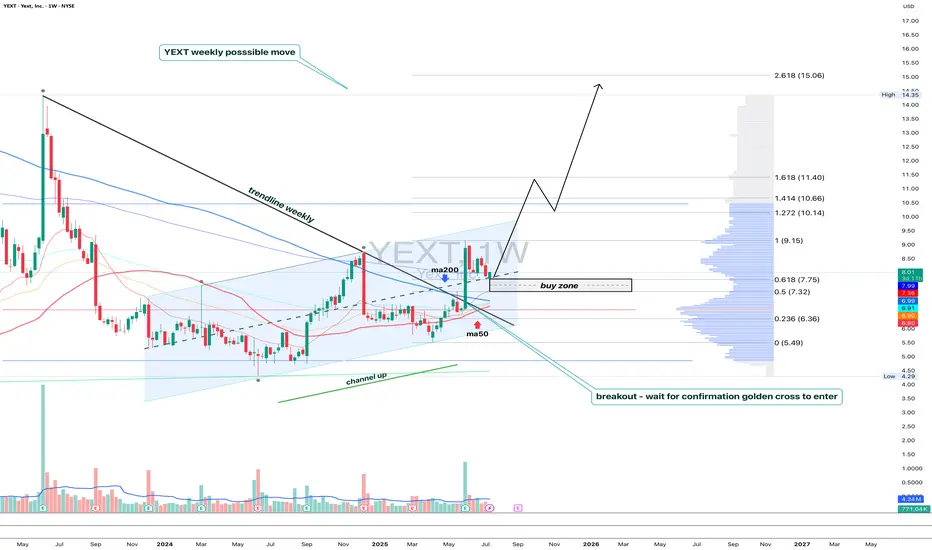
YEXT 1W - breakout confirmed, retest inside bullish channelYext stock just pulled a clean breakout of the weekly downtrend line, retested the buy zone around the 0.5 Fibo level ($7.32), and is now bouncing within a rising channel. The 200MA and 50EMA are both below price, supporting a shift in trend even though the golden cross hasn’t formed yet. The volume increased on breakout, and there's low overhead supply - a classic setup for continuation. The arrow shows the expected move, contingent on confirmation.
Targets: 9.15 - 11.40 - 15.06
Fundamentally, Yext offers enterprise-grade AI-powered search solutions and recently gained attention with new product updates. With AI adoption accelerating, the company may ride the next wave of institutional interest.
When price retests the zone, MA is supportive, and there's no overhead resistance - that’s not noise, that’s a signal.
$HUT Clear for Further Upside?NASDAQ:HUT is having a great time clearing resistances, the weekly 200EMA and the weekly Pivot point did not prove challenging.
It is currently sitting in a High Volume Node (HVN) where price is likely to reject and retest the weekly pivot as support before continuing upwards towards $32 and beyond in wave 3.
Wave 2 tested the 'alt-coin' golden pocket between 0.618-0.782 Fibonacci retracement giving me confidence in the count.
Safe trading

Quick View: $AZN- On the daily Chart the price is testing now the lower side of the channel with a new bullish crossover and positive price action. Looks like there is a great chance for a new entry here

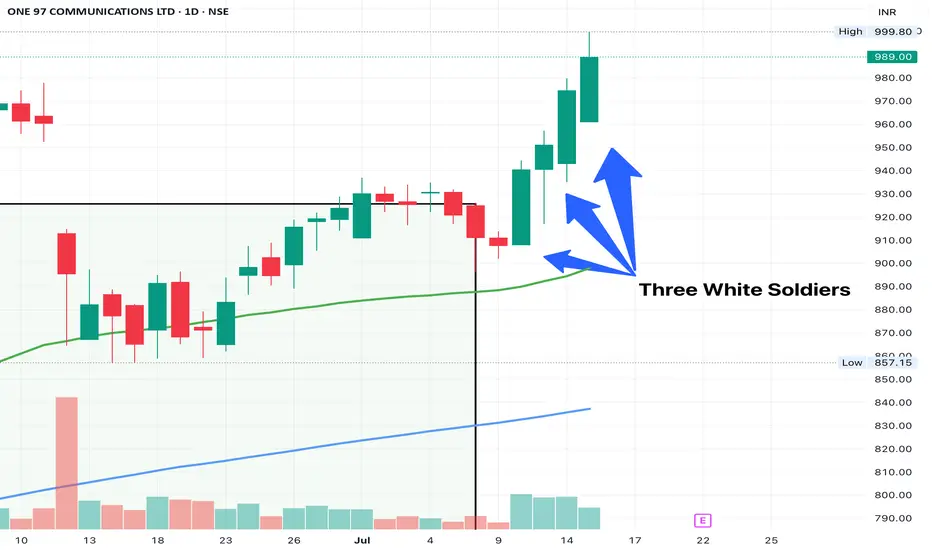
PAYTM - 3 WHITE SOLDIERSNo. of Candles: 3
Trend Context: Appears after a downtrend or consolidation (best)
Body Size: Long real bodies (bullish)
Wicks: Small or nonexistent lower wick
Volumes: > avg of 10 days
My criteria for spotting 3 white soldiers -
Each candle needs to opens within or slightly below the previous candle’s body and closes higher than the previous candle.
The candles also have a small or no lower shadow, indicating consistent buying pressure.
High on volumes
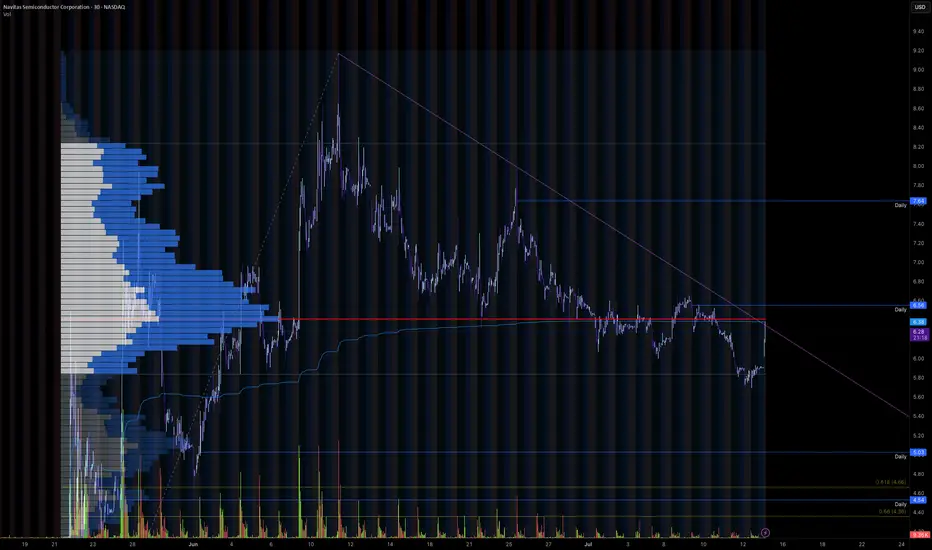
Trendline Breakout for Wave 3Navitas is currently looking at breaking out of its recent downtrend to potentially begin wave 3 of its move up, which, as we all know, is the most impulsive move.
Could be very tasty after a 350% pump already
Need to get above the range POC and breakout of the trend line, would be looking to get in on the retest of the downtrend line.
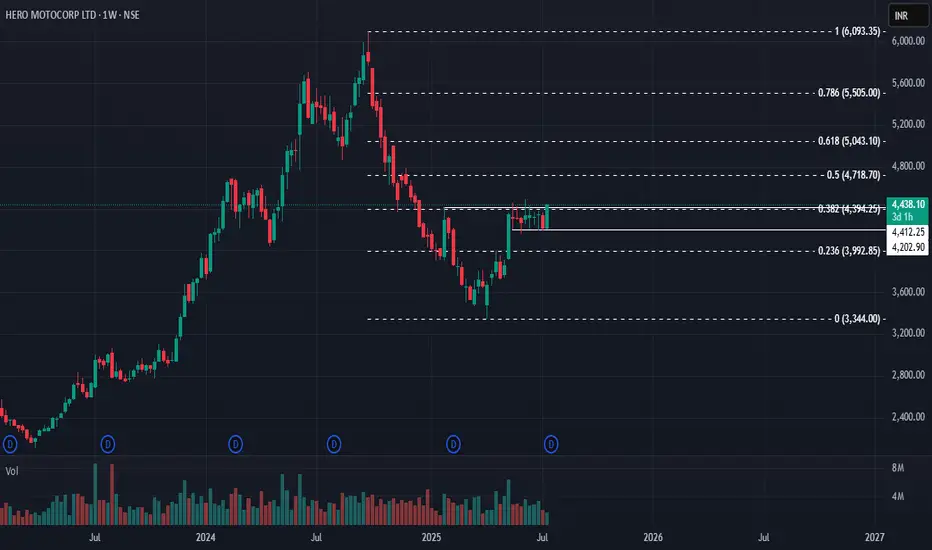
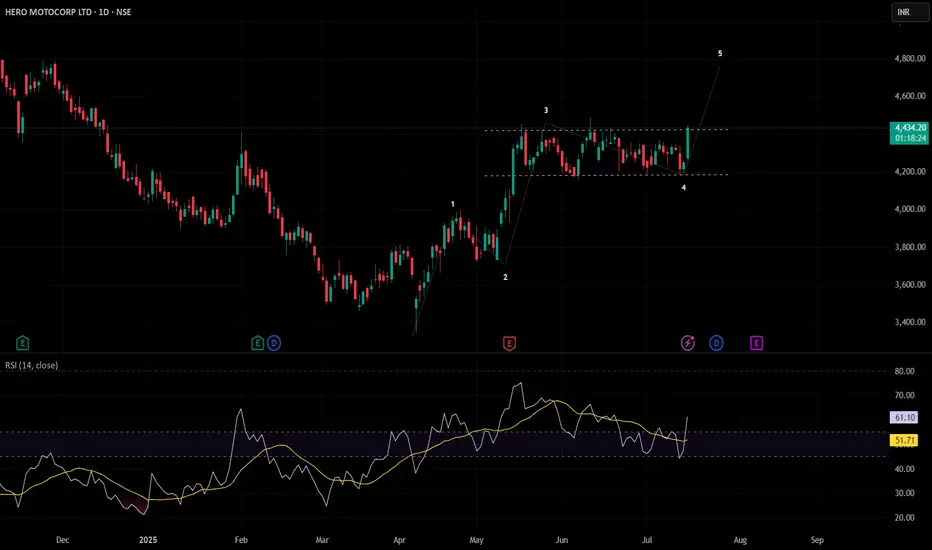
Hero MotoCorp: Reversal in Sight? 🚀 Hero MotoCorp: Reversal in Sight? 🚀
📉 CMP: ₹4438
🔒 Stop Loss: ₹4090
🎯 Targets: ₹5030 | ₹5700
🔍 Why Hero MotoCorp Looks Promising?
✅ Rounding Bottom Breakout: Weekly close above ₹4412 confirms this bullish reversal pattern
✅ Box Breakout: 8-week consolidation range of ₹4454–₹4202 broken above ₹4460, signalling strength
✅ Flag & Pole Setup: Larger range of ₹3354–₹4454 forms a flag-pole structure with breakout above ₹4460
💡 Strategic Insight:
📈 Confirmation Level: A weekly close above ₹4500 will further confirm reversal for long-term upside
🔒 Strict SL: Maintain stop loss at ₹4190 to manage downside risks effectively
📍 Outlook: Multiple technical setups indicate potential for a long-term bullish reversal with targets up to ₹5700.
📉 Disclaimer: Not SEBI-registered. Please do your own research or consult a financial advisor before investing.
#HeroMotoCorp #AutoSector #TechnicalAnalysis #BreakoutTrade #ReversalPattern #SwingTrading #StockMarketIndia #InvestmentOpportunity
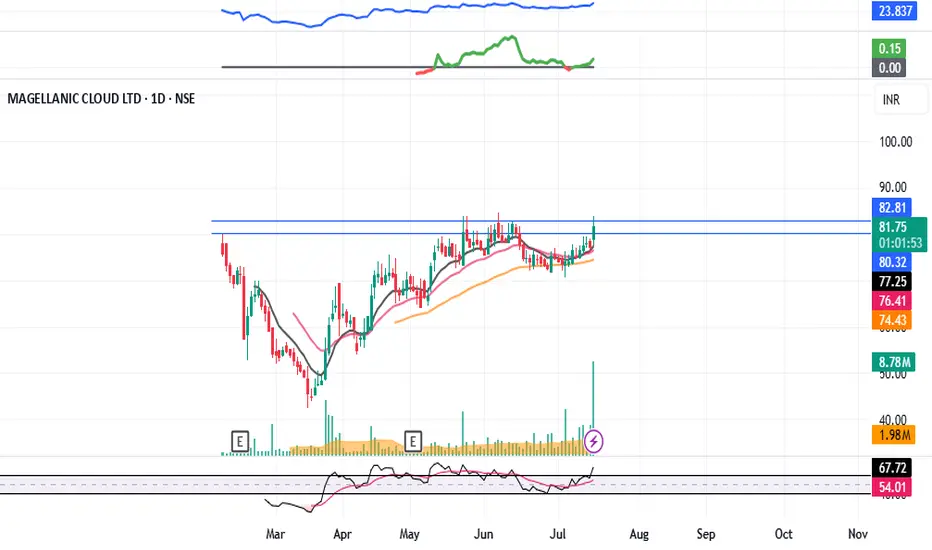
MCLOUD : Post IPO Base Breakout#MCLOUD #IPOstock #breakout #momentumstock #patterntrading #cupandhandle
MCLOUD : Swing Trade
>> Post IPO Base Breakout
>> Cup & Handle Pattern
>> Trending Stock
>> Good Strength & Volume Building-up
Swing Traders can lock profit at 10% and keep trailing
Pls Boost, Comment & Follow for more analysis
Disc : Charts shared are for Learning purpose not a Trade Recommendation, Take postions only after consulting your Financial Advisor or a SEBI Registered Advisor.
$CLSK Trapped between Critical Resistance and Support?NASDAQ:CLSK Shot through the weekly 200EMA and hit the weekly pivot resistance and was rejected into the High Volume Node (HVN) just below.
If the count is correct we should see price breakthrough in wave 3 after some consolidation and continue up after wave 2 tested the .618 Fibonacci retracement and HVN as support.
Heavy resistance HVN coupled with the R1 pivot at $20.40 will prove another challenge to overcome. Ultimately, if the count is correct AND Bitcoin doesn't tank we can expect a challenge of the all time highs up at $60.
I already closed partial take profit myself at the weekly pivot on a recent trade and will be looking to go long again to the those targets. Make sure to always be taking profits on the way as nobody has a Crystal ball!
RSI is currently printing a bearish divergence on the weekly so we need to see that negated.
Analysis is invalidated below $6.
Safe trading

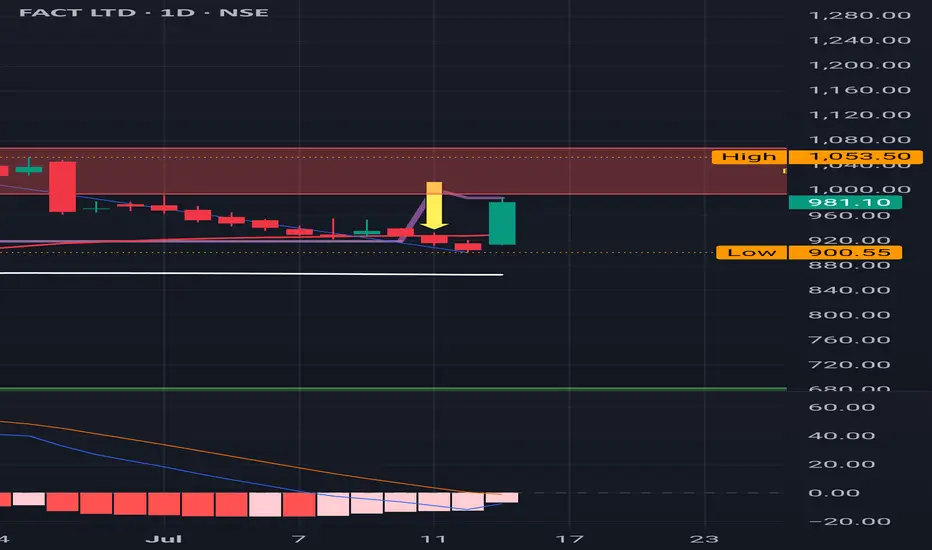
FACT : Approaching a major Red Band Resistance FACT : Approaching a major Red Band Resistance .
Important Level to watch for is 1112 .
( Not a Buy / Sell Recommendation
Do your own due diligence ,Market is subject to risks, This is my own view and for learning only .)
HERO MOTOCORP LTD. breaking outHero looking good for a swing.
Hero MotoCorp is showing signs of a breakout above ₹4,420 with strong buying momentum. If the price stays above this level with good volume, it could rise toward ₹4,930–₹5,000. This looks like a good opportunity for swing traders to enter and aim for higher gains.
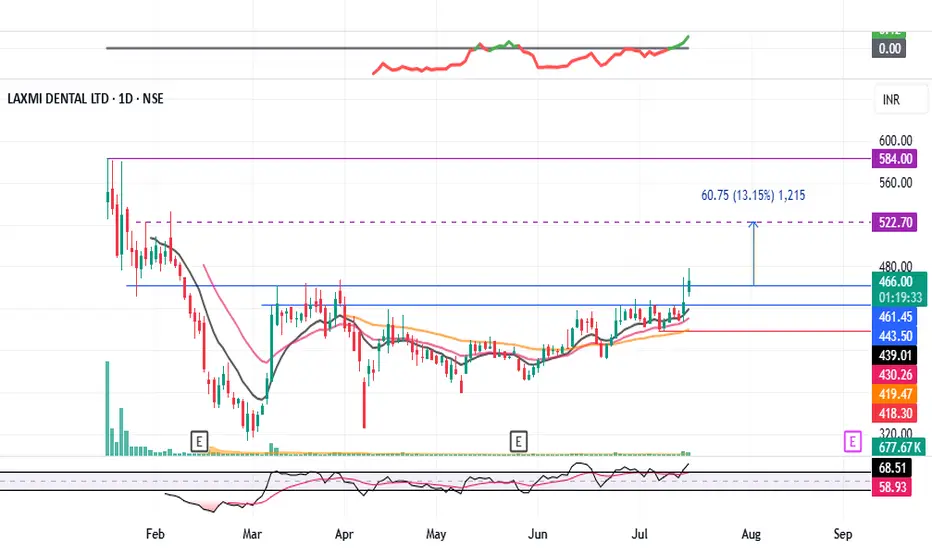
LAXMIDENTL : Consolidation Breakout#LAXMIDENTL #breakout #breakouttrading #ipostock
LAXMIDENTL : Swing Trade
>> Consolidation Breakout
>> Volumes Building up
>> Stock in Momentum
>> Good Strength in stock
>> Trending setup
Swing Traders can lock profit at 10% and keep trailing
Pls Boost, Comment & Follow for more analysis
Disc : Charts shared are for Learning purpose not a Trade Recommendation, Take postions only after consulting your Financial Advisor or a SEBI Registered Advisor.
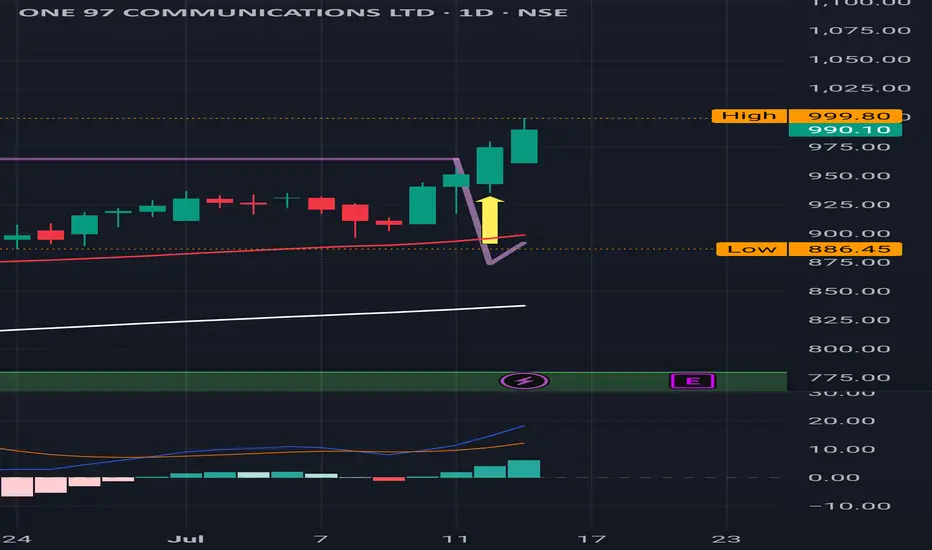
Paytm : Buy Triggered ,next level to watch for is 1062
Paytm : Buy Triggered ,next level to watch for is 1062.
( Not a Buy / Sell Recommendation
Do your own due diligence ,Market is subject to risks, This is my own view and for learning only .)
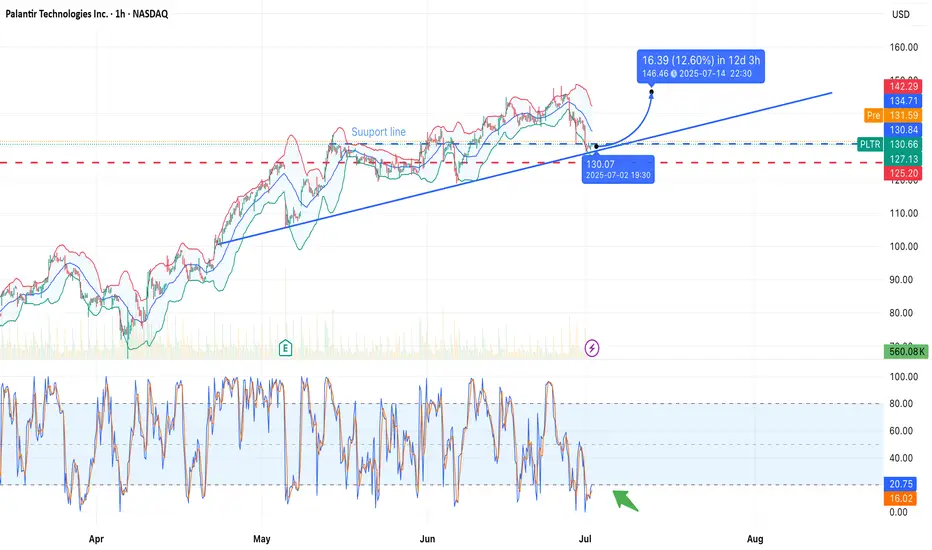
Palantir Technologies (PLTR) — Bounce in Progress?NASDAQ:PLTR is testing a long-term ascending trendline near the $128.79 level, which also aligns with a horizontal support zone. A potential rebound is forming with a projected move toward $145.94 — a +13.32% gain in 12 days.
Technical Highlights:
• Support zone: $128.79 (trendline touch + horizontal level).
• Stochastic Oscillator: Deep in oversold territory — bullish crossover forming (green arrow).
• Bollinger Bands: Price pierced lower band — reversion to the mean is likely.
• Volume: Stable, with room for momentum pickup.
Targets:
• First resistance: $134.71
• Primary target: $145.94
• Stop level: below $127 (to invalidate bullish thesis)
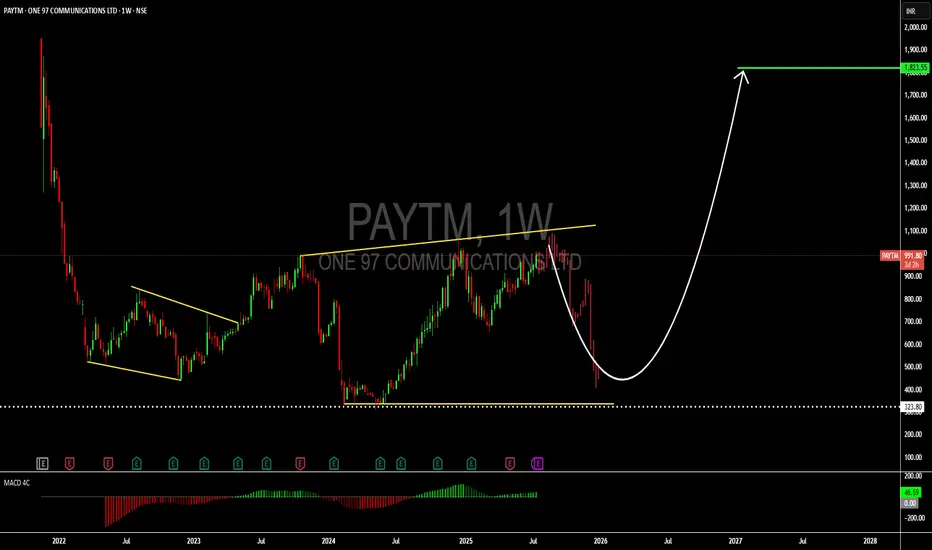
A long-term hold: PAYTM stockHello,
One 97 Communications Ltd. or PAYTM engages in the development of digital goods and mobile commerce platform. It operates through the following segments: Payment, Commerce, Cloud, and Others. The company was founded by Vijay Shekhar Sharma on December 22, 2000 and is headquartered in Noida, India.
The company's revenue continues to grow over time. During the 4th Quarter ended 31st March 2025, PAYTM reported revenu of $224M up from $214Mn in the previous quarter (Up 5% QoQ). The company is also now close to break-even from a profit after tax metric. PAT* of $(3) Mn, an improvement of $22 Mn QoQ. The business generated a net payment margin of $68mn including UPI incentive.
To continue driving value growth, the company states that they will be focusing on the below pillars;
Merchant payments
Consumer acquisition
International business
Financial services
Looking at the The Paytm Q4 FY25 report reveals several compelling opportunities for growth and profitability. The expanding merchant ecosystem, now at 12.4 million devices, provides a strong foundation for deeper financial services penetration, particularly merchant lending, which has seen consistent growth and high repeat rates. With India’s MSME sector largely underpenetrated in digital payments, there is a vast opportunity to deploy innovative payment solutions, especially in tier-2 and tier-3 cities. Additionally, the company’s focus on new products like the Solar and Mahakumbh Soundbox positions it well to enhance merchant engagement and retention. The financial services segment, buoyed by better asset quality and growing lender partnerships, offers room for scale in both lending and wealth management. Furthermore, regulatory prospects such as the introduction of MDR on UPI payments for large merchants could open new monetization pathways. International expansion, though longer-term, presents another avenue for replicating Paytm’s tech-driven financial services model in other markets.
While the situation looks positive, there are a few risks for this company.
Regulatory uncertainty
Credit cycle sensitivity
Competitive pressure
Security risks as Paytm scales its plartforms.
Dependence on incentives
The above risks are likely to delay or limit Paytm’s ability to achieve sustained profitability and growth across its payment, lending, and financial services segments. From a technical perspective, we see PAYTM as a long term buy or hold seeing long term opportunity for massive growth in the company.
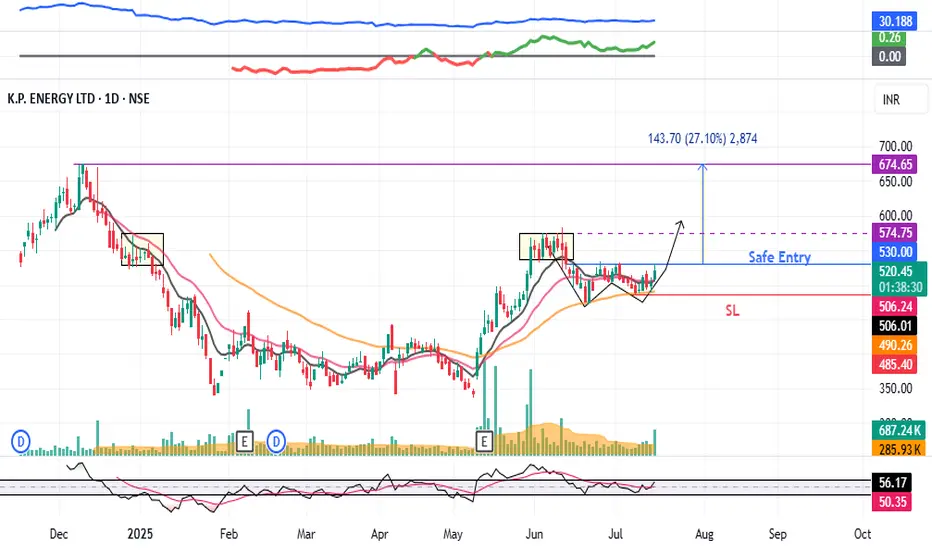
KPEL : Breakout stock#KPEL #swingtrade #breakoutstock #Wpattern #patterntrading
KPEL : Swing Trade
>> Trending Stock
>> W Pattern Breakout soon
>> Good Volumes & Strength
>> Good upside potential
Swing Traders can lock profit at 10% and keep trailing
Pls Boost, Comment & Follow for more analysis
Disc : Charts shared are for Learning purpose not a Trade Recommendation, Take postions only after consulting your Financial Advisor or a SEBI Registered Advisor.
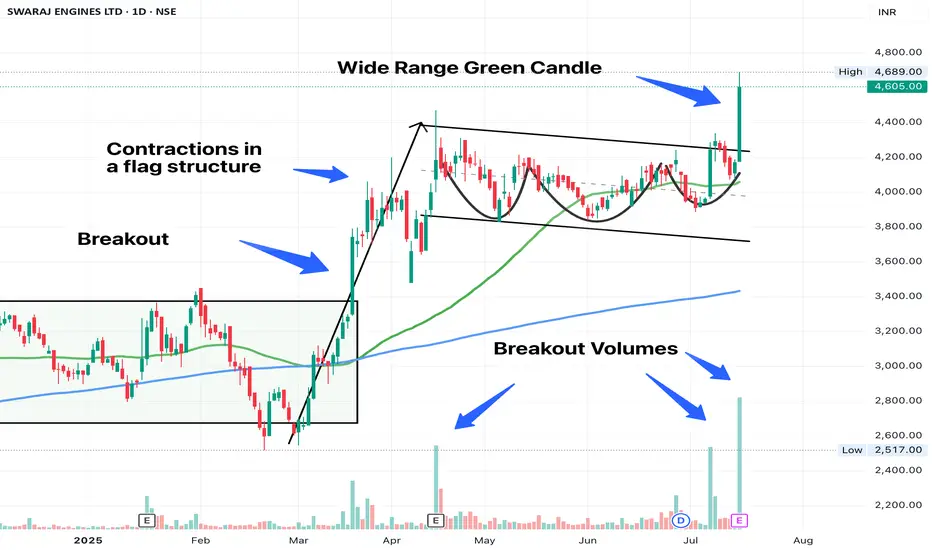
SWARAJ ENGINE - Textbook StructureContractions within a flag is such a beautiful thing to see.
SL - Low of todays candle. End of day candle should have minimal wick ideally.
Choose a progressive exposure method of entry
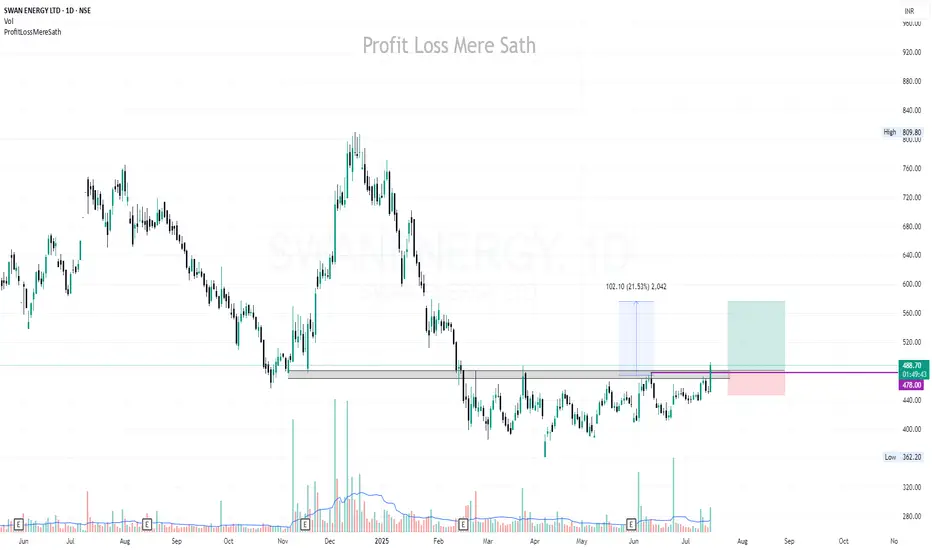
SWANENERGY | Risk-Takers Buy @LTP, Safer Buy Above 480 closing..Disclaimer:
This is not financial advice. Please do your own research or consult with a financial advisor before making any investment decisions. Investments in stocks can be risky and may result in loss of capital.