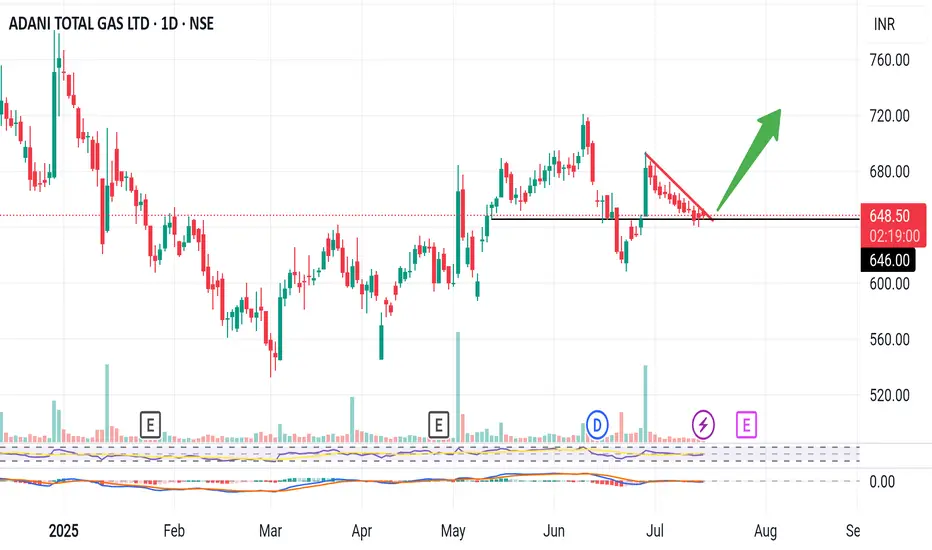
Atgl ready for big jump . Atgl accumulation phase going on. Anytime big breakout possible target 690/720/770...sl 610 below day close .risk reward 1:2/1:3/1:5. Choice z yours
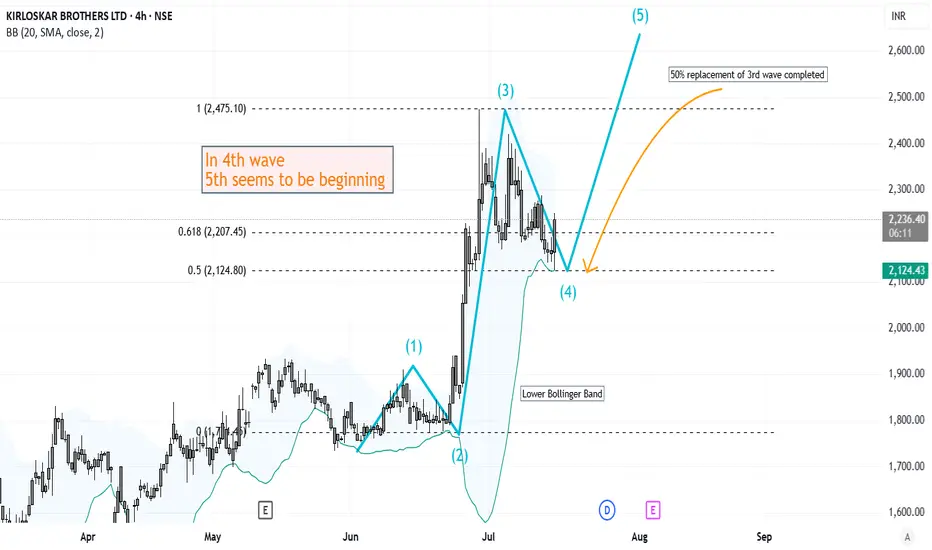
Elliott Wave Analysis of Kirloskar Brothers KIRLOSBROSThe script is currently in 4th wave of hourly chart. The 4th wave seems to be ending, which means a 5th wave will start from here. The wave patters and patterns, retracements and analysis have been highlighted on the chart. Will update this as it progresses.
SWIGGY - Breakout Soon (1-3 months)#SWIGGY #breakoutstock #patterntrading #cupandhandle #roundingbottom #trendingstock
SWIGGY : Swing Trade (1-3 Months)
>> Breakout candidate
>> Trending stock
>> Cup and handle pattern
>> Rounding bottom in the long run
>> Good Strength & Volumes Dried up
Swing Traders can lock profit at 10% and keep trailing
Pls Boost, Comment & Follow for more analysis
Disc : Charts shared are for Learning purpose not a Trade Recommendation, Take postions only after consulting your Financial Advisor or a SEBI Registered Advisor.

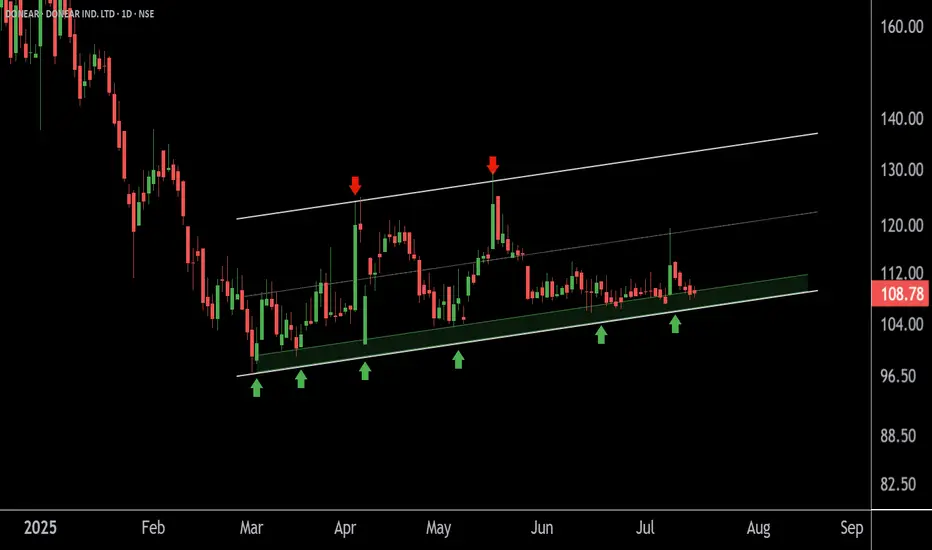
DONEAR at Best Support Zone !!This is the daily chart of Donear Industries.
Donear is moving in well defined parallel channel having a good support zone near 105 level.
if this level is sustain , then we may see higher prices in Donear .
Thank You !!
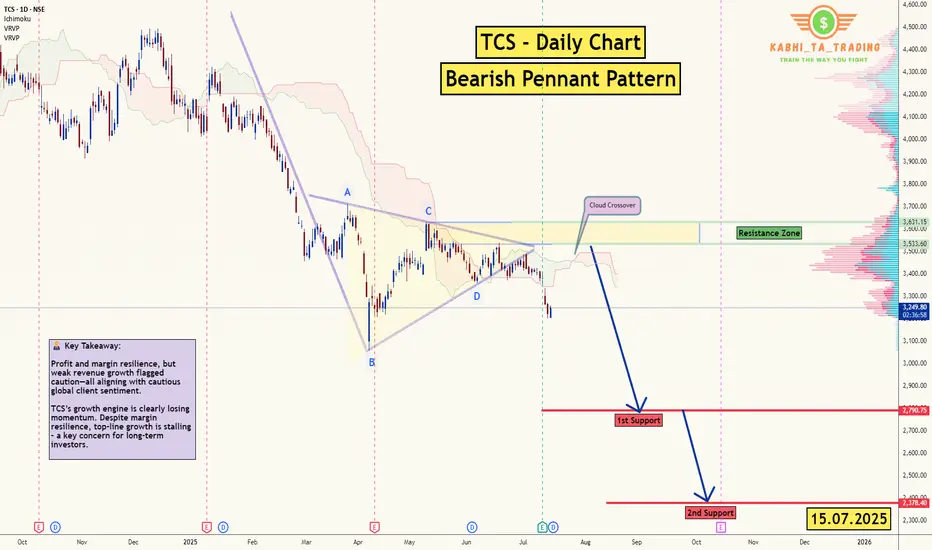
TCS - D1 - Bearish Pennant 🧾 1. 📊 Q1 FY26 Earnings Summary
i. Revenue: ₹63,437 cr (~US $7.4 bn), up just 1.3% YoY, missing expectations of ~₹64,667 cr
ii. Profit/margin held up; revenue disappointed.
📌 Key Takeaway: Profit and margin resilience, but weak revenue growth flagged caution—all aligning with cautious global client sentiment.
🔮 2. Upcoming Events & Catalysts :
Ex‑Dividend Date: Record date July 16, for interim dividend of ₹11/share.
Macro Cues: U.S. tariff developments, global IT spend trends, and sector peers (HCL, Infosys) Q2 reports. Reflation in IT services could shift sentiment.
TCS Investor Engagements: Gen‑AI STEM program (Jul 9); presence at global fintech & life‑sciences events through Sep (SIBOS, COBA) .
📆 3. Catalysts Ahead :
Global IT Budget Trends (esp. U.S. and Europe) → direction for next‑quarter bookings.
Peer Q2 Results (HCL, Infosys) → could provide broader sector cues.
New Deal Wins from BFSI/USD clients → margin & growth potential.
Macro Developments: Trade policies, Fed signals, and inflation data.
Thank you.
Nvidia at a CrossroadsNvidia at a Crossroads: Unstoppable Growth, Geopolitical Tensions, and Fears of Talent Drain to China
Ion Jauregui – Analyst at ActivTrades
Nvidia’s rise as a central player in the artificial intelligence revolution has not been a solitary journey. The company, now valued at over $4 trillion, has built a complex network of suppliers, strategic clients, and industrial partners that fuel its growth. However, this success has also placed the firm under the scrutiny of U.S. authorities, especially amid growing fears of knowledge transfer to China.
Washington on Alert: National Security Risks?
The U.S. government has begun to closely monitor the hiring of foreign talent in strategic sectors. One of its main concerns is the potential unintentional transfer of advanced military knowledge to China through engineers working at companies like Nvidia. The company’s chips power everything from data centers to autonomous systems, and part of its strength lies in the know-how contributed by its employees—many of whom are of Asian descent—to the development of these key technologies.
Although the company benefits enormously from hiring highly skilled engineers—many of them trained in U.S. universities—there is concern in Capitol Hill and the Pentagon that some of these specialists, directly or indirectly, could end up collaborating with China’s People’s Liberation Army. The U.S. Department of Commerce and the Pentagon have increased scrutiny of technical staff with links to China, particularly after identifying several cases of dual-nationality engineers involved in sensitive projects. According to intelligence sources cited by outlets such as Bloomberg and The Washington Post, internal investigations have been launched to review hiring policies at key semiconductor companies. There is concern that without stricter measures, U.S. technological know-how—especially related to dual-use civilian-military GPUs—could leak and accelerate the development of Chinese military capabilities, including AI for warfare.
The Ecosystem Powering Nvidia
Nvidia does not manufacture its own chips: it relies primarily on Taiwan Semiconductor Manufacturing Company (TSMC), which produces its most advanced units—such as the H100 and the new B200 Blackwell chips—using 3 and 4 nanometer processes. Pressure from the U.S. government to relocate production led TSMC to build a factory in Arizona as a geostrategic response to ensure supply on American soil.
Additionally, companies like SK Hynix, Micron, Wistron, and Flex form a key supply chain, providing everything from HBM memory to full system assembly. In parallel, Nvidia has accelerated development of the HBM4 chip amid growing competition from new players such as AMD and AI divisions of Chinese firms.
An AI-Powered Empire: Voracious Clients and Strategic Alliances
Meanwhile, Nvidia’s rise has been meteoric. From a napkin sketch in 1993 to a market cap surpassing $4 trillion, the company has gone from revolutionizing video games to becoming the heart of artificial intelligence. The key lies in its GPUs (such as the H100 and the new B200), which power language models like ChatGPT and Llama-4.
Its supplier network includes TSMC, SK Hynix, Micron, and Wistron, while on the demand side, Microsoft, Meta, Amazon, Alphabet, and Super Micro are among the giants boosting its revenue. In fact, Microsoft alone accounts for nearly 19% of Nvidia’s revenue. Microsoft leads with over $29 billion invested, while Meta allocates more than 9% of Nvidia’s total revenue to training its Llama-4 model. Even Amazon, which develops its own Trainium and Graviton chips, continues to purchase Nvidia GPUs due to high customer demand for cutting-edge products.
Now, all hopes are pinned on the new generation of Blackwell chips. The B200 promises performance up to 30 times higher than the H100 in generative AI tasks, positioning it as the new industry standard. But as the market matures, competition, regulation, and geopolitical risks are all intensifying.
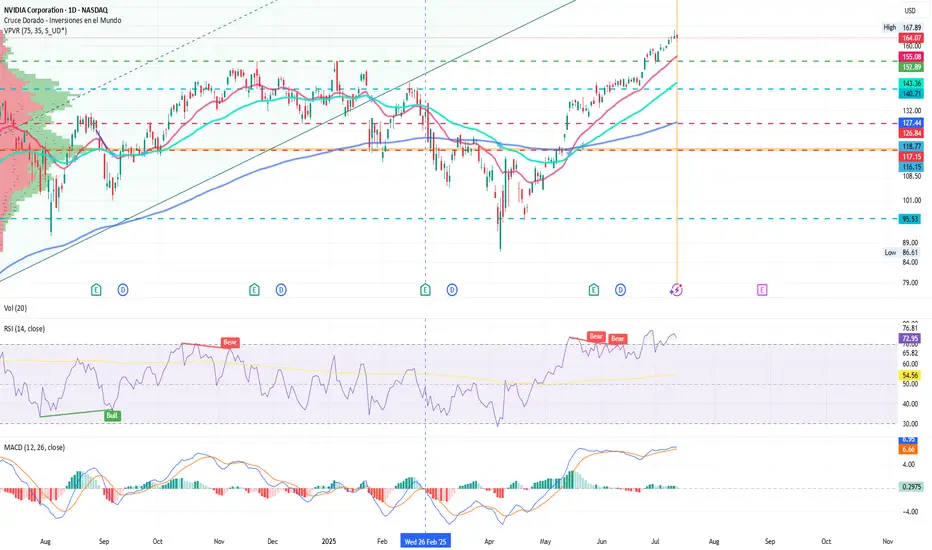
Technical Analysis of Nvidia (NVDA)
Nvidia (NVDA) shares closed yesterday at $164.07, slightly below its all-time high of $167.89. On the daily chart, we observe a consolidation movement after hitting a new record high on Friday. The price remains within an upward channel that began in January 2024.
Key Support: $141.75 (above the 50-session moving average), a level defended by buyers during recent pullbacks.
Immediate Resistance: $167.89 (all-time high). A breakout with volume could open the door to $180 as the next psychological target.
Technical Indicators:
The daily RSI stands at 72.95%, reflecting strong overbought conditions and suggesting continued buying interest.
The moving averages remain in a wide bullish crossover, with no clear sign of directional reversal.
The volume point of control (POC) sits at $118, at the lower end of the consolidation zone.
The MACD continues in a bullish crossover pattern, although it’s starting to show a loss of momentum. This could signal that the price push is weakening, indicating a bearish divergence between price and volume.
The technical outlook remains bullish, but a short-term pause or sideways movement is not out of the question—especially if regulatory pressure or the next quarterly results fail to meet high market expectations. The key level to watch is around $141 as the structural support to maintain the uptrend.
The Future? A Mix of Innovation and Oversight
Nvidia embodies the spirit of Silicon Valley, but its privileged position also makes it a central piece on the global geopolitical chessboard. While its technology drives scientific, medical, and consumer advancements, its ties to Asia and openness to foreign talent will continue to spark friction with Washington.
The big question is whether it can continue to lead the AI race without destabilizing the delicate balance between national security and technological innovation. Time—and the regulators—will tell.
*******************************************************************************************
The information provided does not constitute investment research. The material has not been prepared in accordance with the legal requirements designed to promote the independence of investment research and such should be considered a marketing communication.
All information has been prepared by ActivTrades ("AT"). The information does not contain a record of AT's prices, or an offer of or solicitation for a transaction in any financial instrument. No representation or warranty is given as to the accuracy or completeness of this information.
Any material provided does not have regard to the specific investment objective and financial situation of any person who may receive it. Past performance and forecasting are not a synonym of a reliable indicator of future performance. AT provides an execution-only service. Consequently, any person acting on the information provided does so at their own risk. Political risk is unpredictable. Central bank actions can vary. Platform tools do not guarantee success.
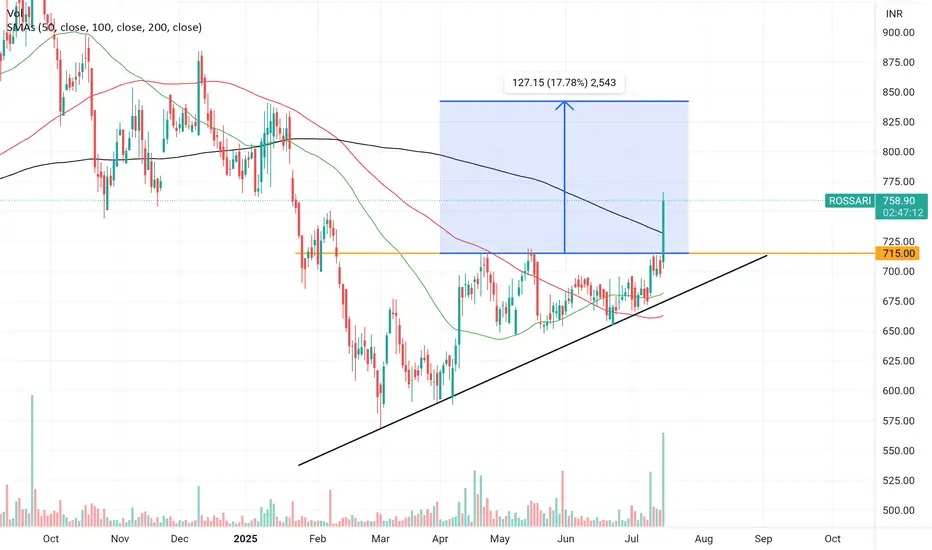
Triangle pattern break out in Roosari Triangle pattern break out in Roosari biotech, Stock is trading above all important moving average (50,100,200). Possible target will be around 840 with a stoploss of 700.
It's not a buy or sell recommendations,For educational purpose only.
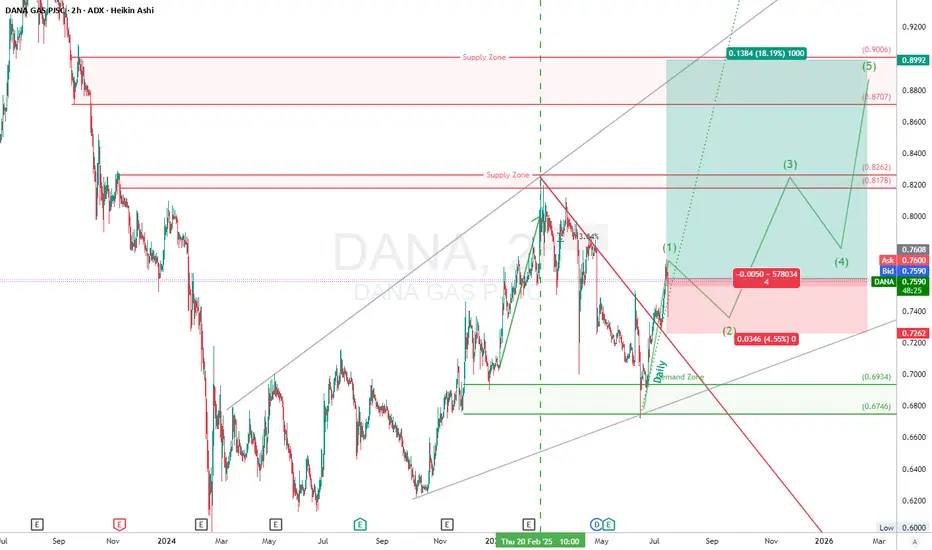
DANA GAS (DANA) ADX Long Setup“DANA just nuked that downtrend line and tagged the demand zone with precision. Now we got that impulsive (1) and the pullback’s setting up like a textbook long. Eyes on the reload zone, ‘cause bulls could lift this to 0.90 in a 3-wave rocket.”
📈 Trade Setup – 2H (Timeframe)
Wave & Structure
Wave (1) of a new bullish 5-wave sequence has just completed.
Current move is in Wave (2) pullback, likely aiming to retest the broken daily trendline or demand block (around 0.72–0.74).
Wave (3) projection targets:
TP1: 0.8178–0.8262
TP2: 0.8707–0.8992 (major supply zone)
Trendline Break:
The red downtrend line from previous high (Feb 2025) is broken with conviction.
Break + retest in play — classic confirmation pattern.
High Timeframe trendlines (gray) continues acting as macro support.
🎯 2H Trade Plan (Long)
📍 Entry Zone : 0.7600
📉 Stop Loss: 0.7246 (below last low)
🎯 Target 1: 0.8262
🎯 Target 2: 0.8707
🎯 Final Target: 0.8992
⚖️ Risk/Reward:
To TP1: ~2.5R
To TP2: ~4.2R
To TP3: ~5.0R+
⚠️ Disclaimer
This setup is for educational purposes only. Not financial advice. Always trade with proper risk management and a verified strategy.
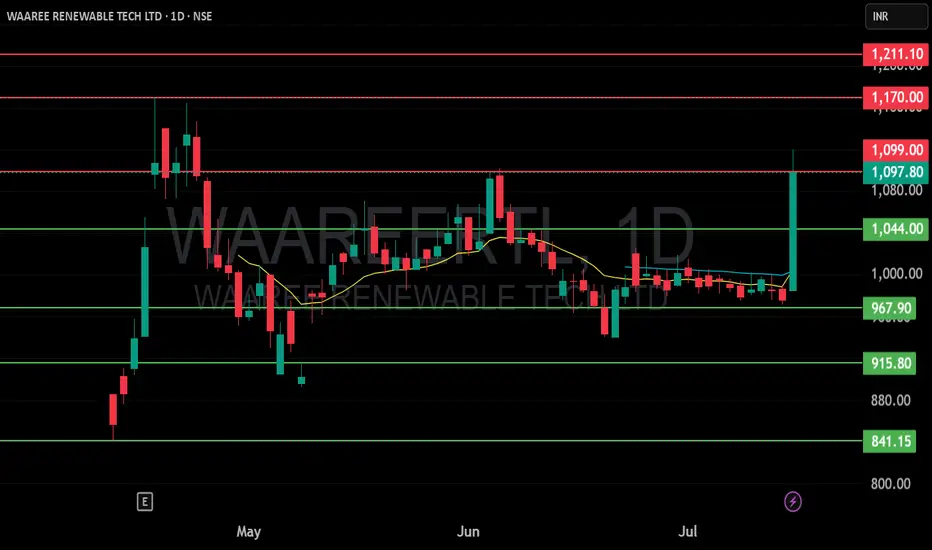
WAAREE RENEWABLE TECH LTD S/RSupport and Resistance Levels:
Support Levels: These are price points (green line/shade) where a downward trend may be halted due to a concentration of buying interest. Imagine them as a safety net where buyers step in, preventing further decline.
Resistance Levels: Conversely, resistance levels (red line/shade) are where upward trends might stall due to increased selling interest. They act like a ceiling where sellers come in to push prices down.
Breakouts:
Bullish Breakout: When the price moves above resistance, it often indicates strong buying interest and the potential for a continued uptrend. Traders may view this as a signal to buy or hold.
Bearish Breakout: When the price falls below support, it can signal strong selling interest and the potential for a continued downtrend. Traders might see this as a cue to sell or avoid buying.
MA Ribbon (EMA 20, EMA 50, EMA 100, EMA 200) :
Above EMA: If the stock price is above the EMA, it suggests a potential uptrend or bullish momentum.
Below EMA: If the stock price is below the EMA, it indicates a potential downtrend or bearish momentum.
Trendline: A trendline is a straight line drawn on a chart to represent the general direction of a data point set.
Uptrend Line: Drawn by connecting the lows in an upward trend. Indicates that the price is moving higher over time. Acts as a support level, where prices tend to bounce upward.
Downtrend Line: Drawn by connecting the highs in a downward trend. Indicates that the price is moving lower over time. It acts as a resistance level, where prices tend to drop.
Disclaimer:
I am not a SEBI registered. The information provided here is for learning purposes only and should not be interpreted as financial advice. Consider the broader market context and consult with a qualified financial advisor before making investment decisions.
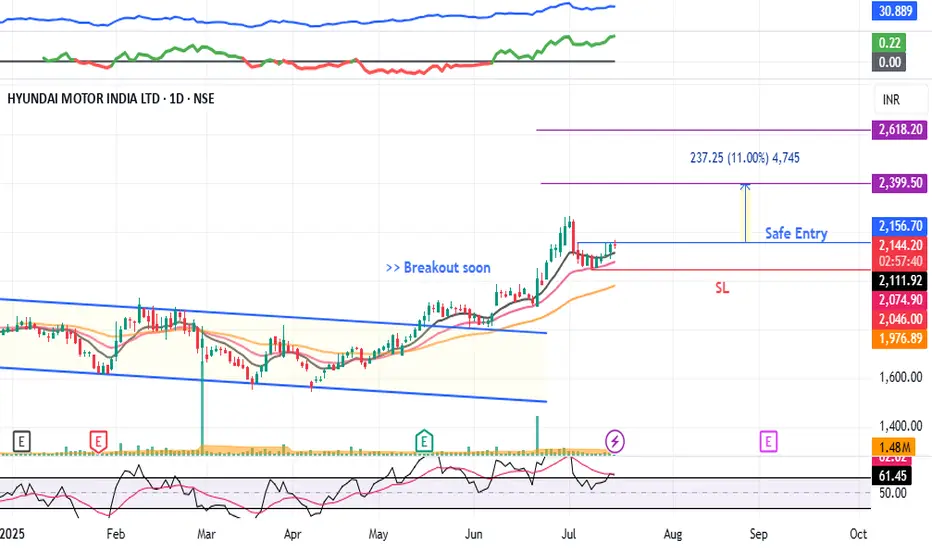
HYUNDAI - Swing Trade#HYUNDAI #swingtrade #trendingstock #momentumtrading #breakoutstock
HYUNDAI : Swing Trade
>> Breakout soon
>> Trending Stock
>> Volume Dried up
>> Good strength
>> Low Risk Trade ( RR - 1:2 or 1:3 )
Swing Traders can lock profit at 10% and keep trailing
Pls Boost, like and comment if u like the analysis
Disc: Charts shared are for Learning purpose, Take position only after consulting ur Financial Advisor or a SEBI Registered Advisor
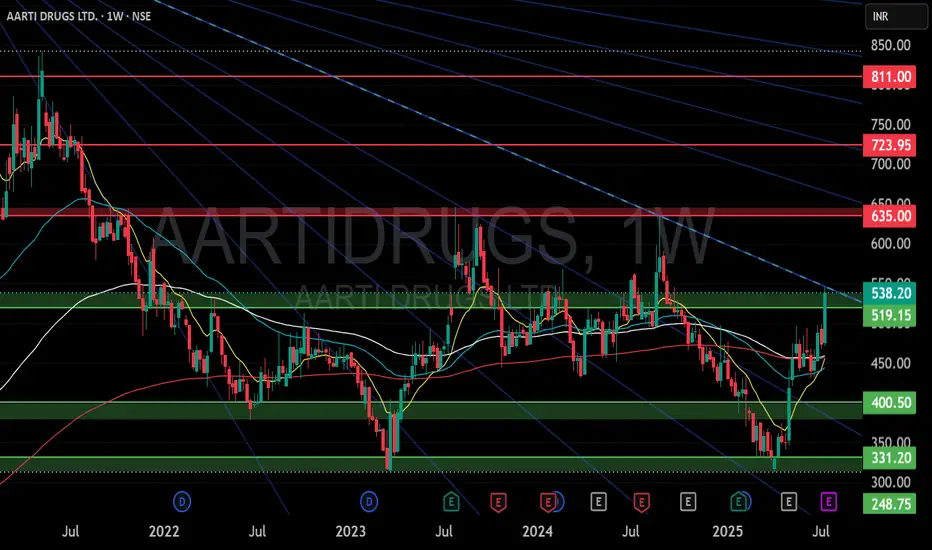
AARTI DRUGS LTD S/R Support and Resistance Levels:
Support Levels: These are price points (green line/shade) where a downward trend may be halted due to a concentration of buying interest. Imagine them as a safety net where buyers step in, preventing further decline.
Resistance Levels: Conversely, resistance levels (red line/shade) are where upward trends might stall due to increased selling interest. They act like a ceiling where sellers come in to push prices down.
Breakouts:
Bullish Breakout: When the price moves above resistance, it often indicates strong buying interest and the potential for a continued uptrend. Traders may view this as a signal to buy or hold.
Bearish Breakout: When the price falls below support, it can signal strong selling interest and the potential for a continued downtrend. Traders might see this as a cue to sell or avoid buying.
MA Ribbon (EMA 20, EMA 50, EMA 100, EMA 200) :
Above EMA: If the stock price is above the EMA, it suggests a potential uptrend or bullish momentum.
Below EMA: If the stock price is below the EMA, it indicates a potential downtrend or bearish momentum.
Trendline: A trendline is a straight line drawn on a chart to represent the general direction of a data point set.
Uptrend Line: Drawn by connecting the lows in an upward trend. Indicates that the price is moving higher over time. Acts as a support level, where prices tend to bounce upward.
Downtrend Line: Drawn by connecting the highs in a downward trend. Indicates that the price is moving lower over time. It acts as a resistance level, where prices tend to drop.
Disclaimer:
I am not a SEBI registered. The information provided here is for learning purposes only and should not be interpreted as financial advice. Consider the broader market context and consult with a qualified financial advisor before making investment decisions.
ESG ADX Long Setup🏢 Company Overview
Emirates Stallions Group is a major diversified holding company based in Abu Dhabi, UAE, and is part of the International Holding Company (IHC)
🔧 Core Business
Manpower & Accommodation Solutions:
Provides workforce management and labor supply (both skilled and unskilled)
Develops and manages staff/workers accommodation via subsidiaries like Sawaeed Holding, Century Village, and Tri Star
Real Estate Development & Construction:
Offers a full suite of services: feasibility, design, construction, project management, and post-construction operations
Includes specialized hospitality and engineering projects (e.g., ESG Hospitality, Royal Architect, Abu Dhabi Land General Contracting)
Retail, Interior Decoration & Manufacturing:
Owns and operates furniture and interior retail brands such as Decovision, Vision Furniture, AFKAR (OC Home, 2XL Home)
Handles manufacturing of wooden doors, cabinets, paneling, and decorative wooden elements
Landscaping & Agriculture:
Through Gulf Dunes Landscaping and ESG Agro, delivers landscape design, installation, and agriculture solutions with an eco-friendly focus
Investments & Consultancy:
Provides technical consulting, brokerage services, and holds investments across various sectors and global markets
📊 Recent Financial Highlights (2024 Data)
According to Reuters/LSEG, ESG reported:
📈 Revenue: AED 1.27 B
💰 Gross Profit: AED 436 M
🧾 Net Income: AED 225 M
🌍 Business spans over 20+ countries, with more than 35 subsidiaries across 4–6 industries
The Wall Street Journal
The company is highly diversified across workforce services, real estate, retail, agronomy, and investments
Regional to global reach, especially strong within the Gulf Cooperation Council (GCC) and expanding internationally
Integrated model enables turnkey solutions spanning design, construction, workforce logistics, and operational management.
_______________________________________________________________________________
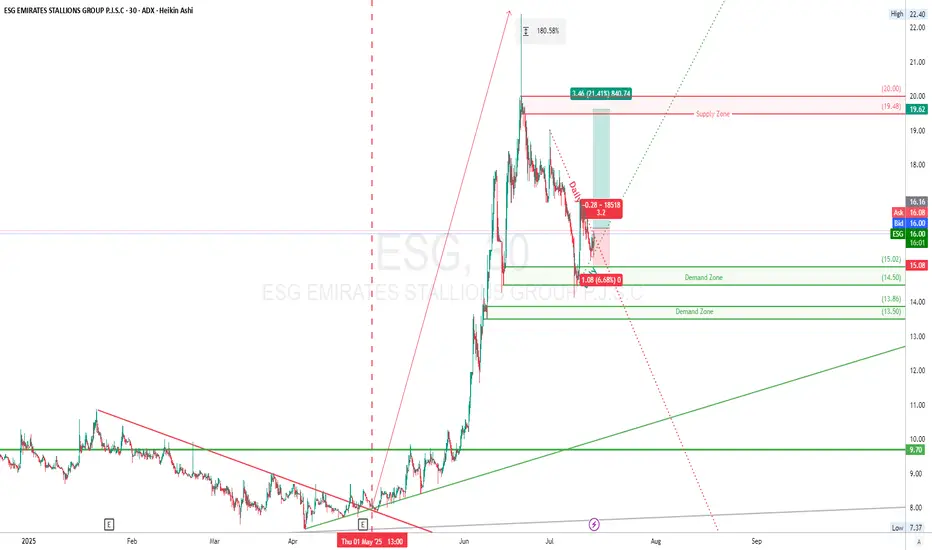
📉 Daily Trend Line Break – Technical Breakdown
🟢 The Setup
A descending trend line from the all-time high near 22.40 acted as a clear resistance cap through late June and early July. Which came after the May 2025 180% rally
This line connected multiple lower highs, creating a consistent bearish structure (Correction).
💥 Price Action & Breakout
Price action has now broken above that descending trend line, especially visible on the 30-min chart around the 15.70–16.00 zone.
This break came right after:
A demand zone bounce near 14.5
Completion of an Elliott Wave (4) correction
Breaking a daily trend line after a wave (4) correction is a classic confirmation signal that Wave (5) is kicking off.
If ESG holds above 15.70–16.00, we may see continuation toward:
🧾 Trade Idea (Long Setup)
📍 Entry: ~16.16
📉 Stop Loss: 15.08 (below local structure low)
🎯 Take Profit: 19.62 (prior supply zone retest)
🎯 Extended TP2: 22.3 (Last High)
⚖️ Risk/Reward Ratio: ~3.2R+
“ESG just tapped the demand zone like a sniper. That ABC correction looks done, and we got that hidden bullish divergence whispering ‘pump time’. If it breaks that 16.50 diagonal, bulls might rip through to 20 like it’s butter.”
⚠️ Disclaimer
This is not financial advice. Always do your own research and manage risk according to your strategy. Trading involves significant risk of loss.
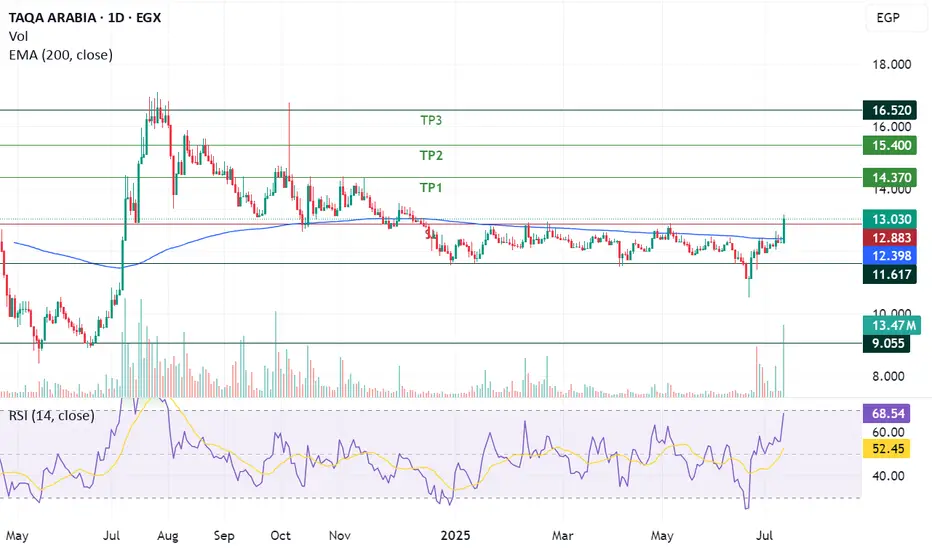
Breakthrough sideways price channelTAQA has been moving in sideways price channel ranged from 11.60 to 12.90 in the past 7 month, and successfully breakthrough the significant upper resistance line of the sideways channel supported with trading volume higher than the past 10 month potentially targeting the below:
- TP1: 14.3
- TP2: 15.4
- TP3: 16.5
- SL: Below 12.9 "Confirmation required"
$BABA 160+ before year end looks realistic thanks $NVDA- NASDAQ:NVDA export ban lifted for China will be beneficial for NASDAQ:NVDA for sure but main advantages would be for NYSE:BABA as they can get the shovels from the shop as well so that they can compete in Gold Rush and compete with NASDAQ:GOOGL , NASDAQ:META and other private companies like Open AI and Anthropic.
- There are good universities in China and NYSE:BABA is regional big tech in China which gets great talent. I'm confident that NYSE:BABA would be able to compete with NASDAQ:META & NASDAQ:GOOGL in building LLMs even better with this export ban lift.
- Long NYSE:BABA and short/avoid NASDAQ:META ( overvalued )

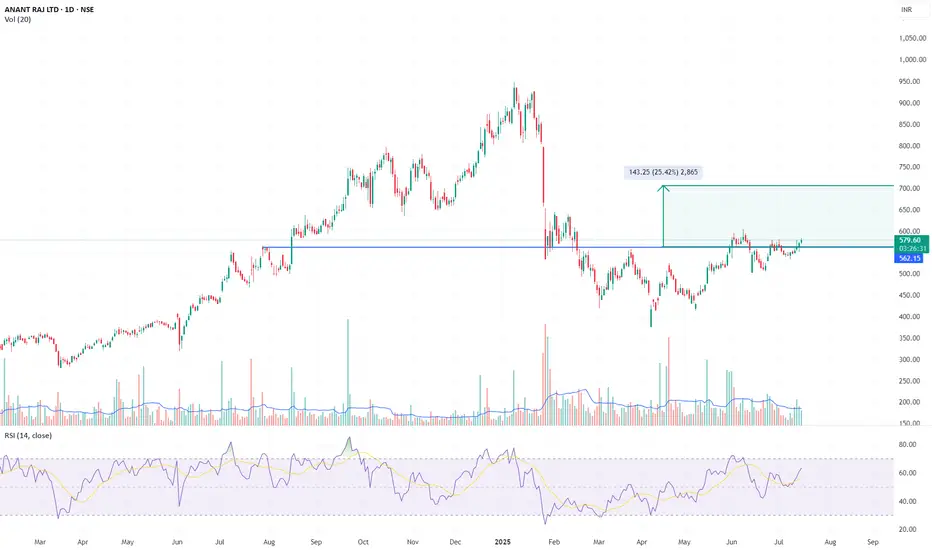
ANANT RAJ – Breakout From Rounded Base | ₹700+ Swing PossibleANANT RAJ has triggered a fresh breakout above the ₹580 zone – reclaiming its prior breakdown level from Feb 2025. This comes after a rounded base formation lasting 4+ months.
Breakout 1: June 2, on volume, cleared the March–May base
Breakout 2: Now taking out neckline of broader inverse H&S
Volume: Expanding again
RSI: Bullish, no divergence
Structure: Clean higher highs and lows post-Feb low
Measured Move Target: ₹700
Stop-Loss: ₹558
Fundamentals Support Swing Bias:
Low debt, strong solvency
Net profit margin ~21%
FY26 profit growth estimate ~32%
Valuation expensive (P/E ~46), but growth supports it short term
Not a long-term compounding candidate yet – monitor execution
Positioning:
Swing trade, not an investment. Ride momentum. Trail stops. No averaging up. Exit if ₹558 breaks on closing basis.
Disclaimer:
This analysis is for educational purposes only. It is not investment advice. Do your own due diligence. Trade at your own risk.
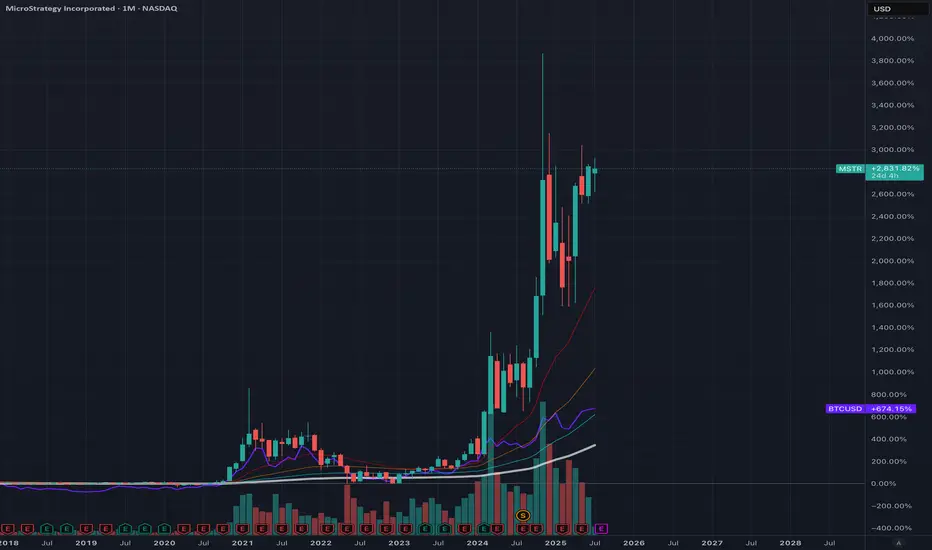
MicroStrategy Bitcoin FOMOIs it time to sell? In percentage terms, MicroStrategy has significantly outperformed its underlying asset, Bitcoin. It's concerning to watch Michael Saylor's FOMO (fear of missing out) into Bitcoin over the past year, as this could ultimately do more harm than good for Bitcoin. MicroStrategy's stock seems massively overvalued compared to its Bitcoin holdings. As the saying goes, "when the tide goes out, we see who is swimming naked."
Over the same period Bitcoin has gained 674%, while MicroStrategy has gained 2831%, making the situation quite clear. When comparing past bull runs, the percentage gains between Bitcoin and MicroStrategy have typically matched more closely, with both assets trending up together. So, what's different this time? Media exposure and FOMO.
Proceed with caution; this is starting to look like a bubble. Is it time to short?
LOTCHEM PROBABLY IN WAVE ' X ' OR ' Y ' OF A CORRECTIONAs per our preferred wave count LOTCHEM is in wave Y which should take prices further down toward the 13 level and if bearish trend stays strong then even 9.50 is on the cards, however prices need to break below 15.53 level first.
Alternately prices can still be in X wave and will take prices further up towards 25.40 - 27.40 range and if the bullish trend stays strong 31 level is also at hand, however prices will have to break above 20.20 level first.
As the overall momentum of the PSX is bearish and our preferred wave count is bearish, We will activate short sell trade once price close below the red trendline on the daily chart.
Incase prices never close below the red trendline and starts rising, We will enter long position at 20.20 targeting 25.40 range. I will share stop loss for the trade setup once our trade gets actived
Let see how this plays, Good Luck!
Disclaimer: The information presented in this wave analysis is intended solely for educational and informational purposes. It does not constitute financial or trading advice, nor should it be interpreted as a recommendation to buy or sell any securities.

Engineers India Ltd (EIL): Rounding Bottom Breakout in Sight!🚀 Engineers India Ltd (EIL): Rounding Bottom Breakout in Sight! 🚀
📉 CMP: ₹212
🔒 Stop Loss: ₹189
🎯 Target: ₹260
Why EIL Looks Promising?
✅ Rounding Bottom Formation: Strong base pattern on daily chart signals long-term reversal potential
✅ Reversal Signs: Bullish structure with increasing volumes confirms buyer interest
✅ Sector Tailwind: Capital goods & infra theme gaining strength—EIL may benefit
💡 Strategy:
📈 Staggered Entry: Ideal for long-term investors—accumulate in phases near support
🔒 Strict SL: Keep stop loss at ₹189 to manage downside risk
📍 Outlook: As EIL moves above key resistance levels with strength, it sets the stage for a breakout toward ₹260
📉 Disclaimer: Not SEBI-registered. Please conduct your own research or consult a financial advisor before investing.
#EIL #EngineersIndia #TechnicalBreakout #RoundingBottom #SwingTrading #StockMarket

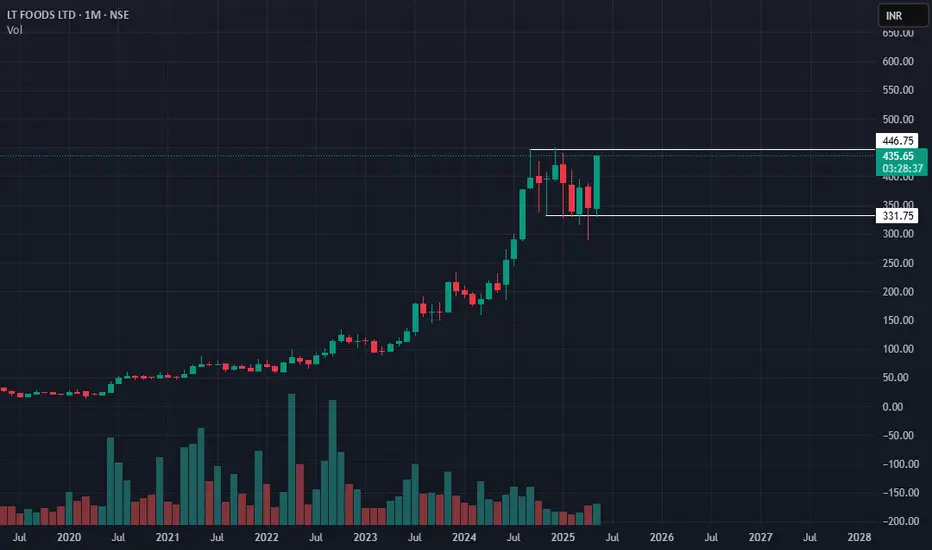
LT Foods: On the Verge of a Strong Breakout! 🚀 LT Foods: On the Verge of a Strong Breakout! 🚀
📉 CMP: ₹436
🔒 Stop Loss: ₹370
🎯 Target: ₹530
🔍 Why LT Foods Looks Promising:
✅ 7-Month Box Breakout Setup: A tight consolidation zone on the monthly chart is set for a potential breakout
✅ Volume Confirmation: Recent price action shows strength—buyers stepping in
✅ Add on Dips: Accumulate confidently till ₹390 if the price pulls back
💡 Strategy & Risk Management:
📈 Staggered Entry: Phase your positions for optimal risk-reward
🔒 Strict SL: Protect capital with a disciplined stop loss at ₹370
📍 Outlook: A decisive move above resistance may lead to a swift rally towards ₹530—LT Foods is a breakout candidate worth watching.
📉 Disclaimer: Not SEBI-registered. Please conduct your own research or consult a financial advisor before investing.
#LTFoods #TechnicalBreakout #BoxBreakout #SwingTrading #StockMarket #TechnicalAnalysis #InvestmentOpportunity
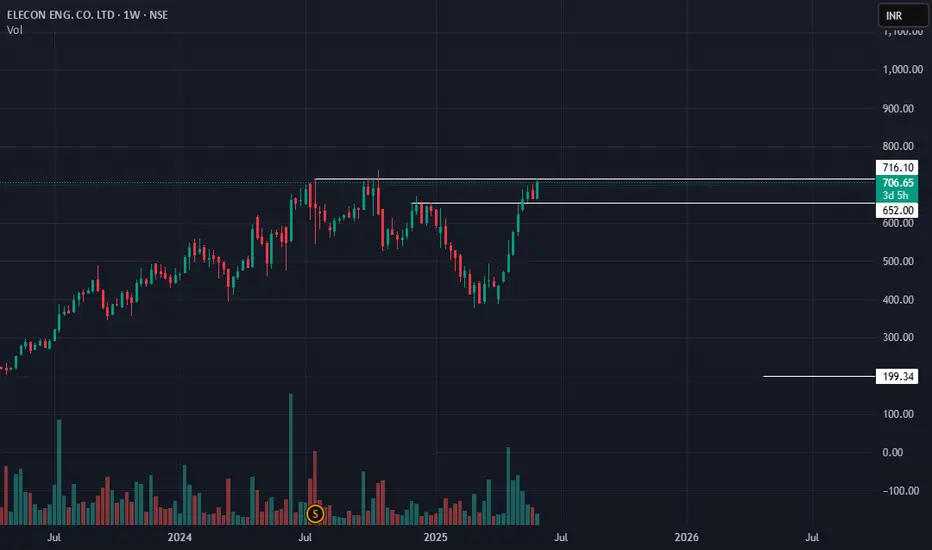
Elecon Engineering: Pre-Breakout Momentum Building!🚀 Elecon Engineering: Pre-Breakout Momentum Building! 🚀
📉 CMP: ₹716
🔒 Stop Loss: ₹652
🎯 Target: ₹952
🔍 Why It Looks Promising?
✅ Rounding Bottom Breakout: Strong breakout above ₹652 with a successful retest.
✅ Fresh Upside Move: Momentum picking up—on track to challenge all-time highs.
💡 Strategy & Risk Management
📈 Staggered Entry: Accumulate gradually near support to manage risk effectively.
🔒 Strict SL: Maintain a disciplined stop loss at ₹652 to protect capital.
📍 Outlook: Elecon is well-positioned for a fresh rally with strong technical structure and volume support.
📉 Disclaimer: Not SEBI-registered. Please conduct your own research or consult a financial advisor before investing.
#EleconEngineering #BreakoutStocks #TechnicalAnalysis #RoundingBottom #SwingTrading #StockMarketIndia #InvestSmart
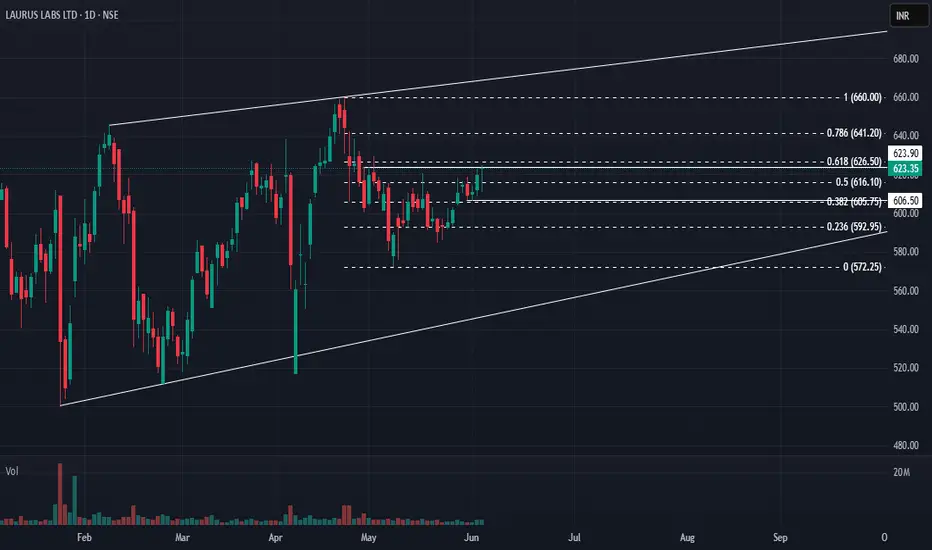
Laurus Labs: Short-Term Momentum Setup! 🚀 Laurus Labs: Short-Term Momentum Setup! 🚀
📉 CMP: ₹624
🔒 Stop Loss: ₹604
🎯 Target: ₹660
🔍 Why Laurus Labs?
✅ Key Fibonacci Confluence: Price hovering around the crucial 62% retracement level.
✅ Derivatives Signal: Highest Call OI at ₹620—now acting as support.
✅ Momentum Watch: The stock is positioned to gain traction in the short term.
💡 Quick Strategy
📈 Short-Term Trade: Ideal for momentum traders looking for a clean risk-reward setup.
🔒 Strict SL: Maintain a disciplined stop loss at ₹604 to safeguard capital.
📉 Disclaimer: Not SEBI-registered. Please do your own research or consult a financial advisor before investing.
#LaurusLabs #MomentumStocks #ShortTermTrade #TechnicalAnalysis #SwingTrading #StockMarketIndia
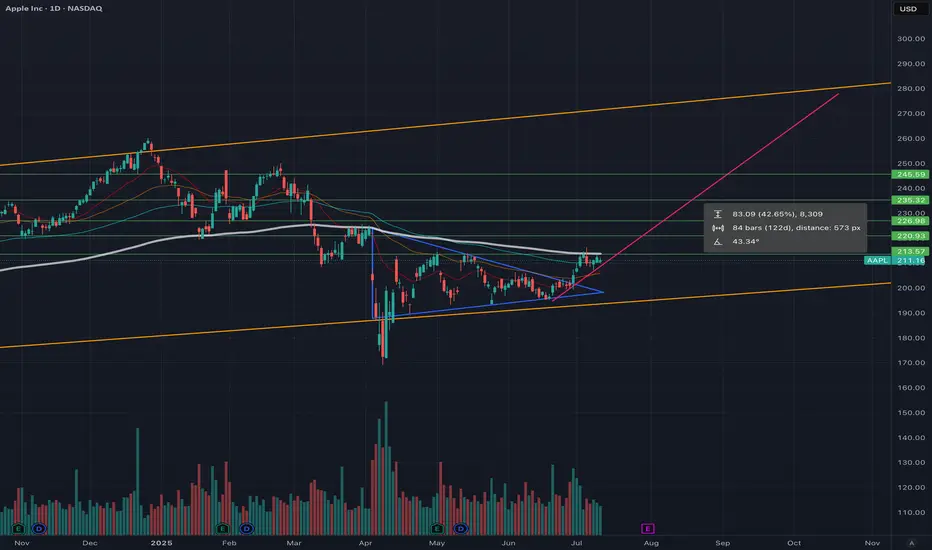
Time to buy? Too much negative press. Buy in Fear- Updated 13/7Apple has faced prolonged downward pressure from bearish investors. Despite its best efforts and some dips, the stock has steadily maintained a baseline price of 200 USD. The flag pattern required some adjustments along its path to break out, primarily due to geopolitical issues and economic variables. Ultimately, Apple broke out to the upside in the week of June 30th, as predicted in my earlier posts. This breakout resulted from end-of-Q2/H1 sell pressure, delivering a 7.56% gain or 15 USD. This is a very bullish sign for Apple, and with the tailwinds forming for September product releases, we can expect further gains as traders return and volume increases.
If Apple follows its historical profit trajectory (see pink line), we could see a new all-time high (ATH) in the region of 270 USD in September. The green resistance and support levels are highlighted, and I may use these to adjust my position, considering whether to short or go long once confirmation is established on the daily timeframe.
Apple has significantly underperformed compared to the other Magnificent 7 stocks, but I don’t believe it’s a company you should bet against in the current climate. With a slow rollout of AI and recent statements from Apple, they may not always be first to market, but they generally execute well. The remarks regarding Sony, Samsung, and Netflix by Apple were very revealing and demonstrate a solid long-term strategy. However, there may be some bumps along the way as they work toward their goals, potentially involving acquisitions.
The fear spread in the media is similar to the FUD (fear, uncertainty, doubt) often associated with Bitcoin, and this is typically a good time to buy. Remember the saying: if retail investors miss the boat, it’s gone, but if institutions miss it, they often bring the boat back.
While this is not financial advice, based on the green weekly candle, it's hard not to pay attention, and Apple may now have a very positive year ahead! Especially with the weakening dollar and reports stating that this will benefit them greatly.
Apple has continued to trend along its predicted trajectory, and with the exception of economic headwinds driving the price down, this trend is expected to continue. Strong support has been observed at 210 USD, with further support at $208.50, providing solid technical support for potential upside while reducing the risk of a downturn below $208. However, a short correction could occur if overall market confidence is shaken due to new policies. Nevertheless, Apple has demonstrated resilience to new tariffs, and its underperformance compared to other tech giants indicates plenty of upside potential. The target price remains set at over $260.
My large long position is still intact, and my target price will depend on how we manage supports and resistances. I am looking to take profits at over 260 USD.
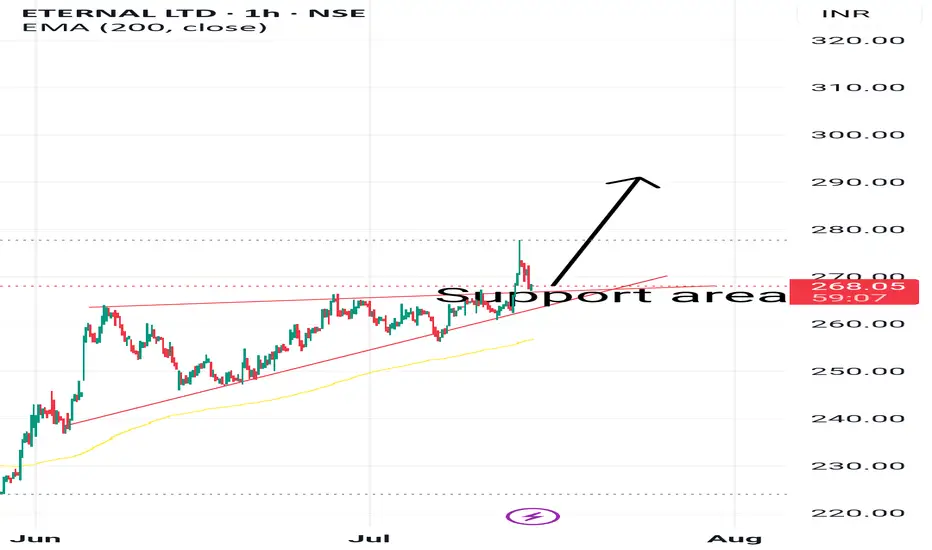
ETERNALHi,
Breakout of acceding triangle. And now price at support area.
Latest Swing low is stop loss area
This idea is for Educational purpose and paper trading only. Please consult your financial advisor before investing or making any position. Facts or Data given above may be slightly incorrect. We are not SEBI registered