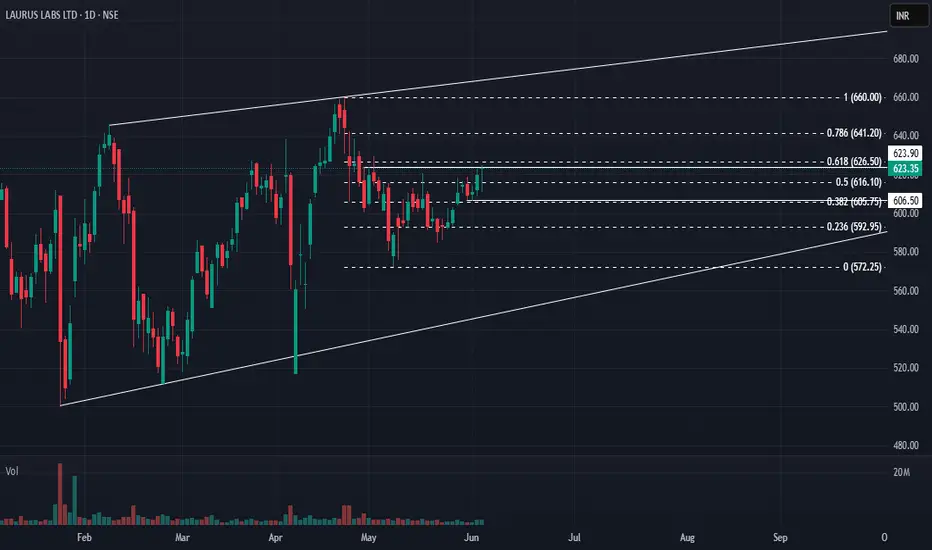
Laurus Labs: Short-Term Momentum Setup! 🚀 Laurus Labs: Short-Term Momentum Setup! 🚀
📉 CMP: ₹624
🔒 Stop Loss: ₹604
🎯 Target: ₹660
🔍 Why Laurus Labs?
✅ Key Fibonacci Confluence: Price hovering around the crucial 62% retracement level.
✅ Derivatives Signal: Highest Call OI at ₹620—now acting as support.
✅ Momentum Watch: The stock is positioned to gain traction in the short term.
💡 Quick Strategy
📈 Short-Term Trade: Ideal for momentum traders looking for a clean risk-reward setup.
🔒 Strict SL: Maintain a disciplined stop loss at ₹604 to safeguard capital.
📉 Disclaimer: Not SEBI-registered. Please do your own research or consult a financial advisor before investing.
#LaurusLabs #MomentumStocks #ShortTermTrade #TechnicalAnalysis #SwingTrading #StockMarketIndia
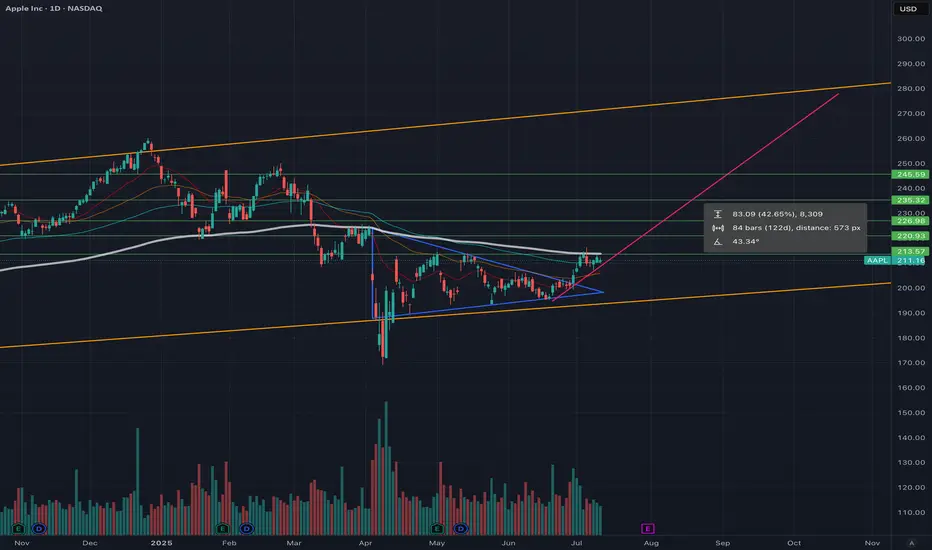
Time to buy? Too much negative press. Buy in Fear- Updated 13/7Apple has faced prolonged downward pressure from bearish investors. Despite its best efforts and some dips, the stock has steadily maintained a baseline price of 200 USD. The flag pattern required some adjustments along its path to break out, primarily due to geopolitical issues and economic variables. Ultimately, Apple broke out to the upside in the week of June 30th, as predicted in my earlier posts. This breakout resulted from end-of-Q2/H1 sell pressure, delivering a 7.56% gain or 15 USD. This is a very bullish sign for Apple, and with the tailwinds forming for September product releases, we can expect further gains as traders return and volume increases.
If Apple follows its historical profit trajectory (see pink line), we could see a new all-time high (ATH) in the region of 270 USD in September. The green resistance and support levels are highlighted, and I may use these to adjust my position, considering whether to short or go long once confirmation is established on the daily timeframe.
Apple has significantly underperformed compared to the other Magnificent 7 stocks, but I don’t believe it’s a company you should bet against in the current climate. With a slow rollout of AI and recent statements from Apple, they may not always be first to market, but they generally execute well. The remarks regarding Sony, Samsung, and Netflix by Apple were very revealing and demonstrate a solid long-term strategy. However, there may be some bumps along the way as they work toward their goals, potentially involving acquisitions.
The fear spread in the media is similar to the FUD (fear, uncertainty, doubt) often associated with Bitcoin, and this is typically a good time to buy. Remember the saying: if retail investors miss the boat, it’s gone, but if institutions miss it, they often bring the boat back.
While this is not financial advice, based on the green weekly candle, it's hard not to pay attention, and Apple may now have a very positive year ahead! Especially with the weakening dollar and reports stating that this will benefit them greatly.
Apple has continued to trend along its predicted trajectory, and with the exception of economic headwinds driving the price down, this trend is expected to continue. Strong support has been observed at 210 USD, with further support at $208.50, providing solid technical support for potential upside while reducing the risk of a downturn below $208. However, a short correction could occur if overall market confidence is shaken due to new policies. Nevertheless, Apple has demonstrated resilience to new tariffs, and its underperformance compared to other tech giants indicates plenty of upside potential. The target price remains set at over $260.
My large long position is still intact, and my target price will depend on how we manage supports and resistances. I am looking to take profits at over 260 USD.
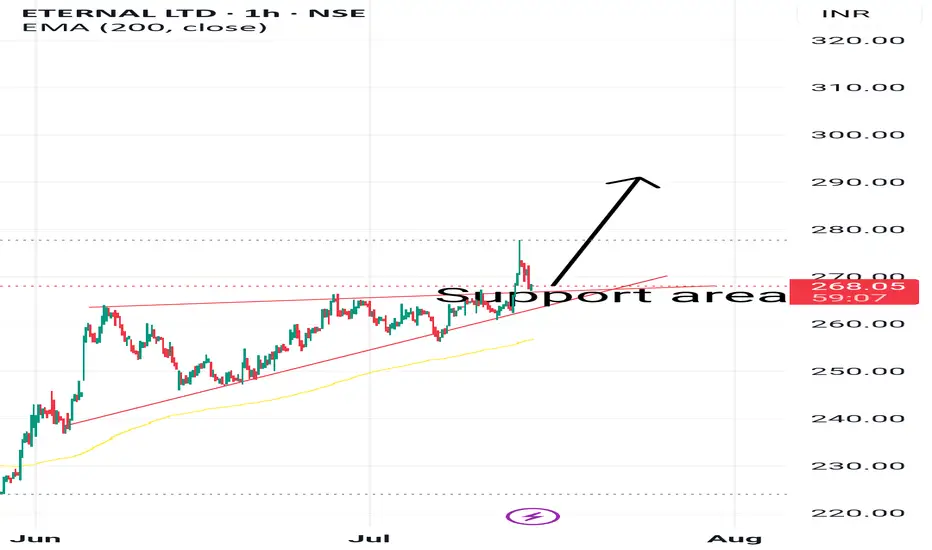
ETERNALHi,
Breakout of acceding triangle. And now price at support area.
Latest Swing low is stop loss area
This idea is for Educational purpose and paper trading only. Please consult your financial advisor before investing or making any position. Facts or Data given above may be slightly incorrect. We are not SEBI registered
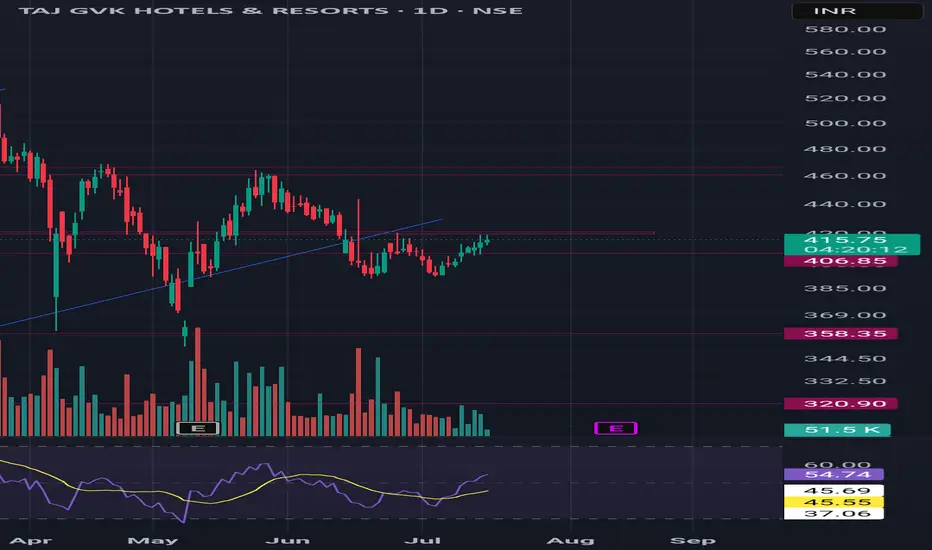
Tajgvk on it's way to breakout Taj gvk foaming strong chart with the strong support of rsi . Made w pattern in the chart if breakout made then we see 8-10% upside. We buy it only on closing basis.
Buy taj gvk above 422 colse
Target 436 460 466
Sl 390
Time 4-5 weeks after breakout
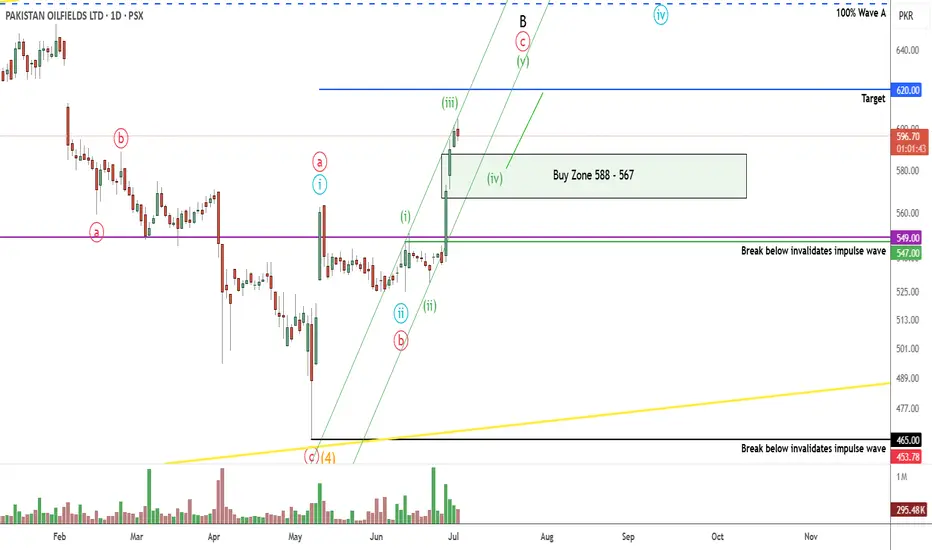
POL PROBABLY IN WAVE '' C '' OR " 3 " - LONGThis is in continuation of our ongoing tracking of POL wave structure.
POL is currently in C or 3 which will target the 620-623 or 680 level. Our preferred wave count is C and we will target the 620 level. If our wave count is correct then prices will decline to our buy zone of 588-567 range as wave 4.
Alternately prices will never go to our buy zone and will reach the 620 - 623 level directly making this trade setup as void.
We will buy in portions at 588 > 580 > 576 level
Trade setup:
Entry price: 588 - 567
Stop loss: 547
Targets: 620 - 623
Let see how this plays, Good Luck!
Disclaimer: The information presented in this wave analysis is intended solely for educational and informational purposes. It does not constitute financial or trading advice, nor should it be interpreted as a recommendation to buy or sell any securities.
Axis Bank Hi,
price Trade in zone . And currently it is available at support area.
So it's possible that price will move above The support area
This idea is for Educational purpose and paper trading only. Please consult your financial advisor before investing or making any position. Facts or Data given above may be slightly incorrect. We are not SEBI registered

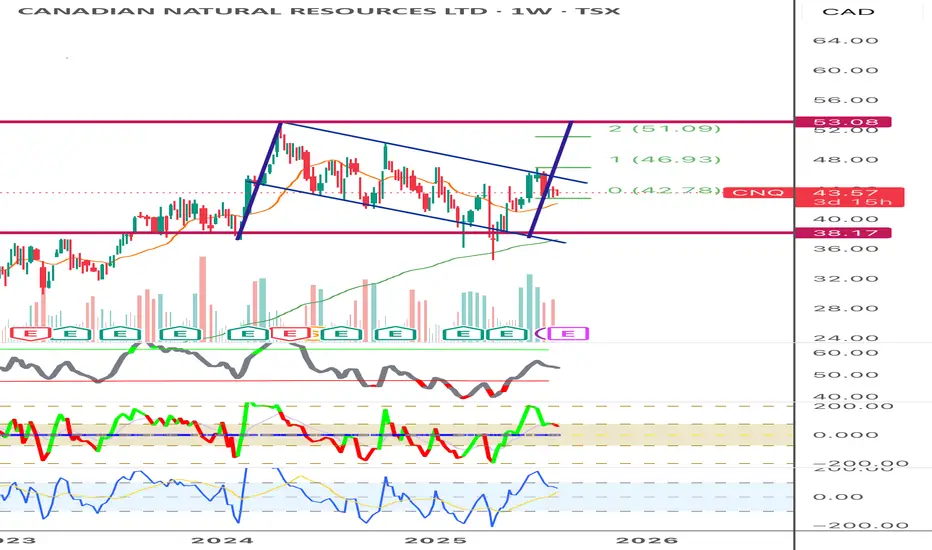
CNQ Earning Aug 7th, this to keep track of the stock for my own study to see if this works out. This is not for trading, just learning patterns
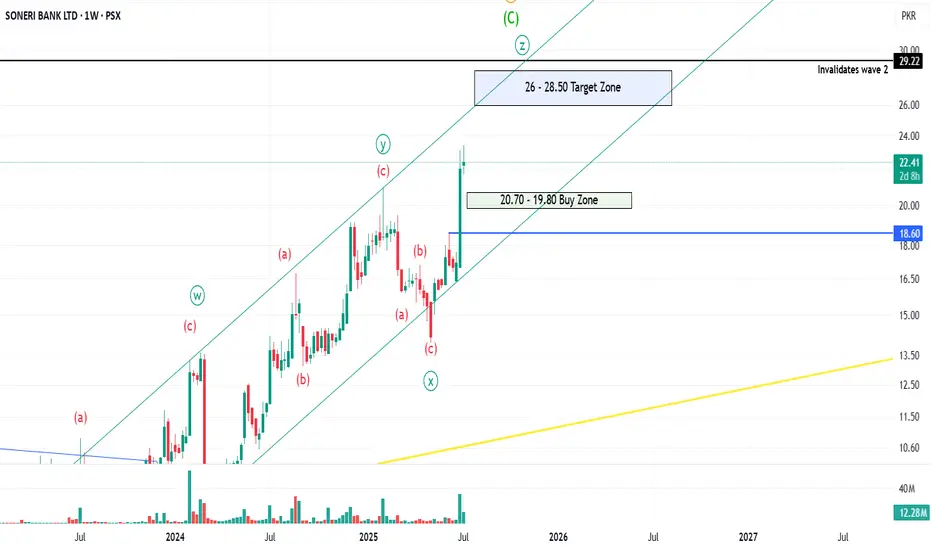
SNBL PROBABLY IN WAVE ' Z ' OF B or CThis is in continuation of our ongoing tracking of SNBL wave structure, prices have broken above the 22.50 level indicating one more leg upwards.
Currently the price is unfolding as wave Z which will target 26 - 28.50 zone, however the prices should decline towards the 20.70 - 19.80 level (buy zone) before rising again.
If the prices go below the 18.60 level, it will significantly weaken this wave count. we will only activate this trade if price reach our buy zone.
If the wave count is correct then this trade will provide us minimum 25.60% gross gain.
Trade Setup:
Entry level: 20.70 - 19.80
Stop loss: 18.59
Target: 26 - 28.50
Let see how this plays, Good Luck!
Disclaimer: The information presented in this wave analysis is intended solely for educational and informational purposes. It does not constitute financial or trading advice, nor should it be interpreted as a recommendation to buy or sell any securities.
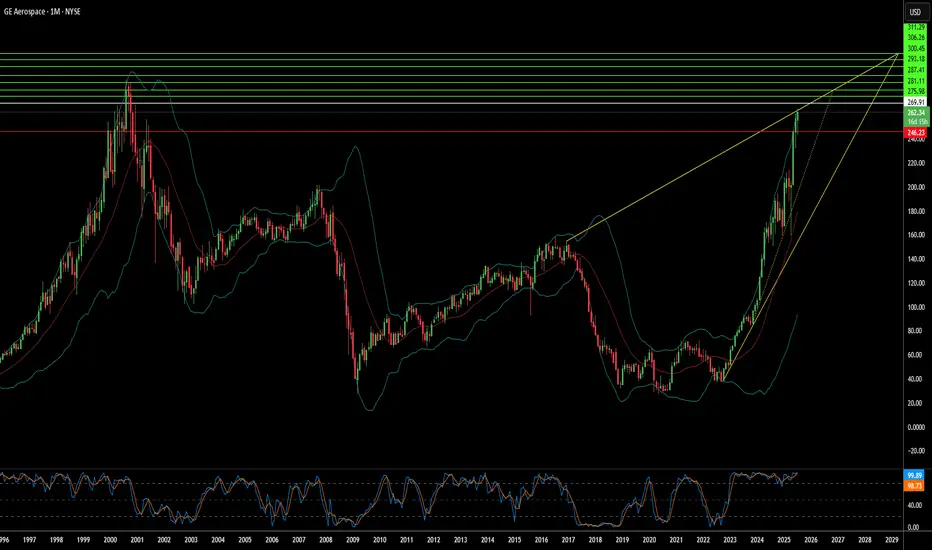
Soaring High: What Fuels GE Aerospace's Ascent?GE Aerospace's remarkable rise reflects a confluence of strategic maneuvers and favorable market dynamics. The company maintains a dominant position in the commercial and military aircraft engine markets, powering over 60% of the global narrowbody fleet through its CFM International joint venture and proprietary platforms. This market leadership, coupled with formidable barriers to entry and significant switching costs in the aircraft engine industry, secures a robust competitive advantage. Furthermore, a highly profitable aftermarket business, driven by long-term maintenance contracts and an expanding installed engine base, provides a resilient, recurring revenue stream. This lucrative segment buffers the company against cyclicality and ensures consistent earnings visibility.
Macroeconomic tailwinds also play a crucial role in GE Aerospace's sustained growth. Global air travel is steadily increasing, driving higher aircraft utilization rates. This directly translates to greater demand for new engines and, more importantly, consistent aftermarket servicing, which is a core profit driver for GE Aerospace. Management, under CEO Larry Culp, has also strategically navigated external challenges. They localized supply chains, secured alternate component sources, and optimized logistics costs. These actions proved critical in mitigating the impact of new tariff regimes and broader trade war tensions.
Geopolitical developments have significantly shaped GE Aerospace's trajectory. Notably, the U.S. government's decision to lift restrictions on exporting aircraft engines, including LEAP-1C and GE CF34 engines, to China's Commercial Aircraft Corporation of China (COMAC) reopened a vital market channel. This move, occurring amidst a complex U.S.-China trade environment, underscores the strategic importance of GE Aerospace's technology on the global stage. The company's robust financial performance further solidifies its position, with strong earnings beats, a healthy return on equity, and positive outlooks from a majority of Wall Street analysts. Institutional investors are actively increasing their stakes, signaling strong market confidence in GE Aerospace's continued growth potential.
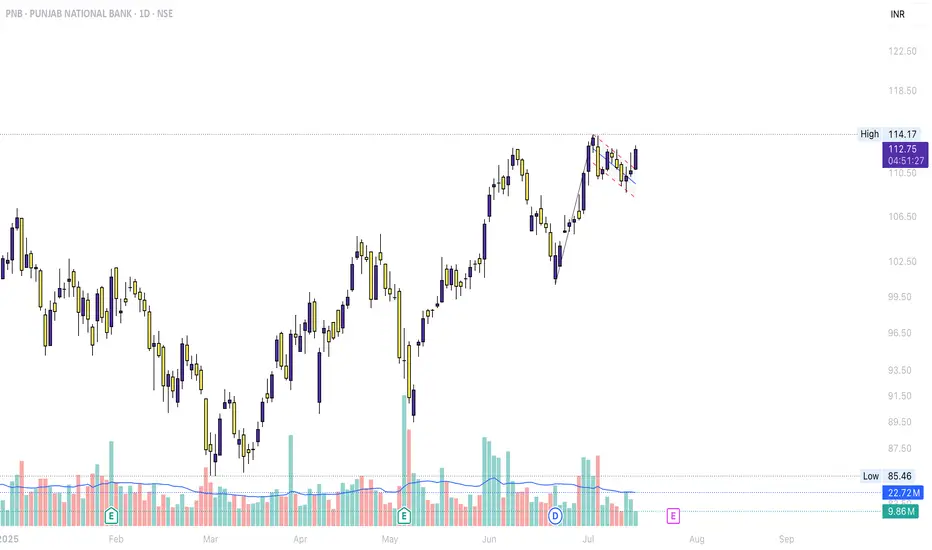
PNB <>BreakoutWith PSU Banks already on fire, PNB also showing breakout after forming Flag n Pole
Keeping it ion radar
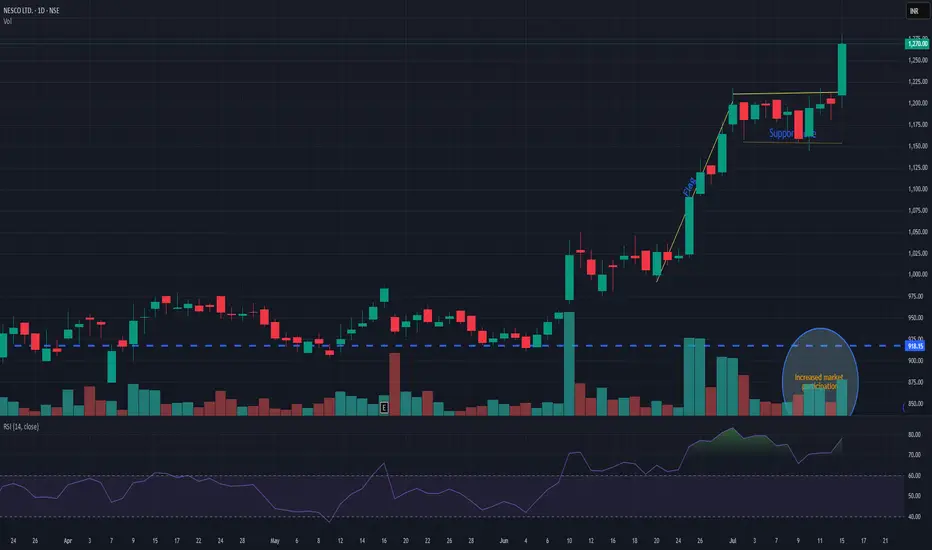
NESCONESCO giving flag pattern breakout with decent volume. Support is seen nr 1180. while pole initiation can be seen near 1010. Currently trading near 1270. It has a potential for new momentum. Keep it on radar.
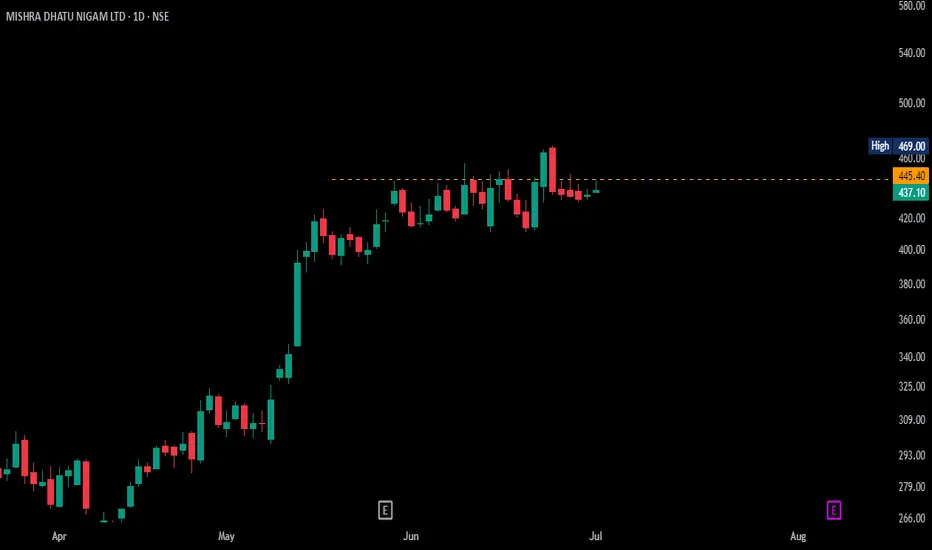
MIDHANI READY TO GOMisra Dhatu Nigam Limited, it has completed its setup and ready to go above this orange line.
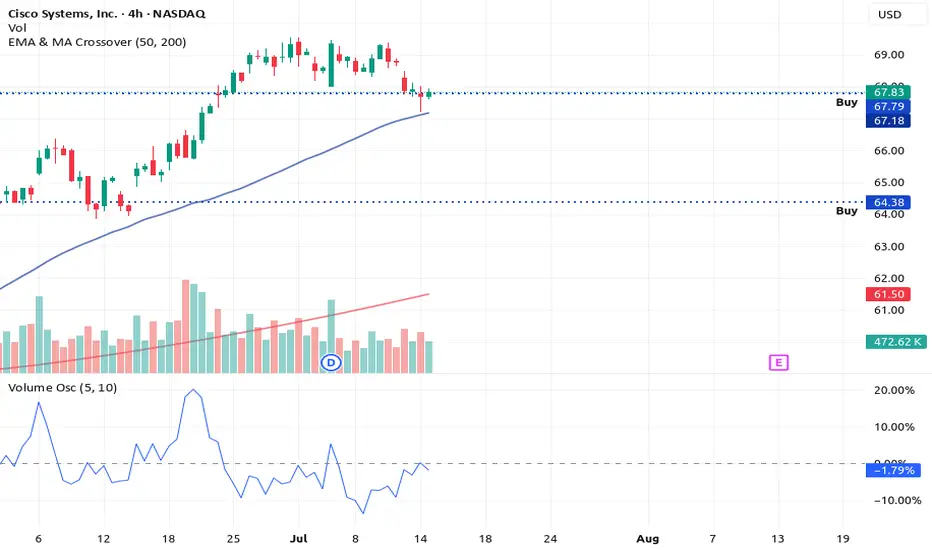
3 Reasons Why Cisco Stock Is Ready to Rocket (Bonus Strategy)3 Reasons Why Cisco Stock Is Ready to Rocket (Bonus Strategy Inside)
Cisco is flashing bullish signs from candlesticks to volume. Here's why a breakout could be imminent — with a bonus momentum strategy revealed.
---
Cisco Systems ( NASDAQ:CSCO ) is showing signs of a potential breakout — and savvy traders should take notice. Here’s why this tech giant is gathering bullish momentum across multiple signals:
1️⃣ Long Lower Shadow Candlestick Pattern
A long lower shadow on the recent candle suggests strong rejection of lower prices. This shows that buyers stepped in
aggressively after an intraday dip — a classic bullish reversal sign that often marks the end of a pullback phase.
2️⃣ Volume Oscillator Below Zero
The volume oscillator dipping below zero may seem bearish at
first, but in context, it shows a decline in selling pressure. When paired with other bullish indicators, this can signal the calm
before a strong move upward — especially if bulls take control on the next candle.
3️⃣ High Volume on the 4H Time Frame
Volume doesn’t lie — and it’s surging on the 4-hour chart. This spike in volume at key support levels adds strong confirmation
that institutional players may be stepping in. When volume rises while price action forms reversal candles, it increases the
probability of a sustained upward move.
---
🚀 Bonus Reason: The Rocket Booster Strategy is in Play
Cisco is also aligning with the Rocket Booster Strategy, which requires:
Price trading above the 50 EMA
Price trading above the 200 EMA
A recent gap up confirmed by Parabolic SAR
Strong supporting volume
This strategy acts like ignition for high-momentum trades — and Cisco looks ready for lift-off.
---
📌 Conclusion:
With technicals aligning and volume building, Cisco could be gearing up for a breakout. Traders should keep an eye on confirmation candles and volume spikes to validate the next leg upward.
---
📉 Disclaimer: Trading involves risk. Always conduct your own research and consult a financial advisor before investing.
---
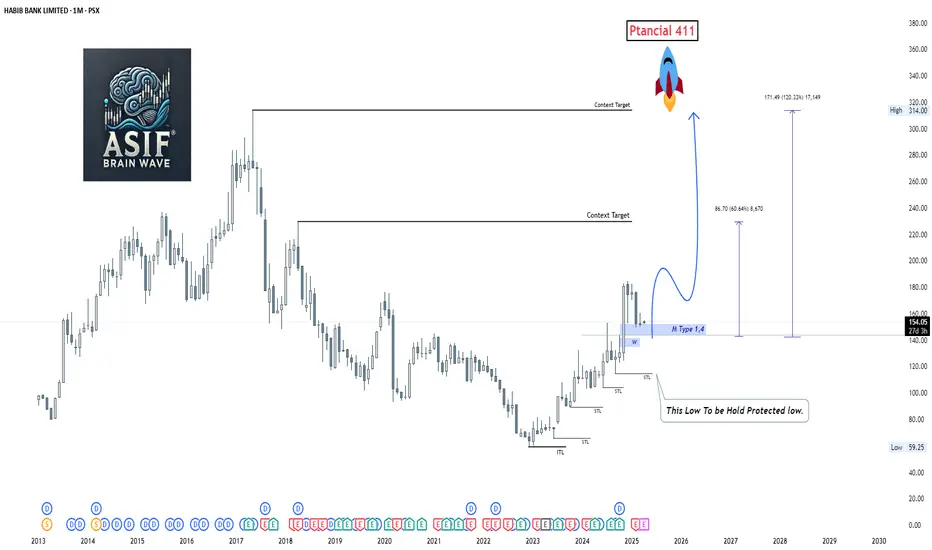
Buy Idea: Habib Bank Limited (HBL)📘 Buy Idea: Habib Bank Limited (HBL)
🔹 Timeframe: Monthly | Strategy: Structure + Type 1.4 + Context Targets
✅ Entry Zone:
Buy between 145 – 155 PKR (near the marked "M Type 1.4" level).
📉 Stop Loss (SL):
Below 92 PKR
("This low to be held as protected low" – the ITL zone).
🎯 Take-Profit Targets (TP):
Target Price (PKR) Gain % Description
TP1 240 ~60% First context target
TP2 314 ~120% Previous major high
TP3 411 ~165% Final potential rocket move 🚀
📌 Context & Narrative:
Price broke key structure levels and is forming a bullish base.
Multiple STL levels swept – shows smart money accumulation.
"M Type 1.4" indicates institutional interest.
Targets are based on historical price action and FVG-based projection.
💡 Position Strategy:
Buy 50% at current price (150–155)
Add 25% on a pullback to 140
Add 25% if price dips toward 130
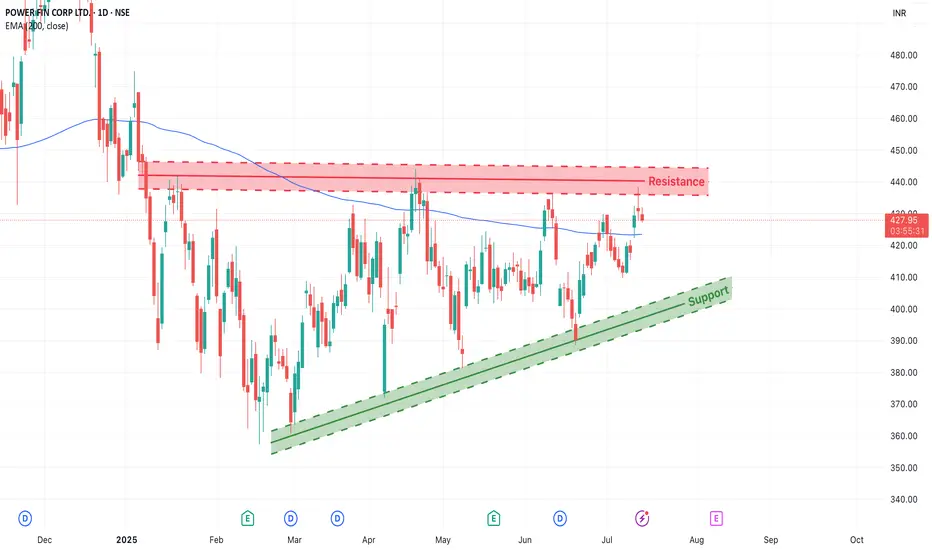
PFC– At Resistance with Ascending Triangle PatternPower Finance Corporation (NSE: PFC) is forming a technically clean structure — trading within a rising trend channel and now testing a critical resistance zone around ₹430–₹440.
This is a make-or-break level, and the market could tip in either direction depending on how price reacts this week.
1. Chart Structure Overview
Support Zone: Defined by a rising green trendline connecting higher lows since March 2025.
Resistance Zone: Red band between ₹430–₹440, where price has previously reversed multiple times.
200 EMA (Blue Line): Currently hovering around ₹423, adding confluence as a dynamic support/resistance level.
This convergence makes the current price zone crucial for directional confirmation.
2. Two Trade Scenarios
Scenario 1: Bullish Breakout (Trend Continuation)
If the price breaks above ₹440 with strong bullish candles, traders can look for:
✅ Entry after a confirmed breakout + re-test of the ₹430–₹435 zone
🎯 Target Zones: ₹455, ₹470+
🛡️ Stop Loss: Below the swing low of the re-test (₹425 or as per price structure)
🔁 Risk/Reward: 1:2 or better
Scenario 2: Resistance Rejection (Short-Term Pullback)
If the price fails to break above ₹430–₹440 and shows reversal patterns:
✅ Entry on confirmation (e.g., bearish engulfing, rejection wick)
🎯 Target Zones: ₹410 (near rising trendline), possible extension to ₹400
🛡️ Stop Loss: Just above the resistance (~₹442–₹445)
🔁 Risk/Reward: 1:2 to 1:3 depending on entry
Thread>
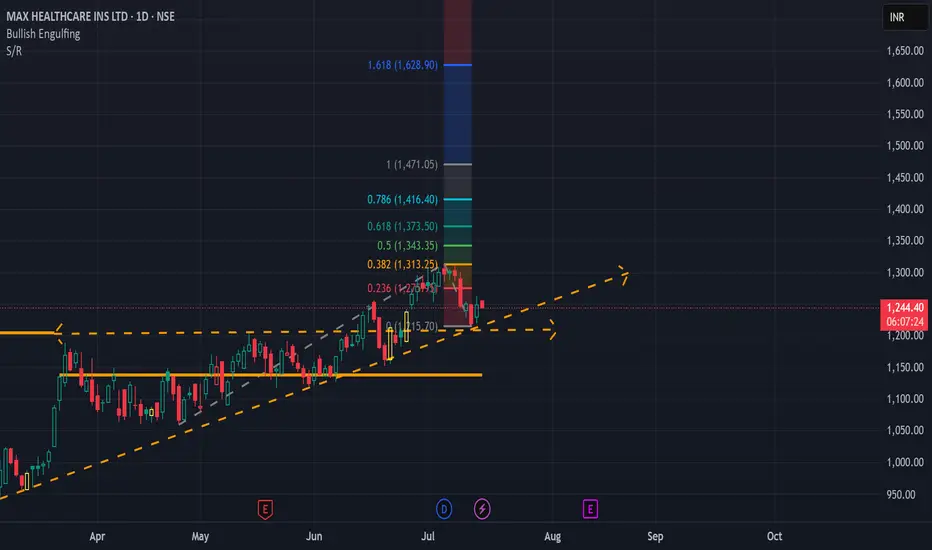
MAXHEALTH in BreakoutNSE:MAXHEALTH in breakout. You can Buy at 1265 and 1st Target would be 1470 and with trailing Stoploss you can achieve Second Target which would be 1600.
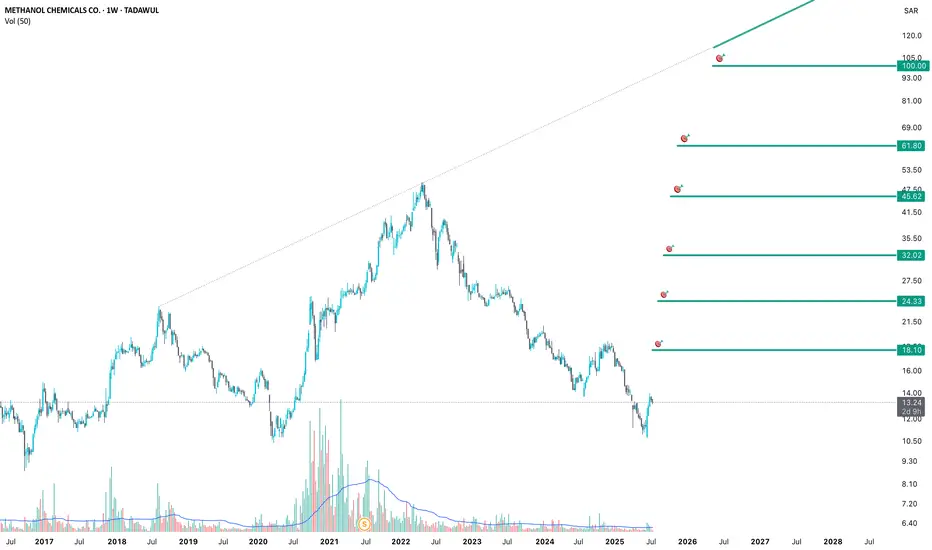
Bullish chart for Methanol 2001Big 5th wave as you can see and now we are making base before trend changes...
I shared one before for the same share but this more clear with just targets
See you there ;)
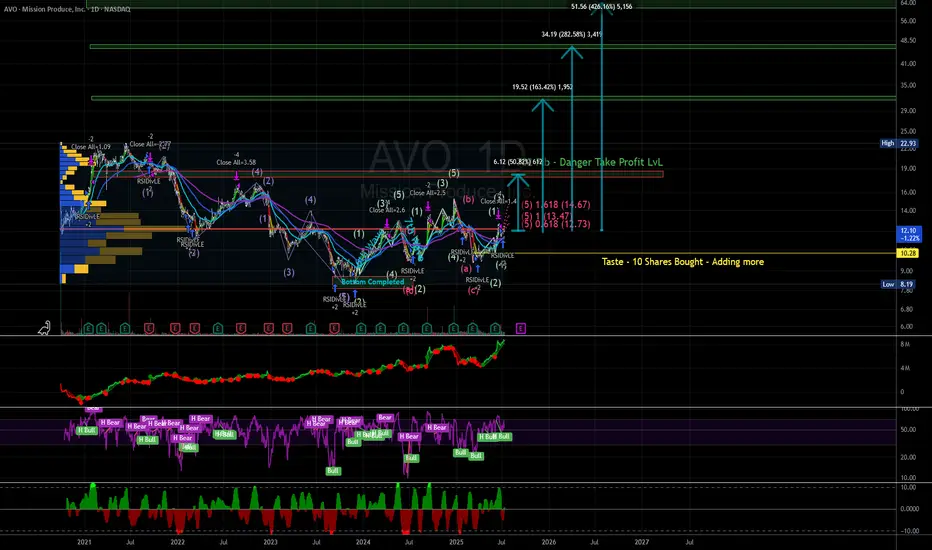
Not too bullish, but one to watch for break outThis trade is still in the consolidation phase, but has a potential break out with volume. Wanting to see price get above $13, before adding more to this position.
For the time being, watch and look for volume and consolidation.
NSE IONQ - Are we ready for a breakout?The corrective phase is complete and an impulse move appears likely. A strong buy above the A-B-C channel could target levels around 30 - 37 - 45 or higher. Good entry is possible above 26. However, if conditions worsen, further corrections may ensue.
I will update further information soon.

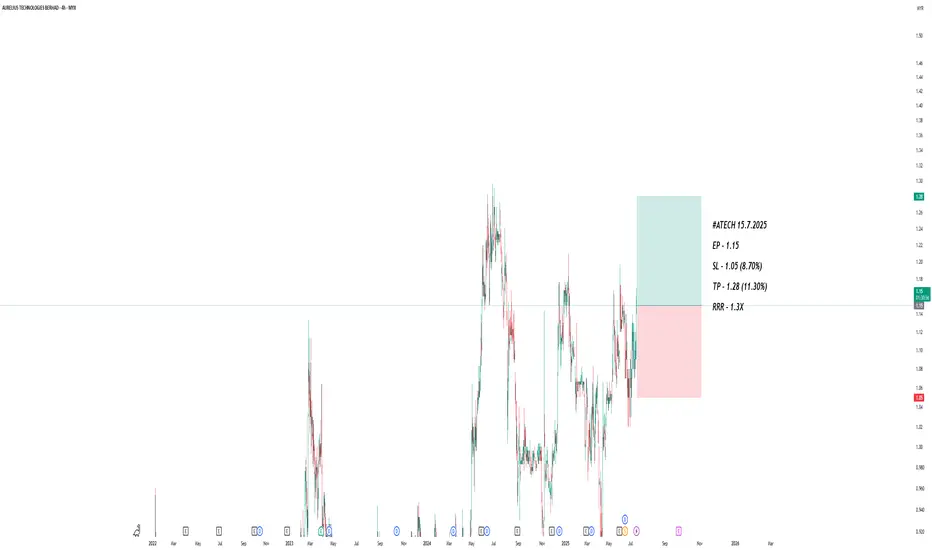
Bullish Wolfe Wave (W)Salam Alaykom,
As you can see we have bullish wolfe wave pattern with its targets, also long target when we hit the all wolfe targets...
See you there ;)
RGTI Heading to $17+ Good evening trading family
So currently due to price action it appears we are on our way to 17 dollar target however we expect a little bit of a correction at the 15 range.
However worst scenario if we go below 11 dollars be prepared for a sinker down to 8.
Trade Smarter Live Better
Kris/ Mindbloome Exchange
