VKTX looking good at current levelsSummary of the Chart – Viking Therapeutics, Inc. (VKTX), 1W Chart (NASDAQ):
Current Price: ~$33.99
Support Levels:
Major Support: ~$23.93
Intermediate Support: ~$33.81
Resistance Levels:
Near-Term Resistance: ~$34.66
Major Resistance / Target Zone: ~$60.98 to ~$61.15
Technical Pattern:
The chart suggests a bullish reversal setup forming after a prolonged downtrend.
The red arrow indicates a projected breakout above $34.66, targeting the resistance zone around $61.00+.
Volume & Indicators:
Volume is marked at 8.85M, with support/resistance suggesting bullish momentum buildup.
Interpretation:
If price breaks above $34.66, a potential upside target of $60.98–$61.15 is projected.
Failure to hold $33.81 support may push the stock back toward $23.93.

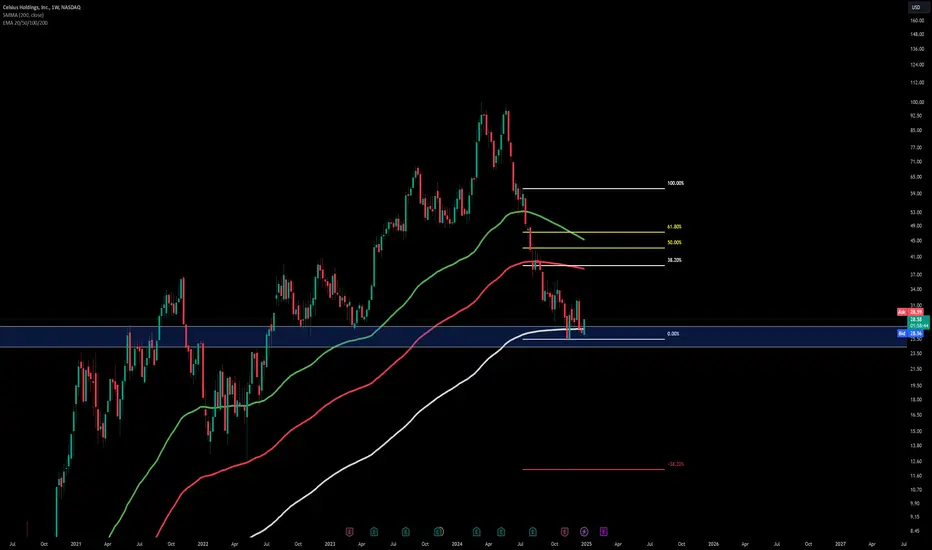
BullishI'm yet to own this stock, but after seeing this on the weekly, it looks incredible. I see a strong bounce off of the 200day and a pullback in the 45 area. Imo, it's gonna make an ATH late this year.
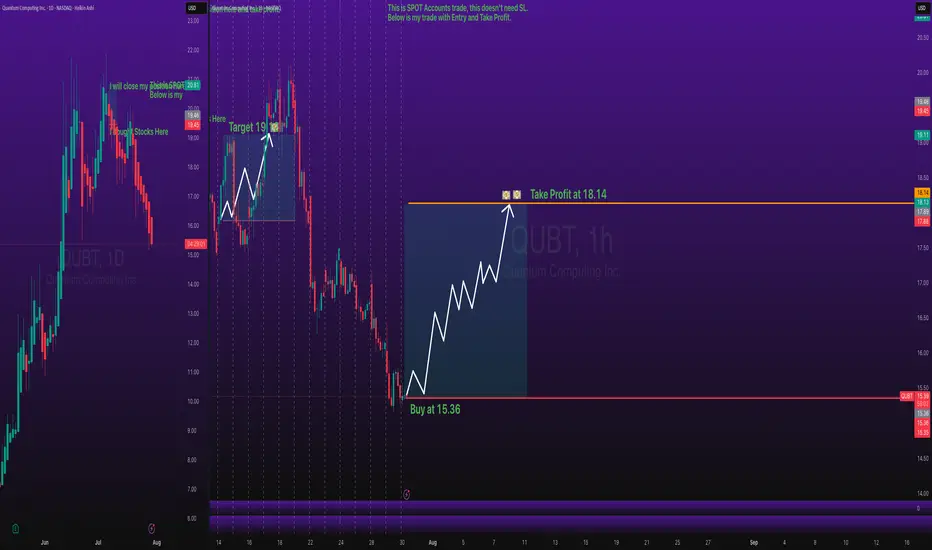
QUBT Stocks BUY Entry with Take Profit Level - Key ZonesStocks SPOT ACCOUNT: NASDAQ:QUBT stocks my buy trade with take profit.
This is my SPOT Accounts for Stocks Portfolio.
Trade shows my Buying and Take Profit Level.
Spot account doesn't need SL because its stocks buying account.
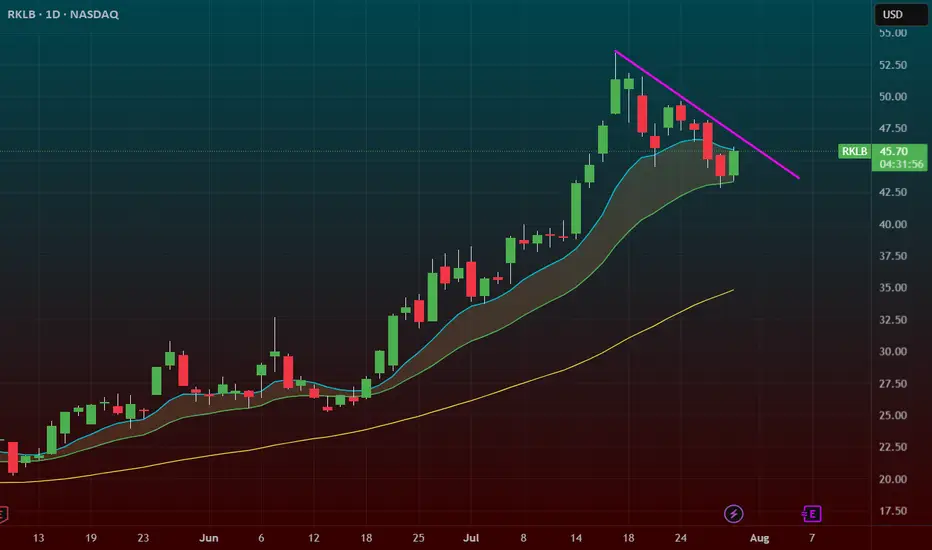
$RKLB – Momentum Pullback to 20 SMA with Trendline Break IncominRocket Lab ( NASDAQ:RKLB ) is setting up for a classic trend continuation move after a strong run. It just pulled back to the 20 SMA for the first time since breaking out over $35 — and it’s holding like a champ.
🔹 The Setup:
After peaking near $55, price pulled back in an orderly fashion on lower volume — a healthy correction.
Now we’ve got a hold at the 20 SMA, with a close back over the 9 EMA and a trendline break in progress.
This is where momentum tends to re-ignite.
🔹 Why It’s Powerful:
First 20 SMA test since the breakout = high probability bounce zone.
Lower volume on the pullback signals no panic selling.
A close over the 9 EMA + trendline = potential speed-up candle.
🔹 My Trade Plan:
1️⃣ Entry: Looking for confirmation over the 9 EMA and trendline.
2️⃣ Stop: Under the 20 SMA — tight structure, defined risk.
3️⃣ Target: Retest of highs near $55 with potential extension on breakout.
Why I Love This Chart:
NASDAQ:RKLB is a momentum name — when it moves, it moves fast.
The trend is intact, the pullback was clean, and now we have structure + volume setup.
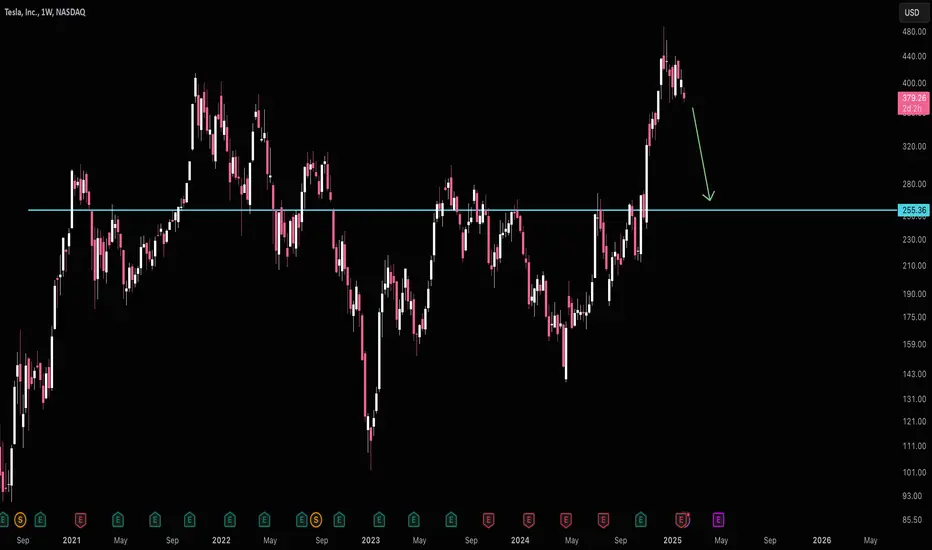
Tesla High Risk of $255Tesla is Stuck under $430 ATH resistance and at high risk of falling back to $255 support.
Tesla is no longer growing and Musk is polarizing and alienating their mostly progressive leaning customer base. This stock simply makes zero sense for a 200 pe ratio.
NIKE Confirms A Bullish Reversal With An Impulsive RecoveryWe talked about Nike on July 10 with our members, where we mentioned and highlighted a completed higher degree ABC correction in wave IV on the monthly and weekly charts.
Today we want to represent a closer view, as we see a five-wave impulsive recovery away from the lows on a daily chart. It actually confirms the bottom and bullish reversal, but since it can be trading in 5th wave that can stop around 80-85 area, we should be aware of a three-wave corrective setback soon. It can slow down the price back to the open GAP, so ideal buy zone is in the 70-60 area. Invalidation level is at 52.
Highlights:
Direction: Up, but watch out for a correction
Structure: Impulse, Wave 5 in final stages
Support: 70 / 60

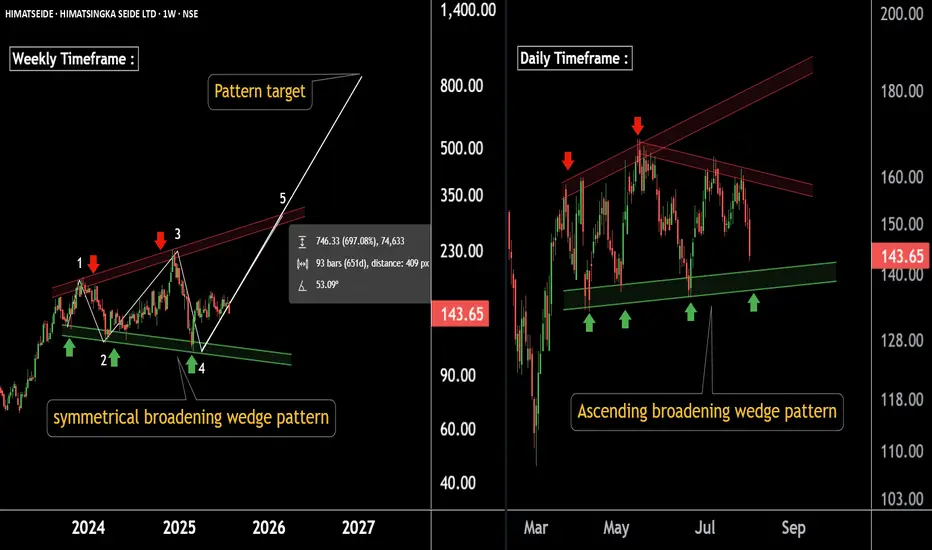
Massive Base Formation on Charts – Potential Multibagger LoadingThere are two Chart of HIMATSINGKA SEIDE.
Himatsingka Seide is forming a symmetrical broadening wedge pattern on the weekly timeframe, with a strong support zone near ₹100.
On the daily timeframe, Himatsingka Seide is forming an ascending broadening wedge pattern, with a crucial support level near ₹135.
If this level is Sustain then we may see higher prices in Himatsingka Seide.
Thank You !!
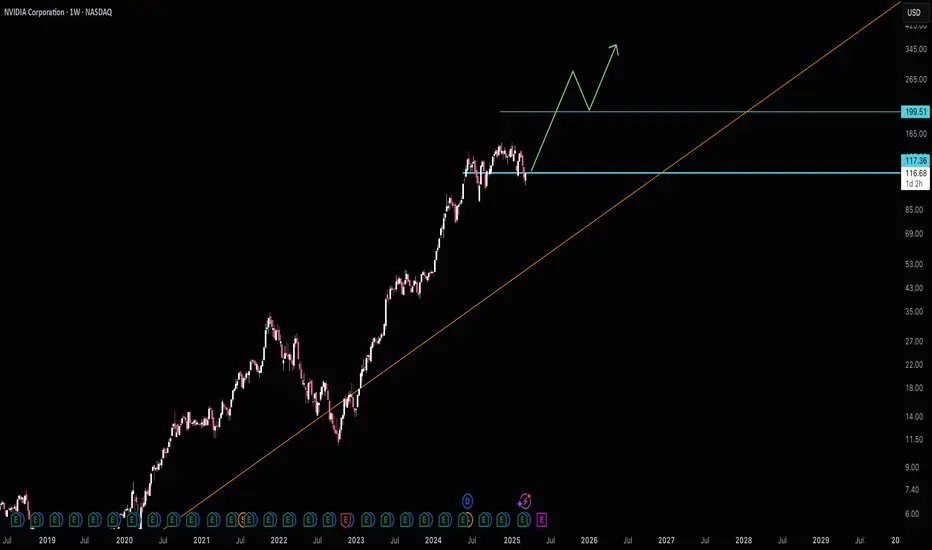
Nvidia Just Under Major SupportNvidia seems to have been pulled down by the Dow just like Apple as both are just under major support. I'm sorry for my previous Nvidia chart that drew support near 140, I recognize where I screwed up, but this chart should be good. Fortunately actual 117 support wasn't that far below and my NVDA isn't too in the red.
NVDA has the lowest revenue multiple in years right now. I know it's well off it's long term trend line, but it's growth rate is unlike anything it's ever been so expecting a steeper trend line to appear makes a lot of sense. Eventually I would imagine we'll get back to that trend line, but not anytime soon.
The Dow hitting major support should finally lift NVDA and the others that have been dragged down like AAPL and AMZN.
Good luck!
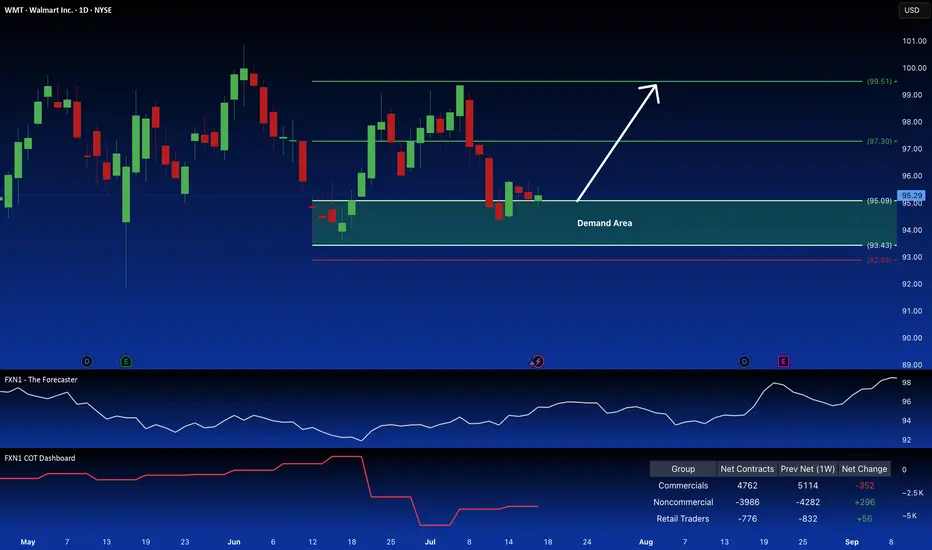
Walmart: Long Position Attractive on Demand ZoneWalmart Inc. presents a compelling long opportunity. The price action is reclaiming a key demand zone, suggesting a continuation of the current uptrend, a pattern reinforced by seasonal factors. Further bolstering the bullish case is the observed increase in large speculator positions.
✅ Please share your thoughts about WMT in the comments section below and HIT LIKE if you appreciate my analysis. Don't forget to FOLLOW ME; you will help us a lot with this small contribution.
Mean Reversion Trade: UPS1. RSI in oversold region
2. Price likely to rebound back the the mean
Trade Rules:
Entry Trigger - RSI has cross below oversold region, enter limit buy at close price
Exit Trigger - Close at market when close price cross above exit trigger (Red step line)

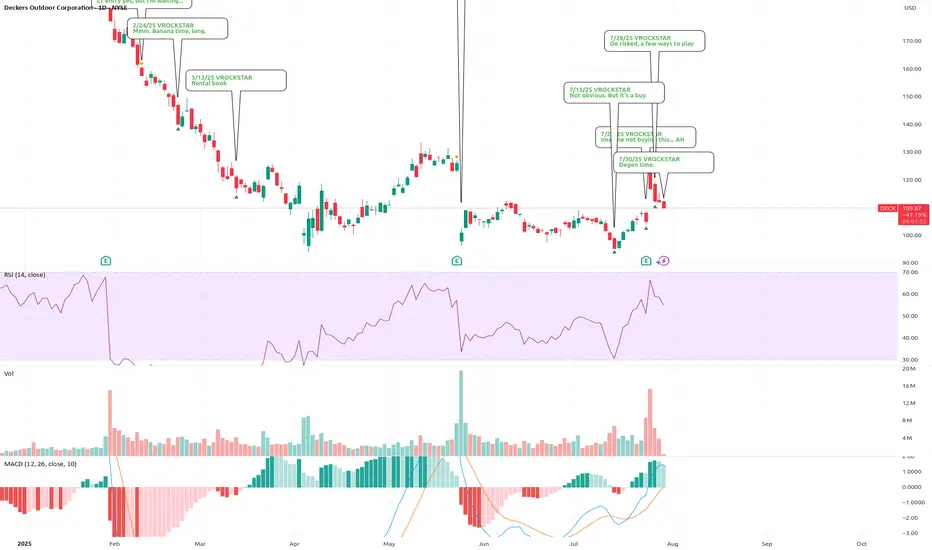
7/30/25 - $deck - Degen time.7/30/25 :: VROCKSTAR :: NYSE:DECK
Degen time.
- look at the last NYSE:ANF report... and tell me you're not noticing the exact same pattern. massive rip. massive gap fill retrace.
- do we re-test pre-report levels mid to low $100s?
- that's what keeps me buying ITM leaps here, but going quite large
- i'm trying to figure out w/ $V report, consumer spending... all consistent w my views, why this doesn't become just the most obvious winner into 2H and '26
- so i'm buying myself some time w/ these expires and ITM
- but it's degen time.
V
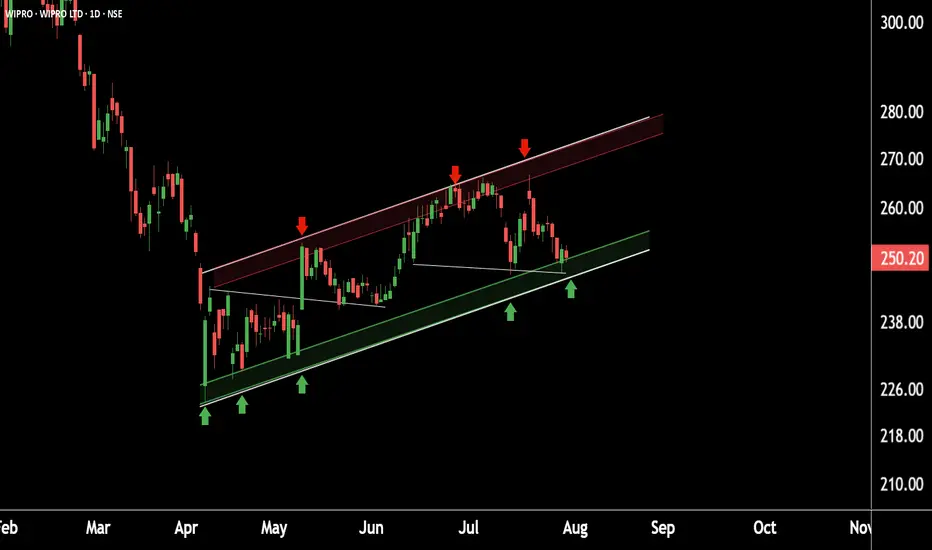
Wipro Near Crucial Support – Smart Money Watching Closely This is daily timeframe chart of Wipro.
Wipro is moving in well defined parallel channel with support zone near at 240 range.
If Wipro is sustain this level , then we may see higher prices in Wipro.
Thank You !!
$NOVO_BNovo Nordisk has had a tough time over the past 13 months, with its stock falling significantly. The main reason is growing investor concern that the explosive growth in sales of Wegovy and Ozempic may be slowing down, especially as competition heats up — particularly from Eli Lilly. Just a few days ago, Novo cut its full-year growth forecast, which confirmed some of those market worries.
At the same time, they announced a leadership change. Current CEO Lars Fruergaard Jørgensen is stepping down, and from August 7, Mike Doustdar will take over. He’s been with Novo since 1992 and has led the company’s international operations with great success. He’s also completed executive education at Harvard, and he’s widely seen as a strong, action-oriented leader with global experience.
Looking at the chart the price has almost always swayed up and down within this tunnel. Occationally falling to the trendline bellow.
Now we are at the trendline below - Meaning we are at an absolute panic state. One og the biggest pharma companies in the world - who in a matter of 5 years will bring a weight loss pill to this world - is ready for a new start.
Still somewhat of a falling knife - so be careful. But keep an eye out for a speedy return upwards.

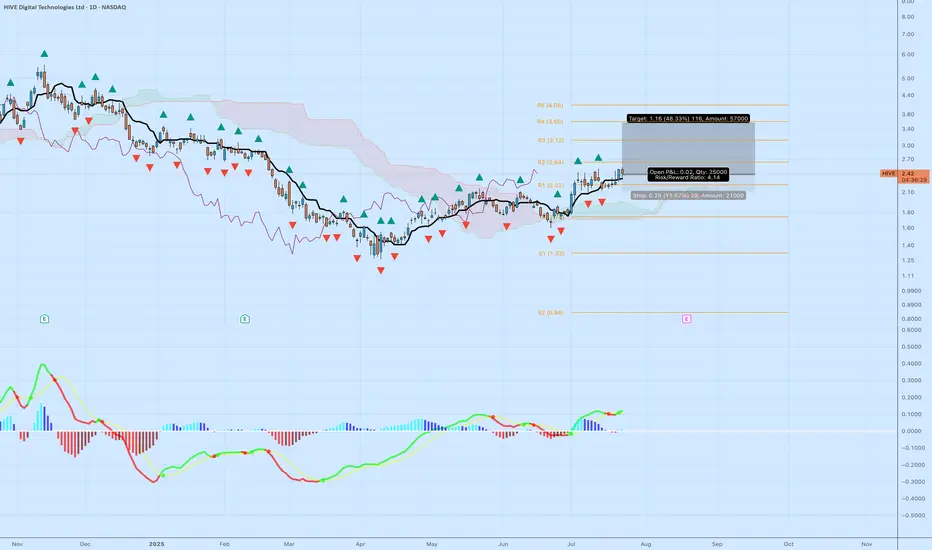
HIVE – Bullish Breakout Above Cloud with MACD and Fractal HIVE Digital Technologies ( NASDAQ:HIVE ) is showing a textbook trend reversal after months of basing. Price action has cleared the Ichimoku cloud with conviction, printing a bullish MACD signal and confirming structure with repeated fractal support.
Setup Breakdown:
Price above cloud and holding above R1 pivot (2.22)
Bullish MACD crossover with rising histogram and momentum curve
Multiple bullish fractals printed from the consolidation base
Entry off the breakout with clean support structure below
Target near R3 at 3.12 offers 48%+ upside with defined risk
Trade Details:
• Entry: $2.42
• Stop: $2.14
• Target: $3.58
• Risk/Reward: 4.14
• Quantity: 25,000 shares
This breakout lines up with broader crypto strength and interest in blockchain infrastructure. HIVE is well-positioned as a data center and digital asset play with rising institutional attention.
DLF is still struggling till today - {30/07/2025}2008 financial crisis it was so difficult for every corporate person in this living era,
Some companies have not yet recovered from the pre-2008 financial crisis level.
It is so hard to see them struggling,
I wish good luck to DLF company to make ALL TIME HIGH Soon,
Regards,
Happy Trading,
Stocks & Commodities Trade Analysis.

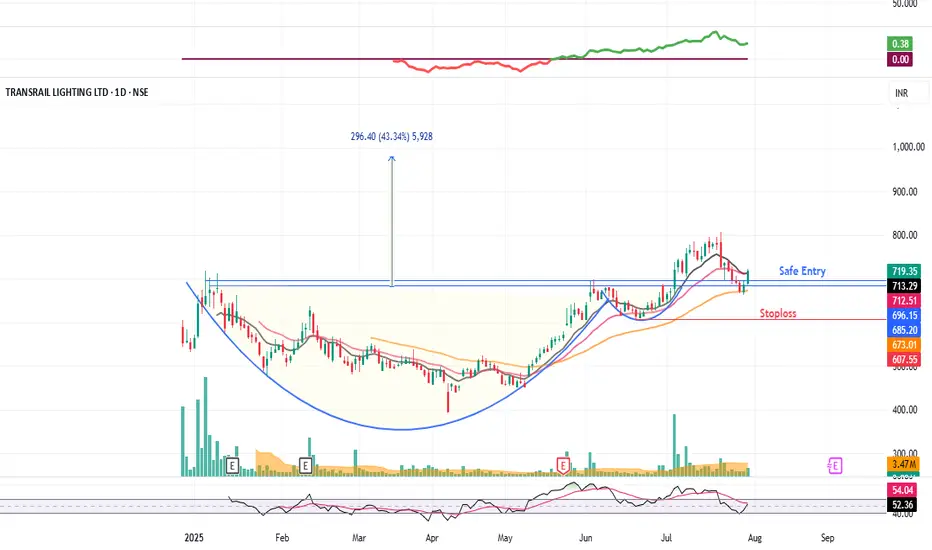
TRANSRAILL : Swing Trading (1-3 Months)#TRANSRAILL #patterntrading #cupandhandlepattern #breakoutstock #chartpatterntrading #IPOstock
TRANSRAILL : Swing Trading
>> Cup & Handle pattern
>> Breakout + Retest done
>> Trending stock Setup
>> Good Strength & Volumes picking up
Swing Traders can lock profit at 10% and keep trailing
Pls Boost, comment & Follow for more Analysis
Disc : Charts Shared are for Learning Purpose & not a Trade recommendation. Pls consult a SEBI Registered Advisor before taking position in it
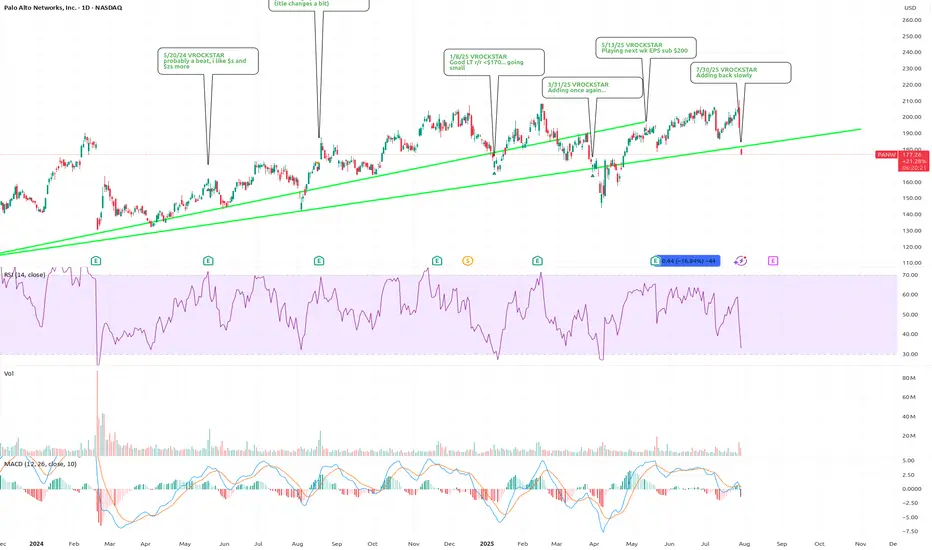
7/30/25 - $panw - Adding back slowly7/30/25 :: VROCKSTAR :: NASDAQ:PANW
Adding back slowly
- leader is extending it's lead w/ NASDAQ:CYBR
- NASDAQ:CYBR was a top 3 name for me in the sector
- so yeah, i'm buying ITM leaps here, slowly
- welcome back to the long book NASDAQ:PANW
V
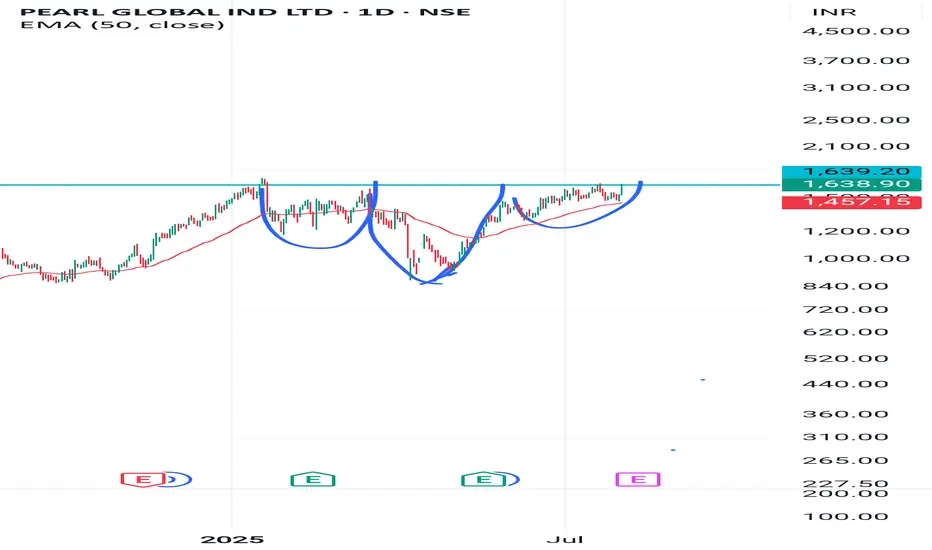
PGIL IS FORMING HEAD AND SHOULDER IN DAILY CANDLE ANALYSISAfter a long consolidation and up and downs , a bullish pattern is formed and ready to breake the neck line.
Above neckline
Target 1 1999.
Target 2 2349
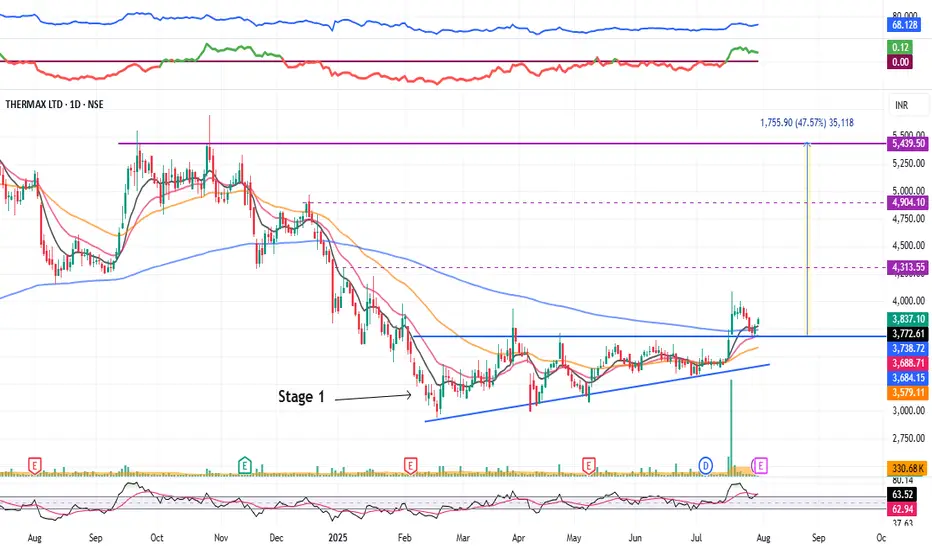
Thermax : Stage 1 Breakout (1-3 Months)#Thermax #stage1nreakout #ascendingtrianglepattern #patternbreakout #trendingstock #swingTrading
Thermax : Swing Trading
>> Stage 1 Breakout + Retest done
>> Ascending Triangle @ bottom of Downtrend
>> Trending setup in stock
>> Good strength & Recent Volume Buildup
>> Low Risk High Reward Trade
Swing Traders can lock profit at 10% and keep trailing
Pls Boost, comment & Follow for more Analysis
Disc : Charts Shared are for Learning Purpose & not a Trade recommendation. Pls consult a SEBI Registered Advisor before taking position in it
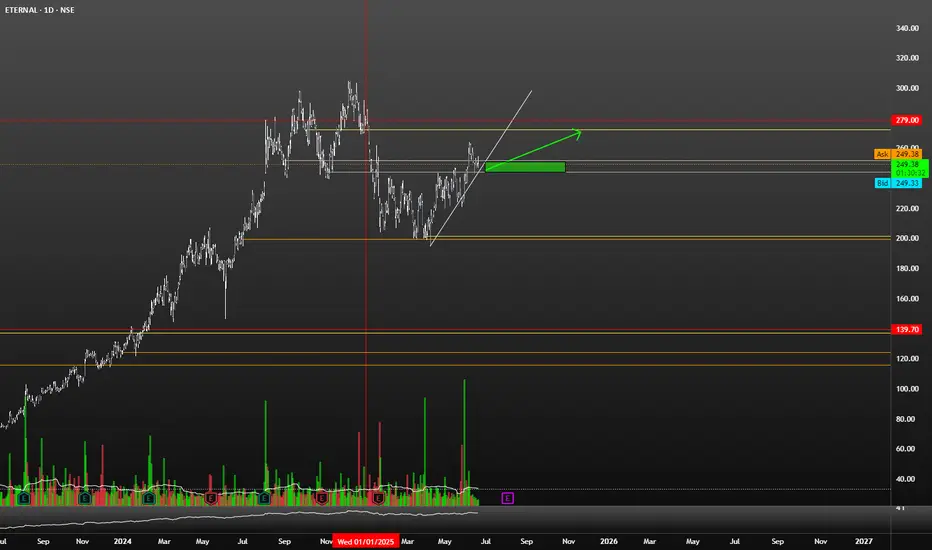
$NSE:ETERNAL To SkyRocket in the Coming Days !NSE:ETERNAL
Very Good Price Action is Already Formed.
Its the Time to make Accumulations of Stock near the Current price.
Its The Company, Which Goin to Cater Services the Future.
Its Now or Never !
Boost the idea ! Pal
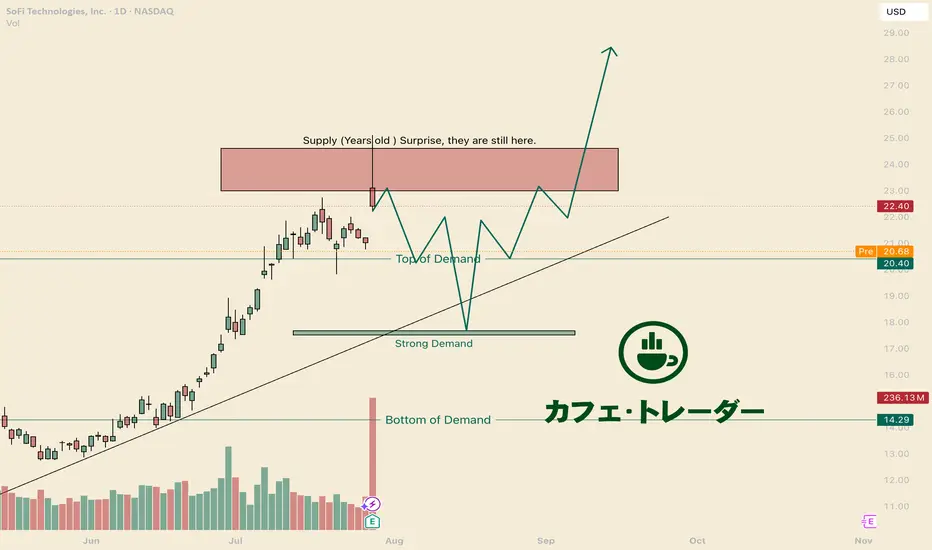
Scared? Become a BuyerHello I am the Cafe Trader.
With heightened interest in SOFI, I am seeing many worried posts, and skepticism. Before taking profits early, consider these levels fist.
Years Old Supply.
This Supply zone (marked in the red box) has been sitting here for years. It is no suprise that we get a dynamic reaction at this level.
Welcome to the Range
Now that you know there is a seller sitting there, If this doesn't jump back up and close above 24.71 by friday, expect to be sitting in a range for months.
Bulls are in Control
Even with that massive reacion, All previous bulls are still in tact and ready to accumulate more. Top of demand will fae the most pressure, but there are alot of buyers at that strong demand level. Be patient, and you can get great pricing.
Long Term
For those looking to get into SOFI, I have some prices that should line up with your personal sentiment.
FOMO Aggressive = $21.67 ( i dont recommend)
Aggressive = 20.40
Good price = 17.50 - 17.75
STEAL - 7.50-9.50
That's all for SOFI. Comment below if you want to see any other analysis!
Happy Trading
@thecafetrader
Boeing Company (BA) Long Setup Boeing Company (BA) Long Setup
Probable **Wave (5)** upside impulse from the recent \$225.26 low.
* Wave (4) looks complete — bullish structure shift starting from LL.
* Price is now breaking minor resistance, building momentum for continuation.
* **Demand Zone:** \$224.00–\$226.00 — proven bounce area, high-volume rejection
* **Supply Zone:** \$242.70–\$243.00 — last bearish engulfing + strong wick rejection
* RSI still recovering from **bullish divergence** on LL.
* **Entry:** \$227.75 (current consolidation near breakout)
* **Stop Loss:** \$224.00 (beneath recent low and demand)
* **Take Profit :** \$243.00 (supply zone)
* **Risk/Reward:** \~**3.0 R**
“In trading, the moment you think you’ve figured it out, the market humbles you.” – Mark Douglas*
#### ⚠️ **Disclaimer:**
This chart analysis is for educational purposes only and not financial advice. Always do your own research, manage risk, and trade responsibly.
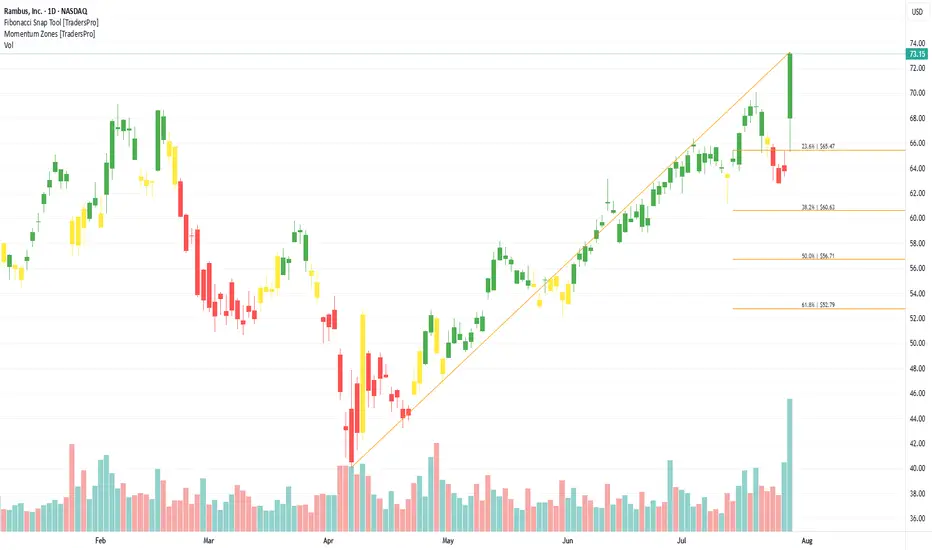
Rambus, Inc. (RMBS) Expands AI and Cloud SolutionsRambus, Inc. (RMBS) is a leading semiconductor and technology solutions company focused on high-speed memory interfaces, security IP, and advanced chips that power data centers, AI, and cloud computing. Known for innovation in high-performance computing, Rambus helps meet the growing demand for faster data processing and secure data transfer. The company’s growth is fueled by rising AI adoption, next-gen server technology, and the increasing need for data security worldwide.
On the chart, a confirmation bar with climbing volume signals strong buyer interest. The price has entered the momentum zone after moving above the .236 Fibonacci level. A trailing stop can be set just below this Fibonacci level using the Fibonacci snap tool to lock in gains while allowing more room for upward movement.