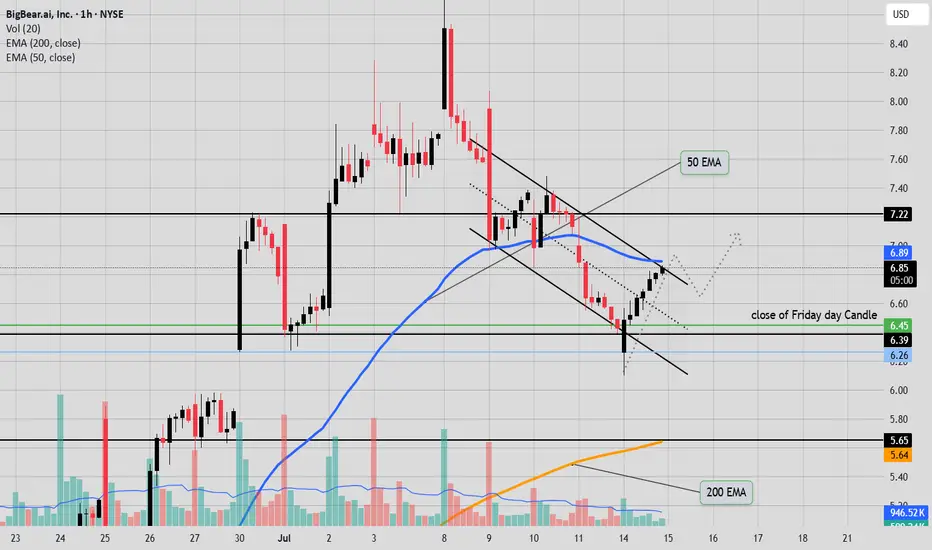
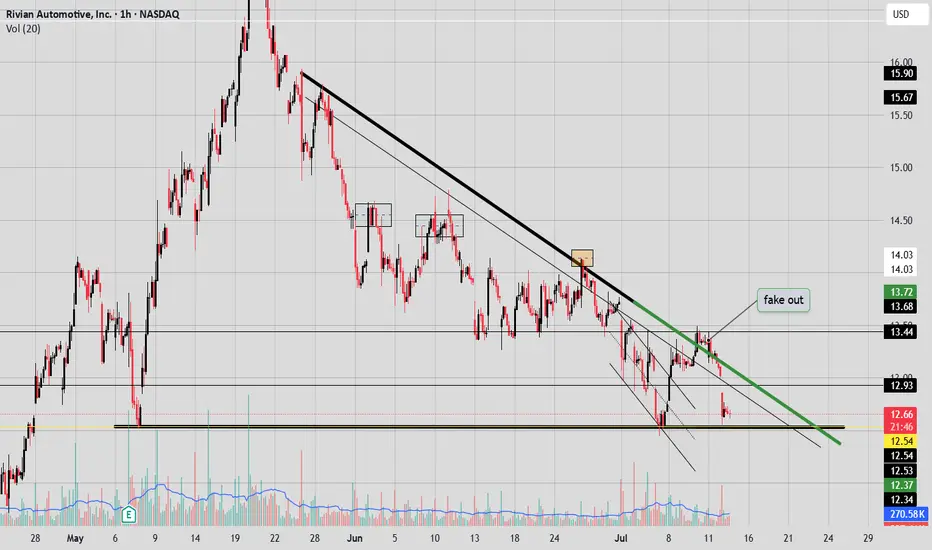
Downward Parallel StructureWe need a break of the downward parallel structure and the 50EMA 6.89, for the Bulls take charge. Buyers did a good job raising the price from the 6.45 closing price from Friday, but the bulls need to finish the job and make a HLs and HHs through the 50 EMA. If not Bears going to cycle the price back down.
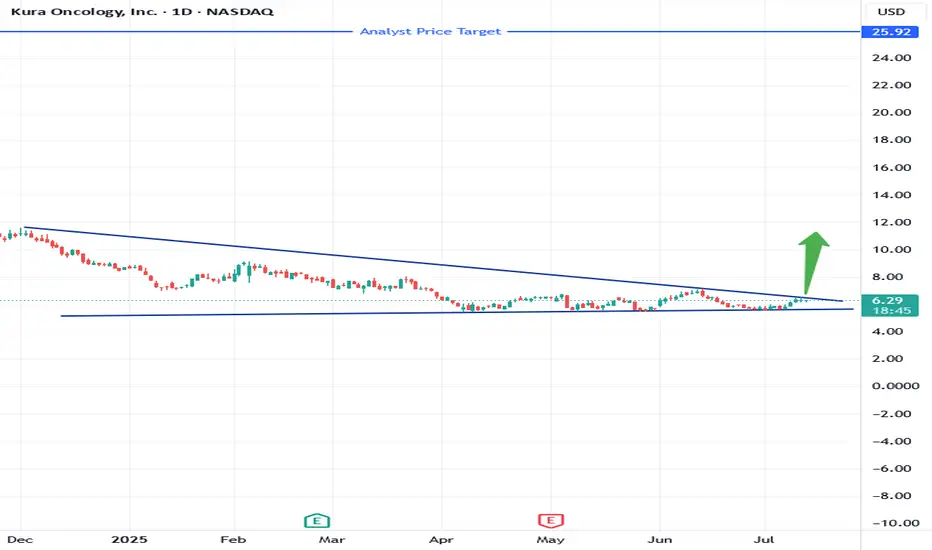
KURA Set for Liftoff: Breakthrough Cancer Drug, Massive Analyst Kura Oncology (KURA) is emerging from a prolonged downtrend just as its lead drug candidate, ziftomenib, approaches a critical FDA decision deadline this fall. With zeroed-in focus on targeted leukemia treatments and no approved competitors in its niche, Kura is positioned to benefit from increasing demand for precision oncology therapies and growing biotech investment.
Wall Street analysts remain highly optimistic, projecting more than 300% upside based on Kura’s strong cash position, late-stage pipeline, and potential blockbuster market for its lead asset. In a healthcare landscape where next-generation cancer treatments are both a clinical and economic priority, Kura’s story stands out as a high-reward opportunity for long-term investors.
Don’t miss our next big setup—hit follow now!
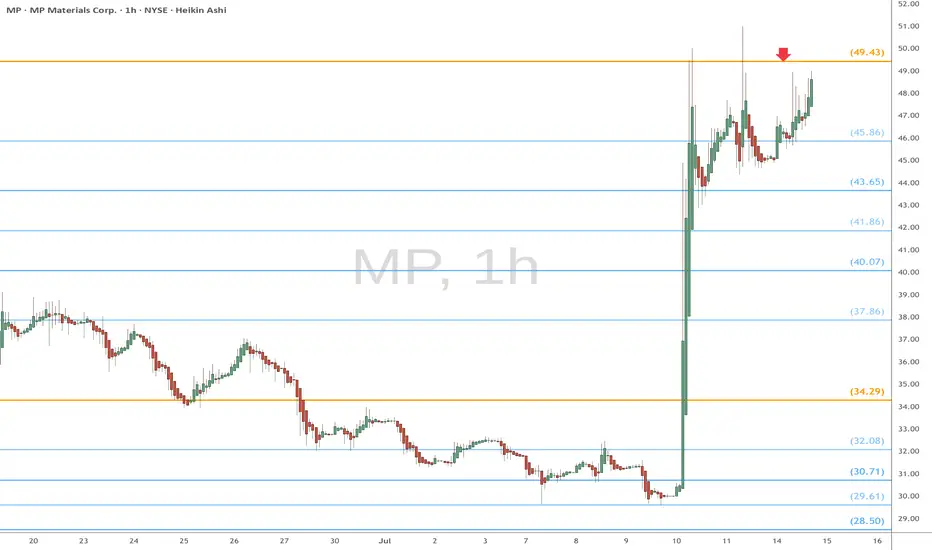
MP eyes on $49.43: Golden Genesis fib stopped the news spikeMP is now partially owned by the DOD, which spiked the price.
That massive move smacked into the Golden Genesis at $49.43
Look for a Break-n-Retest for idea long, or Dip-to-Fib below.
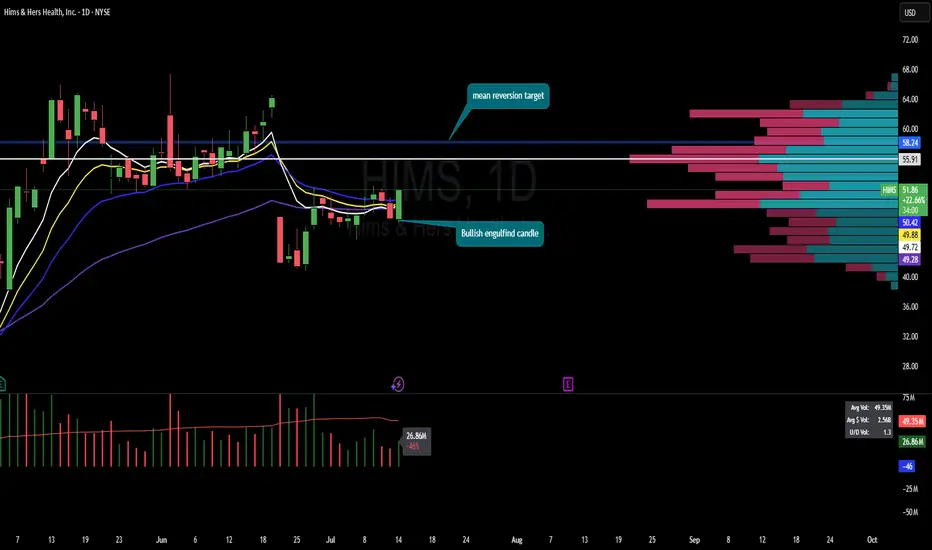
$HIMS $58 mean reversion target on horizonNYSE:HIMS daily with bullish engulfing candle. $58 pt is for gap fill.
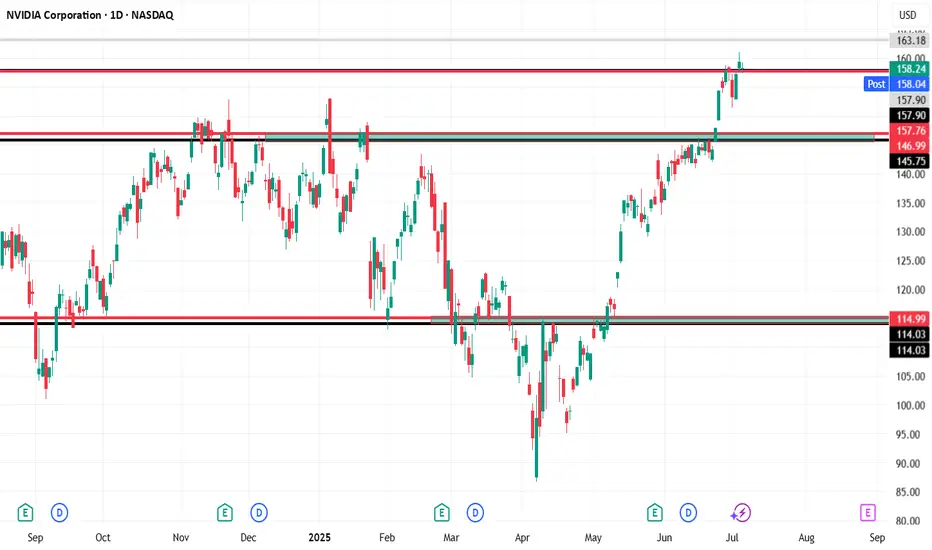
NVDA📊 NVIDIA (NVDA) – Daily Chart Technical Analysis
Entry Point:
A long position is considered at $158, assuming the price holds above $157.78.
Resistance & Target:
The first target is set at $163, which is a clear resistance zone on the chart based on historical price reactions.
If momentum continues beyond that, higher targets could be considered in future analysis.
Stop Loss:
A tight stop-loss is placed just below key support at $157 to manage risk.
🔄 Weekly Bearish Scenario:
If the price closes below $157, this invalidates the bullish setup:
The first downside target would be $146, which is a previously established support zone.
A further drop could extend toward $115, especially if broader market weakness or sector rotation occurs.
📌 Key Technical Zones:
Support Zones: $157.78, $157.00 (critical for bullish continuation)
Resistance Zones: $158.12, $163.18
Multiple historical rejections and price consolidations are noted near these zones, highlighting their significance.
Summary:
As long as NVDA remains above $157.78, the outlook remains bullish targeting $163. However, a confirmed breakdown below $157 could shift the sentiment sharply bearish, targeting $146 and possibly $115.
Review and plan for 15th July 2025Nifty future and banknifty future analysis and intraday plan.
Intraday ideas.
This video is for information/education purpose only. you are 100% responsible for any actions you take by reading/viewing this post.
please consult your financial advisor before taking any action.
----Vinaykumar hiremath, CMT

ANTM - IDX outlookANTM shares have very good fundamentals. The current price is wrong because there are many issues that hit ANTM, such as the issue of 109 tons of gold which was thought to be fake gold, as well as the issue of Budi Said regarding demands for 1.1 tons of gold which was ultimately proven by Budi Said to be guilty and to have carried out a fake transaction with one of ANTM's marketers. These 2 sentiments have weighed on ANTM for more than 1 year.
However, judging from the company's fundamentals, Antam's Q1 had a major correction because ANTM expanded its mining and nickel projects. Apart from that, nickel prices are also putting pressure on ANTM because there is still a correction in nickel commodity prices.
ANTM still has very good company fundamentals
Why?
1. ANTM through Inalum and MIND ID base owns 51% of Freeport shares, and Freeport is the largest gold mine in the world.
2. The completion of the case of 109 tons of ANTM gold, which many thought was fake, will restore public confidence in ANTM investors.
3. We can feel that we will now enter a recovery phase for all countries after the tough years of 2020 to 2023. 2024 will be a little more stagnant because of the many presidential elections in various countries which makes investors choose to wait and put more money into bonds and deposit.
4. Recovery of nickel prices and other minerals caused by demand due to the race for progress and ESG will benefit ANTM
5. The price of gold is consolidating again to reach an all time high, especially as the FED and other countries may reduce interest rates, this will make the gold price likely to decrease its all time high around 2600-3000 in 2025-2026
Antm price target for the next 1 year: IDR 2400 -2600
Target price for Antam for the next 3 years = IDR 4200- 5500
if you want to discuss with me or my team. please comment below.

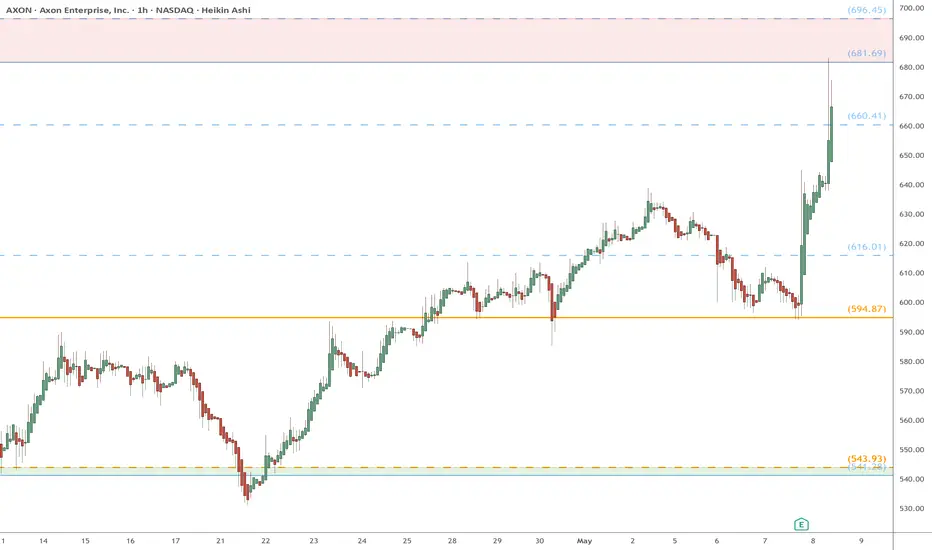
AXON watch $681-696: Proven resistance around ATH for a REASON AXON testing it All Time High resistance zone again.
This time it launched off a Golden Genesis below.
So it should have enough energy this time to break it.
$681.69-696.45 is the exact zone of interest.
$732.49-735.17 is first target then dip for retest
$660.41 then 616.01 are key supports below if dips.
==============================================
.
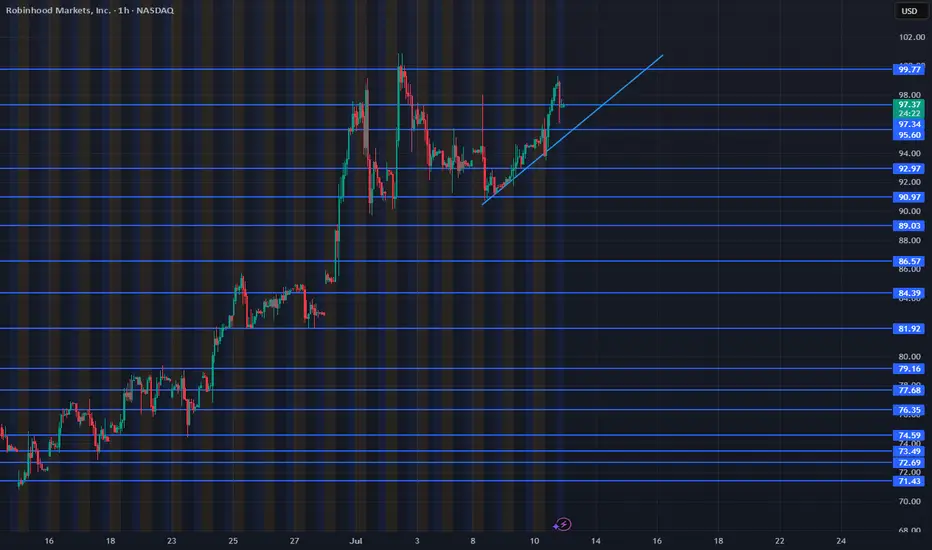
Trade Idea: $HOOD – $106C by 7/25 | Bullish Setup🧠 Thesis:
After topping out at $100, NASDAQ:HOOD pulled back ~10%. I believe this recent pullback sets up a healthy base for a continuation move back toward $100+ in the coming sessions. If momentum kicks in, we could see a push toward the $106 level by expiration.
📊 Key Levels:
Resistance: $95.60 → $97.34 → $99.77 → $102 → $106
Support: $94.00 (uptrend line), $92.97 (higher low), $90.97 (must hold for bulls)
📌 Trade Strategy:
I'm scaling into the $106 Calls expiring 7/25.
Looking for:
A breakout above $97.34 to trigger upside momentum
Profit-taking zones around $99.77 and $102
Final target near $106 (ITM zone)
Risk is managed below $92.97.
🧭 Notes:
Watching broader market sentiment and NASDAQ:QQQ correlation closely. Volume confirmation will be key on any breakout attempts.
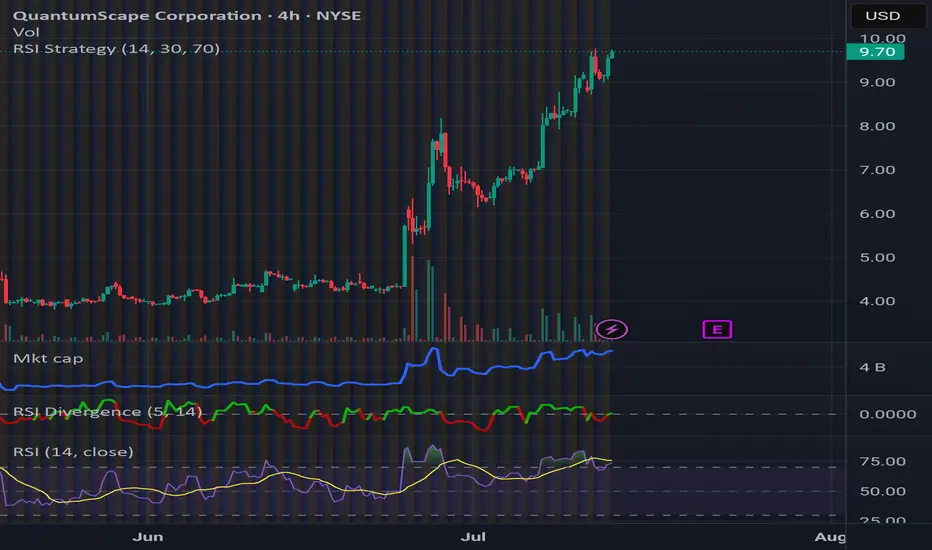
Trendline and Fake outs Despite the previous fake out, the trendline on the hourly is still powerful displeasing the bulls but giving hope to the bears, the bears need price to go below 12.54 to complete the down trend on the hourly chart.
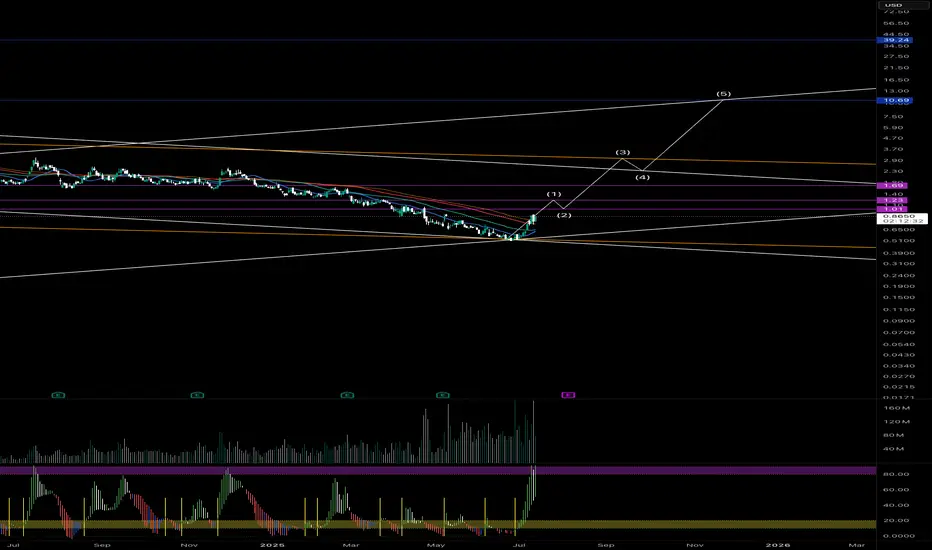
OPEN Long to 10.69Down ~98% from 2021 highs, changes to the business model, VC money is all sold (likely), and a chart to die for. I like it to IPO price, should tap within 18 months.
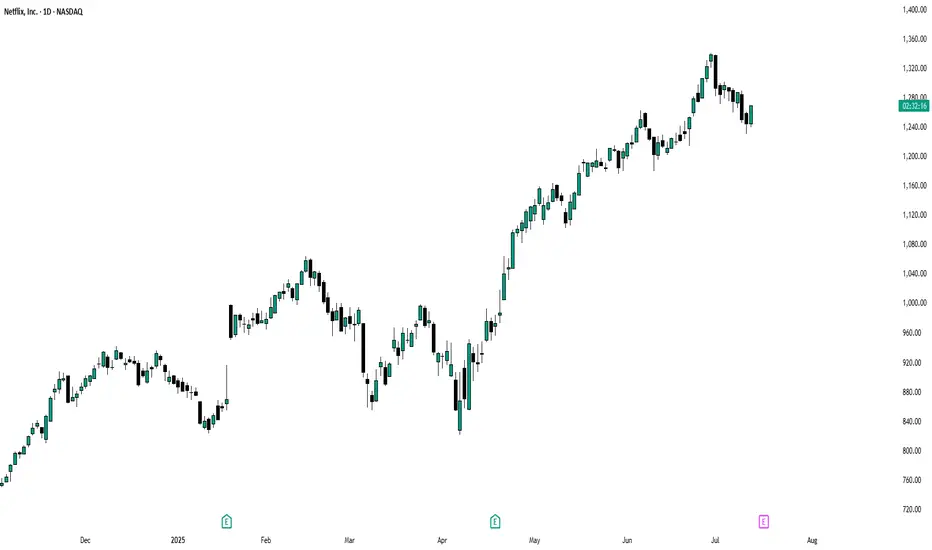
Netflix Faces Rising Volatility and Bearish Technicals Ahead of Netflix (NASDAQ: NFLX) will announce its results after the close of trading in New York on Thursday, 17 July. Analysts forecast the NASDAQ-listed streaming media company to report second-quarter earnings growth of 45%, reaching $7.08 per share, while revenue is expected to increase by 15.6%, amounting to $11.1 billion. Net subscriber additions are predicted to decrease by 42.9%, falling to 4.6 million.
For the third quarter, analysts forecast guidance for revenue of $11.3 billion, up 14.7%, and earnings of $6.68 per share, reflecting growth of 23.6%. The options market is pricing in a 6.4% move, either up or down, in Netflix shares following the earnings report.
The significant expected move in the stock is driven by implied volatility levels for options expiring on 18 July, which were high at nearly 70% as of the 13 July close and are likely to increase further as results approach. Options positioning in Netflix also appears notably bullish, with call delta values surpassing put delta values. This indicates that once the company reports its results and options begin to decrease in value due to the decay of implied volatility, market makers might find themselves overly hedged on the long side, potentially forcing them to sell shares. This scenario could exert downward pressure on the stock if it fails to breach the $1,300 level, which acts as the gamma call wall.
Additionally, technical analysis shows a downside risk for the shares both before and after the results. The Relative Strength Index (RSI) for Netflix has been trending lower and recently dropped below 50, signalling a shift in momentum from bullish to bearish. Furthermore, the stock has broken down from a rising broadening wedge pattern, which is traditionally seen as a bearish reversal signal, indicating a possible decline back towards the pattern’s origin, around $1,100.
Written by Michael J. Kramer, founder of Mott Capital Management.
Disclaimer: CMC Markets is an execution-only service provider. The material (whether or not it states any opinions) is for general information purposes only and does not take into account your personal circumstances or objectives. Nothing in this material is (or should be considered to be) financial, investment or other advice on which reliance should be placed.
No opinion given in the material constitutes a recommendation by CMC Markets or the author that any particular investment, security, transaction, or investment strategy is suitable for any specific person. The material has not been prepared in accordance with legal requirements designed to promote the independence of investment research. Although we are not specifically prevented from dealing before providing this material, we do not seek to take advantage of the material prior to its dissemination.
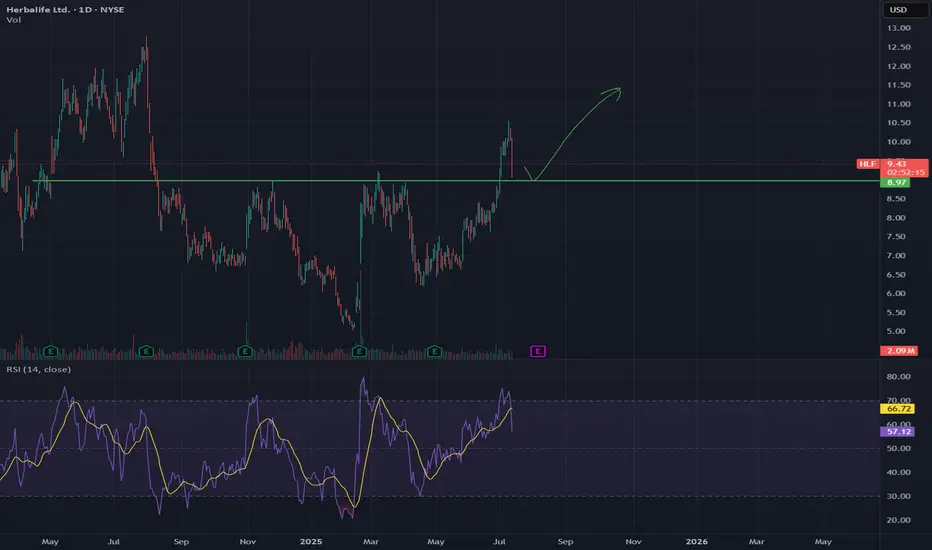
time to buy HLFBouncing off new support, after a very long descent, this company is still profitble and looks severely oversold. Not to mention what looks like a new uptrend, looks like buy and hold for me.
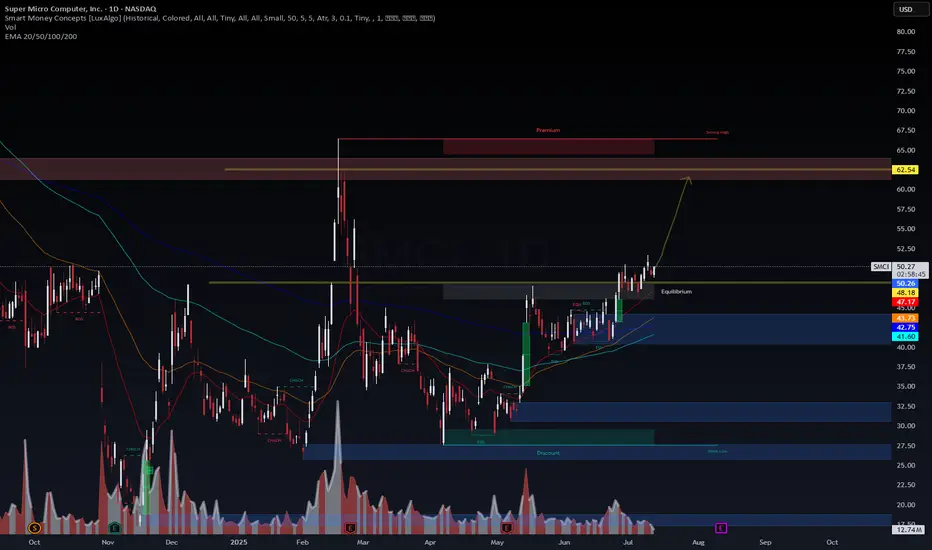
SMCI: Watching Monitoring price action closely. Momentum remains positive, and volume is supportive of continuation. Awaiting confirmation before entering, but setup favors a potential move higher.
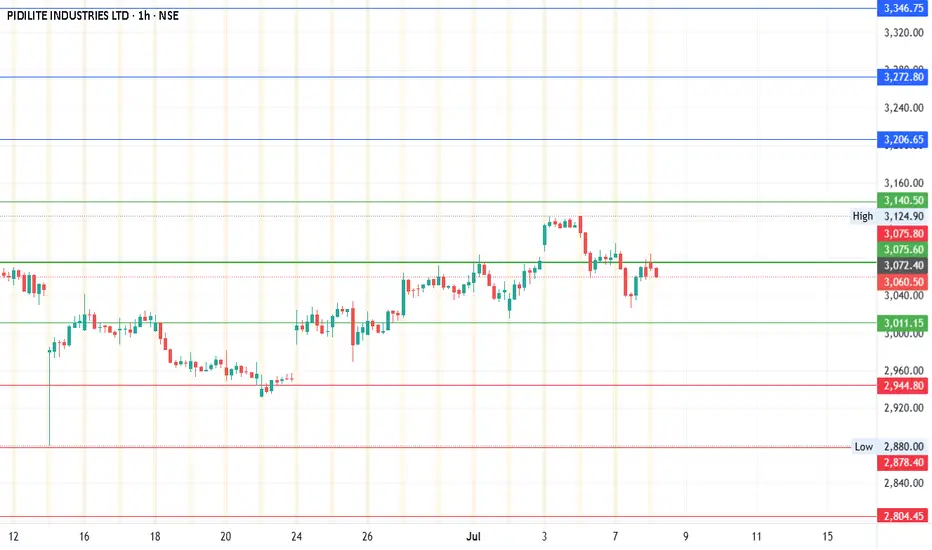
#PIDILITINDDate: 08-07-2025
#PIDILITIND Current Price: 3066
Pivot Point: 3075.60 Support: 3011.17 Resistance: 3140.52
#PIDILITIND Upside Targets:
Target 1: 3206.66
Target 2: 3272.80
Target 3: 3346.75
#PIDILITIND Downside Targets:
Target 1: 2944.78
Target 2: 2878.40
Target 3: 2804.45
Hedge funds buy in is in playBesides hedge funds, options market is ringing bullish. Any supporting data anyone would like to share?
tradingview.sweetlogin.com
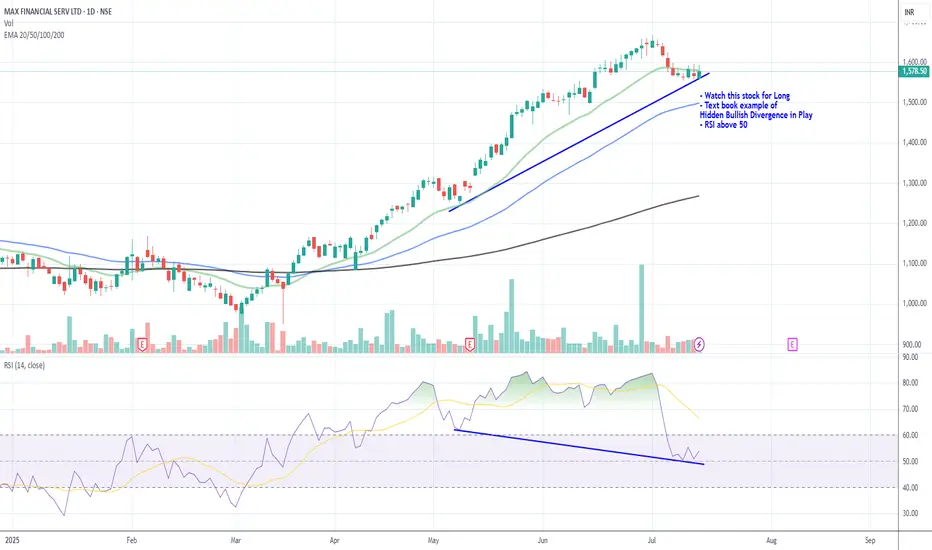
Watch MFSL for Long- Watch this stock for Long
- Text book example of
Hidden Bullish Divergence in Play
- RSI above 50
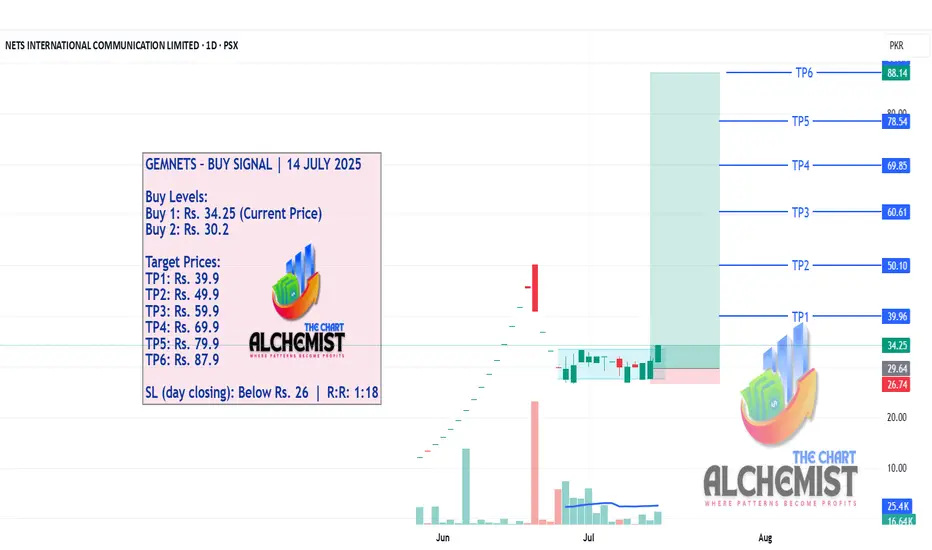
GEMNETS – BUY SIGNAL | 14 JULY 2025GEMNETS – BUY SIGNAL | 14 JULY 2025
After a strong move from Rs. 12 to Rs. 20, GEMNETS entered a pullback phase, which has now transformed into a bullish flag and reaccumulation zone — a powerful structure setting up for another leg higher.
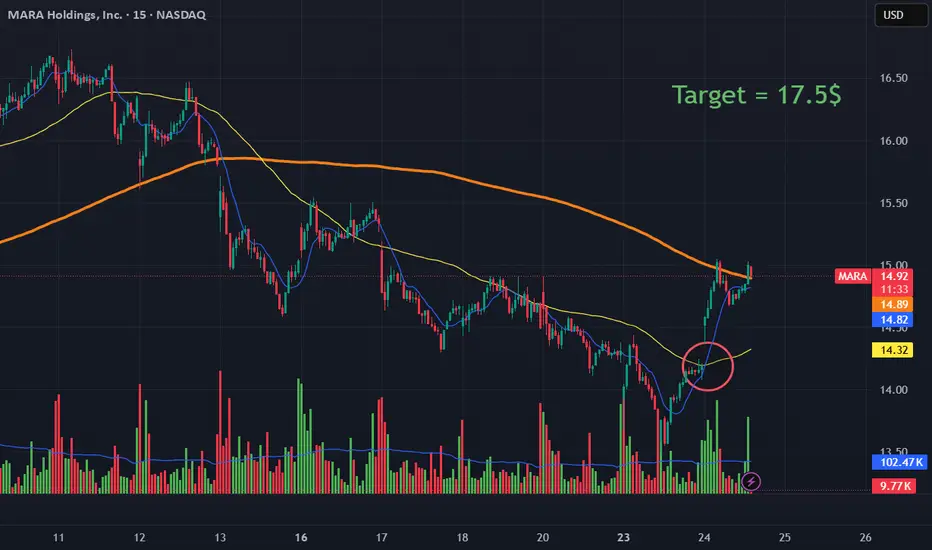
Why MARA Stock Could Rally Now as Bitcoin Eyes Its Next Leg UpWith Bitcoin regaining momentum, MARA Holdings (MARA) is showing technical signs that could signal a strong rally ahead. Here’s why the chart supports a bullish case:
1. Bullish Technical Breakout
Golden Cross Signal: On the 15-minute chart, MARA has just seen its shorter-term moving average (blue) cross above the longer-term moving average (yellow), highlighted by the red circle. This “golden cross” is often seen as a bullish momentum signal, indicating a potential trend reversal to the upside.
Strong Volume: The recent surge is accompanied by a spike in green volume bars, confirming strong buying interest and supporting the breakout.
2. Clear Upside Target
Target Set at $17.50: The chart highlights a target price of $17.50, which represents a significant upside from the current level around $14.95. This target aligns with previous resistance and could be reached quickly if momentum continues.
3. Bitcoin’s Influence
Crypto Correlation: MARA is highly sensitive to Bitcoin’s price movements. With BTC back on track and showing signs of starting its next leg up, MARA typically amplifies those moves, often rallying harder than Bitcoin itself.
4. Momentum Shift
Breaking Above Resistance: MARA has broken above short-term resistance levels and key moving averages, shifting the momentum from bearish to bullish in the short term.
Room to Run: The next major resistance is near the $16.50–$17.50 zone, giving the stock room for a continued rally if buying pressure persists.
Bottom Line:
MARA’s chart is flashing bullish signals just as Bitcoin is setting up for another potential rally. With a technical breakout, strong volume, and a clear upside target, MARA could be poised for a significant move higher if the crypto market continues to recover.
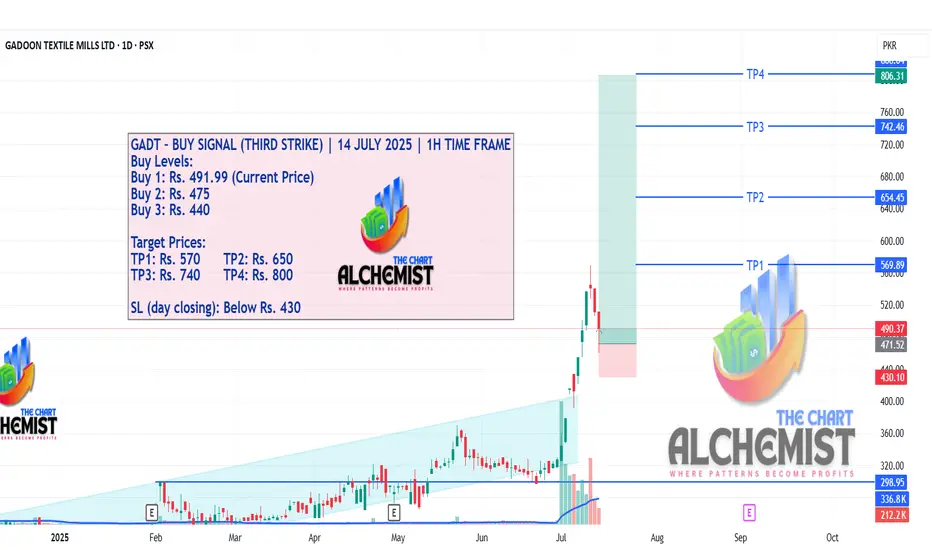
GADT – BUY SIGNAL (THIRD STRIKE) | 14 JULY 2025 | 1H TIME FRAMEGADT – BUY SIGNAL (THIRD STRIKE) | 14 JULY 2025 | 1H TIME FRAME
After breaking out of a slightly upsloping trading range (marked in light blue) and achieving a high of Rs. 570, GADT pulled back. With the pullback nearly complete, we expect a bounce and a run toward multiple quantified displacement targets.
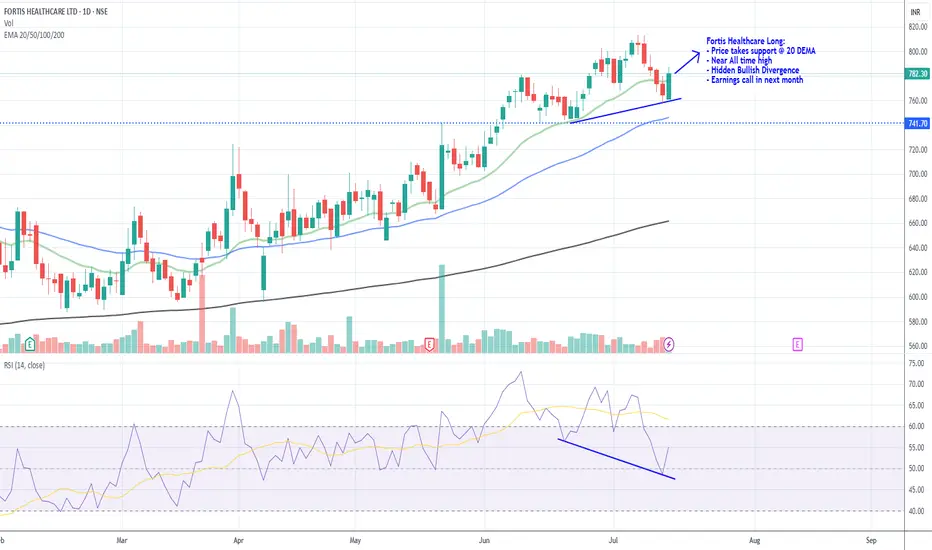
Fortis Healthcare Long:Fortis Healthcare Long:
- Price takes support @ 20 DEMA
- Near All time high
- Hidden Bullish Divergence
- Earnings call in next month
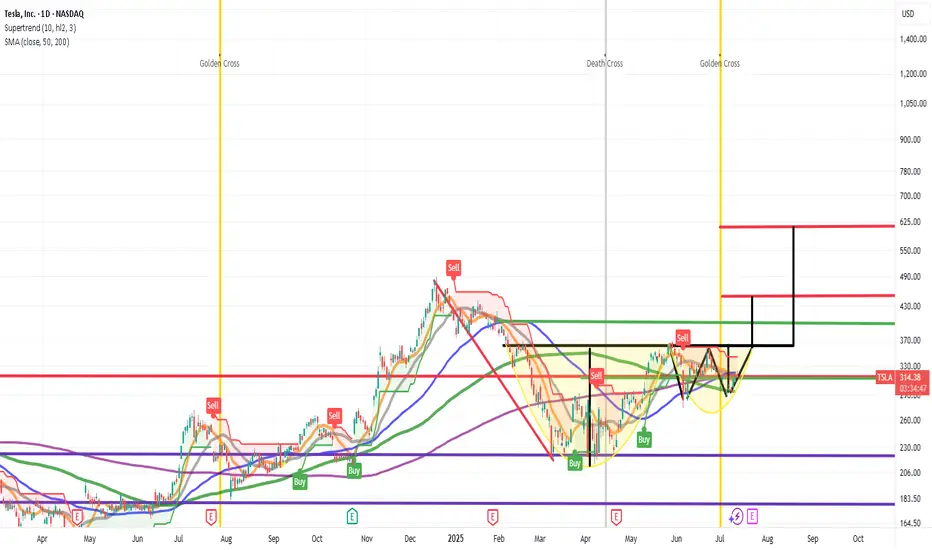
Cup & HANDLE + Mini Double Bottom: $TSLA to $610 ScenarioI maintain a bullish stance on Tesla ( NASDAQ:TSLA ), supported by a compelling combination of technical patterns and strong fundamental drivers. The current chart setup reveals a Cup and Handle formation complemented by a Mini Double Bottom, both of which are classic bullish continuation patterns. These suggest a potential breakout scenario that could drive NASDAQ:TSLA to $610 by year-end.
Technical Roadmap:
Gap Fill to $408: Anticipated earnings momentum, particularly from the Robotaxi segment, is likely to propel the stock to fill the previous gap at $408.
Consolidation at $450: Following the gap fill, I expect a consolidation phase forming a “box” around the $450 level.
Breakout to $610: A decisive breakout above $450 could trigger a strong rally toward the $610 target.
***Current Key Catalysts Supporting the Bullish Thesis:
Robotaxi Expansion: Tesla’s autonomous driving initiative is gaining traction, with Robotaxi developments expected to significantly boost revenue and margins.
India Market Entry: Tesla’s upcoming launch in India opens access to one of the world’s largest and fastest-growing EV markets.
In-House Chip Development & Dojo 2 Expansion: Continued investment in AI infrastructure and custom silicon enhances Tesla’s competitive edge in autonomy and robotics.
Tesla Diner Launch: The near-completion of Tesla’s themed diner adds to brand visibility and customer engagement.
Global EV Adoption: Tesla continues to benefit from rising EV demand across multiple international markets.
Optimus Robot Hype: Growing interest in Tesla’s humanoid robot project could unlock new revenue streams and investor enthusiasm.
Favorable Macro Trends: A declining interest rate environment supports higher valuations for growth stocks like Tesla.
Institutional Accumulation: Recent trading activity suggests that institutional investors are accumulating shares within the current range.
Grok AI Integration: The integration of Grok AI into Tesla vehicles could enhance user experience and differentiate Tesla’s infotainment ecosystem.
Investment Strategy:
I recommend initiating or increasing exposure to NASDAQ:TSLL (leveraged Tesla ETF) ahead of the upcoming earnings report. This could offer amplified returns if the bullish scenario plays out. Consider accumulating further on any dips, particularly during the consolidation phase around $450.
BUY NOW NASDAQ:TSLA NASDAQ:TSLL
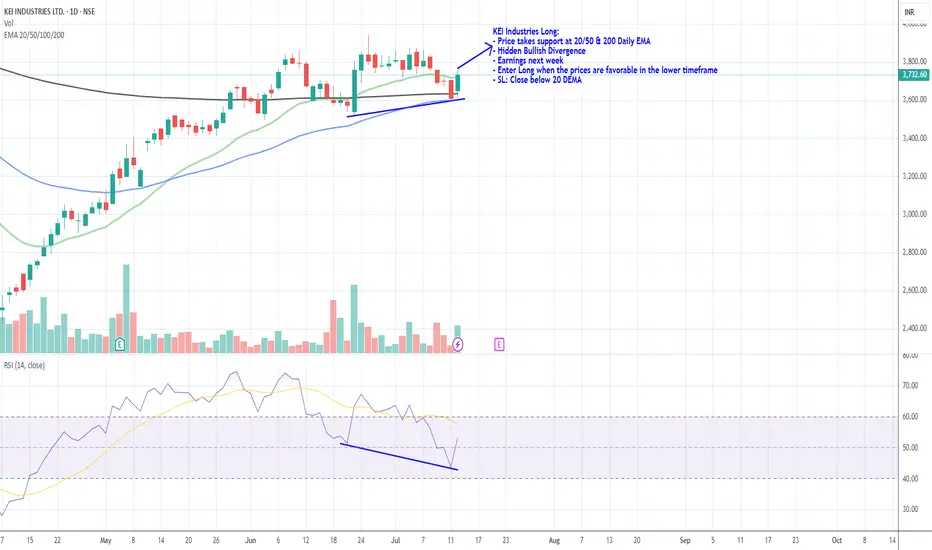
KEI Industries Long_Support @ 20 DEMAKEI Industries Long:
- Price takes support at 20/50 & 200 Daily EMA
- Hidden Bullish Divergence
- Earnings next week
- Enter Long when the prices are favorable in the lower timeframe
- SL: Close below 20 DEMA