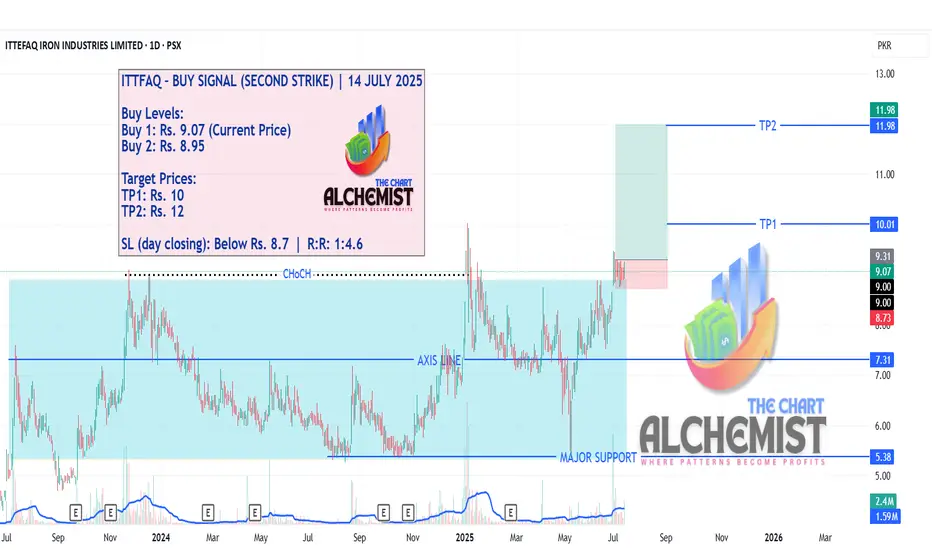
ITTFAQ – BUY SIGNAL (SECOND STRIKE) | 14 JULY 2025ITTFAQ – BUY SIGNAL (SECOND STRIKE) | 14 JULY 2025
Given the recent formation of a bullish structure, we're revising both buy and stop loss levels to reflect the current opportunity.
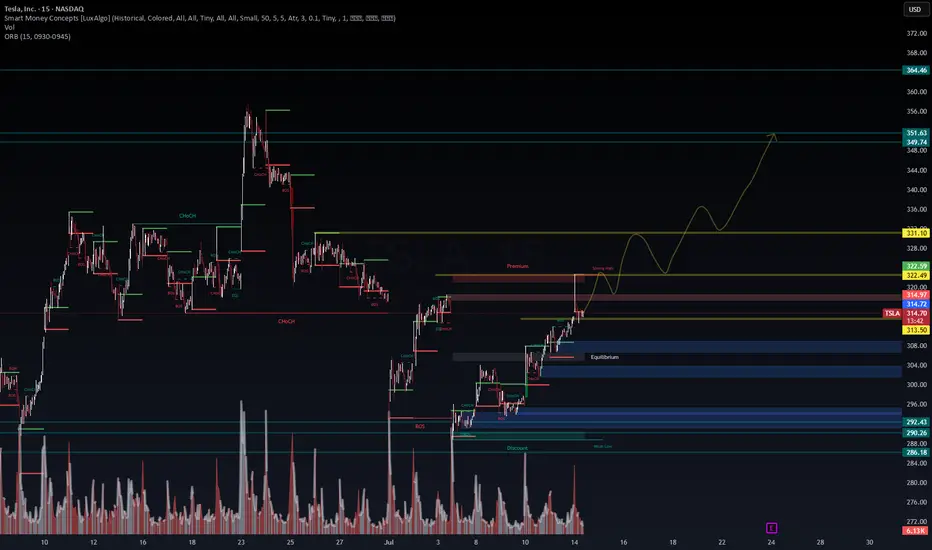
TSLA | Breakout Fuel Loaded – Will the Trend Accelerate Toward 🚗 TSLA | Breakout Fuel Loaded – Will the Trend Accelerate Toward $350?
🔍 Chart Type: 15m
🧠 System: Smart Money Concepts (LuxAlgo) + WaverVanir DSS
📊 Volume: 2.08M
🧭 Narrative: Liquidity Engine + Bullish Flow Momentum
📈 Current Price: $314.78
Clean breakout above BoS and ChgofCHoCH
Currently testing Strong High within a defined Premium Zone
EMA Stack (20/50/100/200) is bullishly aligned
📌 Key Levels to Watch:
📍 Premium Resistance: ~$315–$318
⚖️ Equilibrium Support: ~$309
💧 Discount Liquidity Zones: $292.43, $290.26
🚀 Upside Targets:
Minor: $322.49
Mid: $331.10
Major: $349.74 → $351.63 (projected wave peak)
📈 Bullish Case (Preferred by DSS Flow Model):
Retest of strong high → rally toward $322 then $331
Momentum and volume support trend acceleration
Break of $331 opens path toward $349.74–$351.63 (final wave)
📉 Bearish Invalidator:
Break below equilibrium ($309) → Discount zone retest
Watch $292–$286 for final liquidity sweep if rejection occurs
📅 Catalyst:
Earnings (📦 E icon marked) + macro tech sentiment could ignite explosive continuation
Market structure favors liquidity vacuum toward premium targets
🧠 VolanX DSS Sentiment: STRONG BULLISH
✅ Structure: Uptrend
✅ Volume: Expanding
✅ Momentum: Aligned
🟡 Risk: Premium rejection short-term possible
🔁 Executed via VolanX AI Scanner + WaverVanir DSS Engine
📊 “The Edge Is a System. The System Is Intelligence.”™
#WaverVanir #TSLA #SmartMoneyConcepts #PriceAction #LiquidityZones #Tesla #TechnicalAnalysis #VolanX #InstitutionalEdge #AITrading #QuantFinance
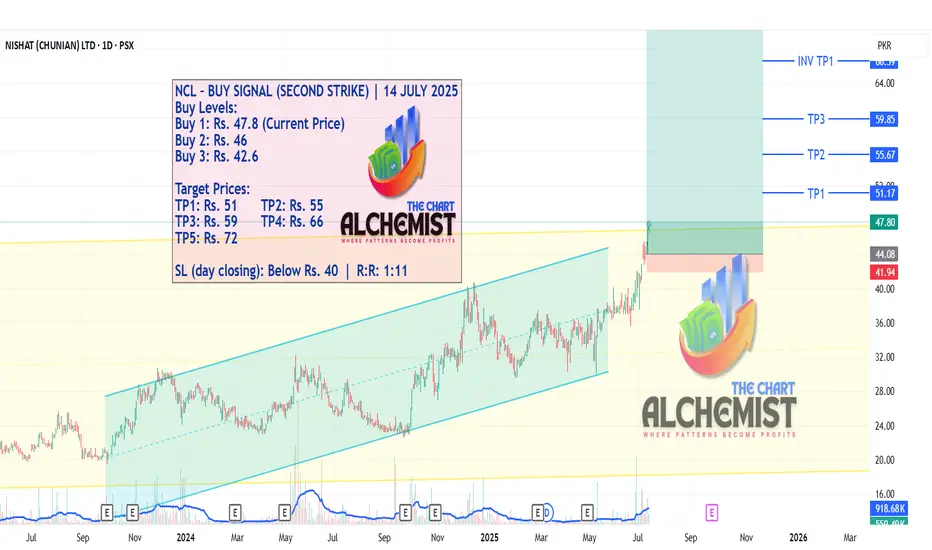
NCL – BUY SIGNAL (SECOND STRIKE) | 14 JULY 2025NCL – BUY SIGNAL (SECOND STRIKE) | 14 JULY 2025
After a successful first strike that achieved all targets, NCL has now broken out of consolidation zones on both higher (yellow) and shorter (light blue) time frames. This setup presents a strong second strike opportunity.
Weekly review of SPY, QQQ, GC, CL, ETH, BTC, UBER, TOST, TKOWeekly review of SPY, QQQ, GC, CL, ETH, BTC, UBER, TOST, TKO

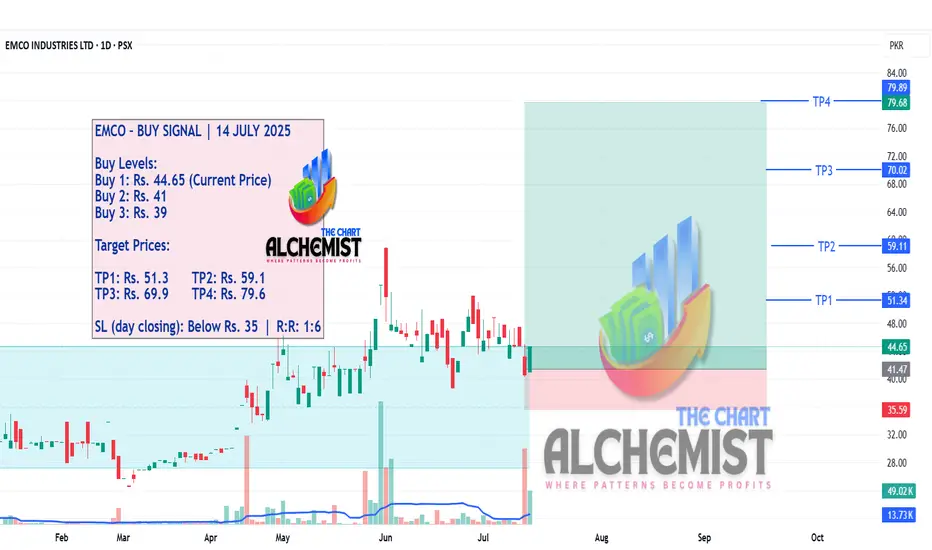
EMCO – BUY SIGNAL | 14 JULY 2025EMCO – BUY SIGNAL | 14 JULY 2025
After breaking out of a trading range (light blue channel) and achieving a high of Rs. 59, EMCO completed its pullback and retest phase, positioning itself for upward movement.
Short-term Bear Case for CRCLHello Traders!
As part of my weekly equity trade analysis, I will be uploading my recordings of what I am seeing and intending to trade for the week. A quick summary of what's in the video is as follows:
- CRCL is a high beta stock that seems to not be moving in tandem with its peers as of late
- I am expecting volatility due to market data and monthly options expiration
- CRCL has formed a new bearish order block below another bearish order block and is wedged with a weekly bearish setup. We are anticipating expansion out of this range to the downside
- I am waiting for a re-test of $199-$205 for a full move to $155-$145
Cheers,
DTD

C (Citi) eyes on $76.14: Golden Covid ready to launch BreakOutC with all banks has recovered to pre-tariff levels.
It has pierced a proven Golden Covid fib at $76.14
Look for a Retest (preferably with a Ping) for entry.

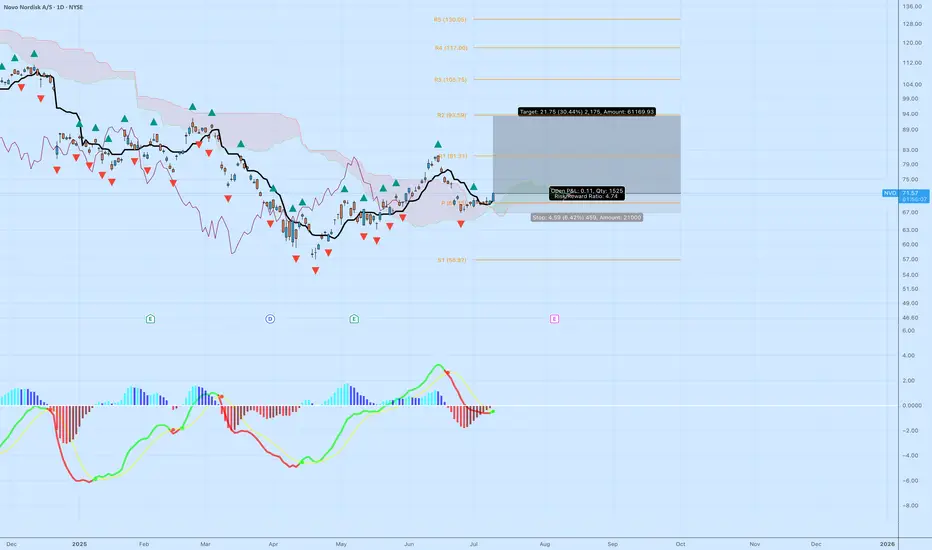
NVO: Trend Continuation With 4.74 R/R SetupNovo Nordisk ( NYSE:NVO ) is showing classic strength — bouncing off the cloud, reclaiming structure, and flashing early signs of momentum rotation. This is how you catch continuation trades without chasing.
📊 Technical Breakdown
Ichimoku: Price reclaimed the top of the cloud and is now building above it. Kijun and Tenkan are aligned. This is the first real bullish structure since the March breakdown.
MACD: Histogram curling upward. We’re not fully bullish yet, but the pressure is shifting back to buyers.
R1 Pivot ($81.31) is the first big test. A clean break above that opens the path toward R2 and beyond.
🎯 Trade Specs
Entry: $71.58
Target: $93.33 (+30.44%)
Stop: $67.00 (–6.42%)
Risk/Reward: 4.74 — elite-level skew for a high-quality name
PLTR: Trend Analysis 📈 PLTR | SMC Trend Continuation or Reversal? Watch This Key Zone
🔍 Chart Type: 15m
🧠 Strategy: Smart Money Concepts (LuxAlgo), EMA Stack (20/50/100/200)
📊 Volume Surge: 177.99K
🧭 Narrative: Institutional Accumulation + Premium Rejection
🚨 Current Price: $145.88
📍 Market Structure:
Price is currently reacting from a Premium Zone just above a recent Break of Structure (BoS).
We've seen a Chg of Character (ChgofCHoCH) and several bullish BoS confirming smart money intent.
Volume expansion at the highs suggests potential liquidity grab.
📐 Key Levels:
Premium Zone near $146
Equilibrium at ~$143
Discount Zone begins near $140
Strong Edge (deep discount) below $138
Long-term Target remains at $165.11 if bullish channel is respected.
📉 Bearish Scenario:
Break below Equilibrium and retest of Discount Zone = liquidity sweep
Watch if price retraces toward $140.10 (blue line) or lower for a higher-probability long.
📈 Bullish Scenario:
Break above current swing high confirms expansion toward $152+ and eventually $165.11
EMA stack remains bullishly aligned → trending continuation likely unless broken with momentum.
🔎 Institutional Insight:
Smart Money is likely building positions below equilibrium before major continuation. Liquidity pockets between $138–$140 are prime zones for potential long entries.
📆 Watchlist Catalyst:
Earnings cycle or Palantir federal contract news could align with breakout.
🧠 VolanX DSS Rating: BULLISH BIAS
✅ Structure: Bullish
✅ Volume: High
✅ Liquidity: Grabbed above recent highs
⛔ Confirmation: Await premium rejection or retrace to discount
—
🔁 Executed via VolanX Scanner + WaverVanir DSS
📊 Trade the future. Protect the edge. Lead with intelligence.
#WaverVanir #PLTR #SmartMoneyConcepts #VolumeProfile #MarketStructure #TechnicalAnalysis #VolanX #InstitutionalTrading #QuantFinance #TradingEdge #PropTrading

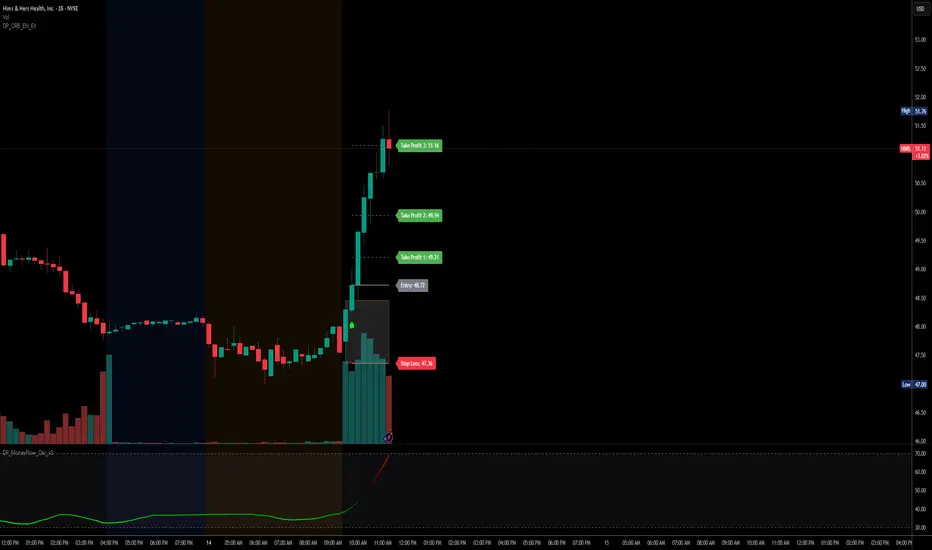
$HIMS - ORBCLEAN breakout for NYSE:HIMS today.
DP_ORB Indicator marked it at candle close outside of ORB Zone, with confirmation bias from a higher high, and volume. All take profits were hit!
If you want the DP_ORB Indicator for FREE:
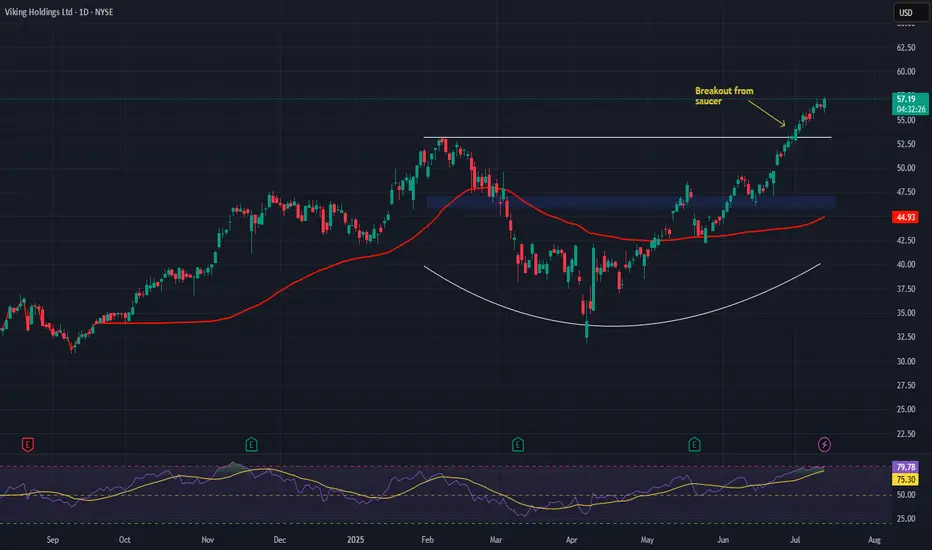
Viking Holdings (VIK) – Sailing Ahead in Luxury TravelCompany Snapshot:
Viking NYSE:VIK is a premium cruise operator targeting affluent retirees and “active agers”, offering adult-only ships and experiential itineraries designed for high-value travelers seeking enrichment and comfort.
Key Catalysts:
Premium Brand with Pricing Power 💰
Unlike many peers, Viking has avoided deep discounting, maintaining premium pricing—a testament to brand equity and customer loyalty, protecting margins amid inflationary pressures.
Exceptional Demand & Occupancy 📈
Occupancy rates consistently above 90% reflect both high demand and strong operational execution, boosting revenue per cruise and signaling long-term customer retention.
Tailwinds from Demographic Trends 👴🏻👵🏻
Viking is uniquely positioned to benefit from the global growth in affluent aging populations, who prioritize experience-driven travel over material consumption.
Investment Outlook:
Bullish Entry Zone: Above $46.00–$47.00
Upside Target: $75.00–$76.00, powered by brand strength, margin durability, and demographic-driven demand.
🛳️ As a leader in luxury cruising, Viking is charting a long-term growth course anchored in loyalty, premium experiences, and generational travel trends.
#VikingCruises #VIK #LuxuryTravel #ExperientialTourism #CruiseStocks #ActiveAgers #RetirementBoom #TravelDemand #PremiumBrand #ConsumerDiscretionary
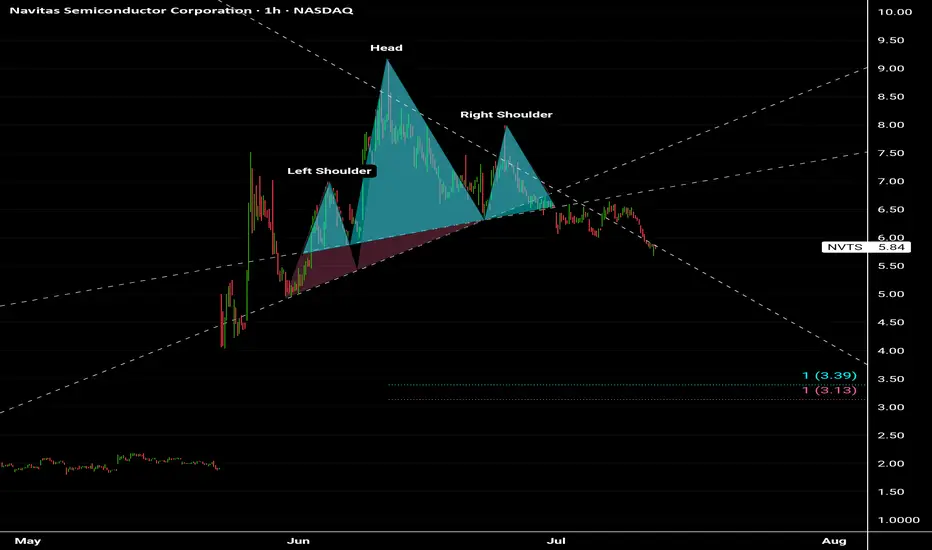
Navitas Semiconductor Corporation NVTS Another Negative Senario in Navitas Semiconductor Stock ...
Head and Shoulders patterns
Target prices between 3.00$ - 3.50$
🤕🤕🤕🤕
Earnings HFT gapsThe gaps that form during earnings season on or the next day after the CEO reports the revenues and income for that past quarter are always HFT driven. The concern over the past 2 previous quarters was the fact that the High Frequency Trading Firms were incorporating Artificial Intelligence into their Algos to make automated trading decisions on the millisecond scale. These small lot orders fill the ques milliseconds ahead of the market open in the US and any huge quantity of ORDERS (not lot size) causes the computers of the public exchanges and market to gap up or gap down, often a huge gap.
This can be problematic for those of you who use Pre Earnings Runs to enter a stock in anticipation of a positive to excellent earnings report for this upcoming quarter.
The HFT algos had several major flaws in the programming that did the opposite: The AI triggered sell orders rather than buy order causing the stock price to gap down hugely on good earnings news.
Be mindful that normal gaps due to a corporate event are far more reliable and consistent.
When you trade during earnings season, be aware that there is still added risk of an AI making a mistake and causing the stock to gap and run down on good news.
It is important to calculate the risk factors until it is evident by the end of this earnings season that the errors within the AI programming have been corrected and that the AI will gap appropriately to the actual facts rather than misinterpreted information.

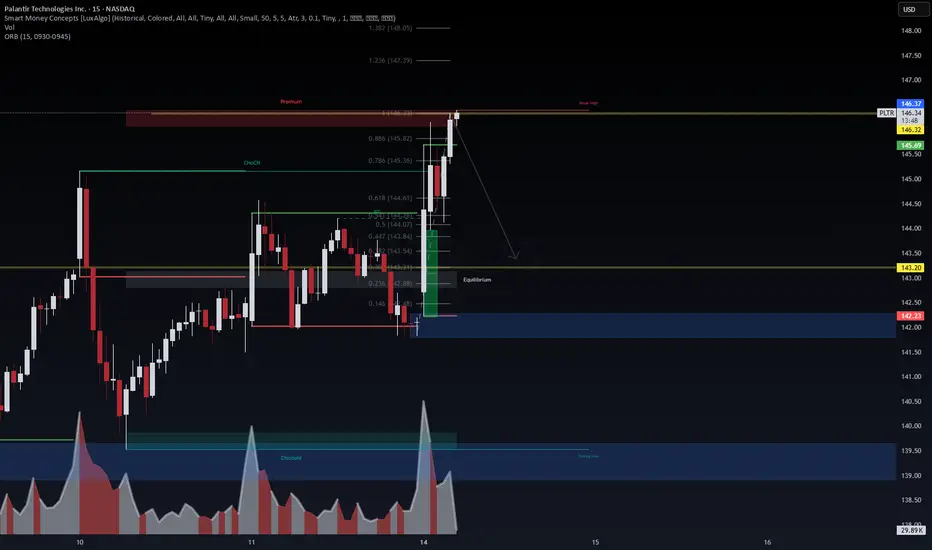
PLTR - Premium Rejection Detected | Bearish Flow Confirms Put🧠 WaverVanir DSS | 15-min SMC x Options Flow x Liquidity
Palantir ( NASDAQ:PLTR ) has just tapped the 0.886–1.0 Fibonacci zone inside the Premium zone near $146.32, where price wicked above the weak high. This aligns with key liquidity exhaustion, suggesting a short-term distribution phase.
Meanwhile, our scanner picked up notable $144 Puts expiring July 18:
🧾 3,500 contracts traded with IV at 80.4%
🔁 Volume > OI → fresh bearish positioning
📉 $2.76 premium → traders paying up to hedge downside risk
🧩 Trade Breakdown:
Price action: Smart Money Premium rejection from $146.32 with reversal wick
Volume: Spike into imbalance zone below $143.20 = next probable draw
Options Flow: Bearish bets on $144 puts line up with chart thesis
ORB (9:30–9:45): High at $145.69, rejected cleanly at structure
🧭 Target Zone: $142.23 (discount block)
🚨 Risk Level: Above $146.50 invalidates short idea
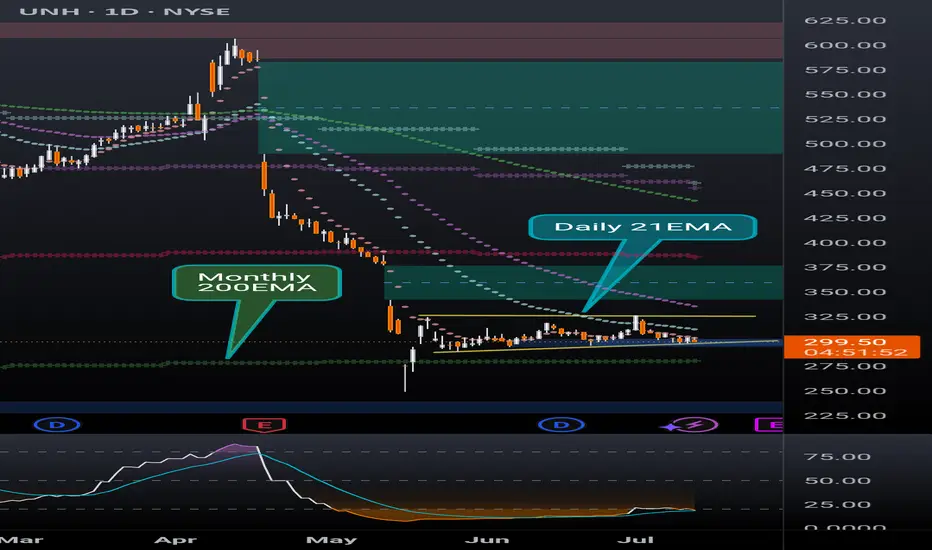
UNH bear flag and gapsUNH has been top of my radar for a bullish reversal. With 2 major gaps to fill after the epic collapse in share price this ticker has a lot of potential. Currently sitting in what appears to be a bear flag, it is holding above the monthly 200EMA (overlayed on this 4H chart). However price recently rejected off the daily 21ema (overlayed on this 4H chart) and if the bear flag is any indicator price may head lower for another liquidity sweep before the inevitable bullish reversal.
A side note: insiders have been buying $millions since the share price collapsed which is always a good indicator of what's to come.
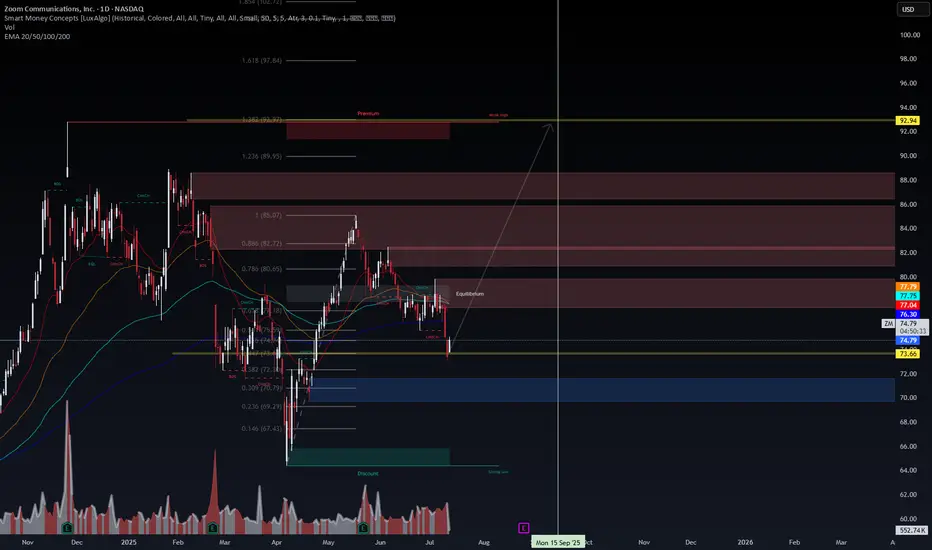
ZM: Okay My time to get paid. If the market wills, my contracts will be in the money! playing some butterflies.
-Sam
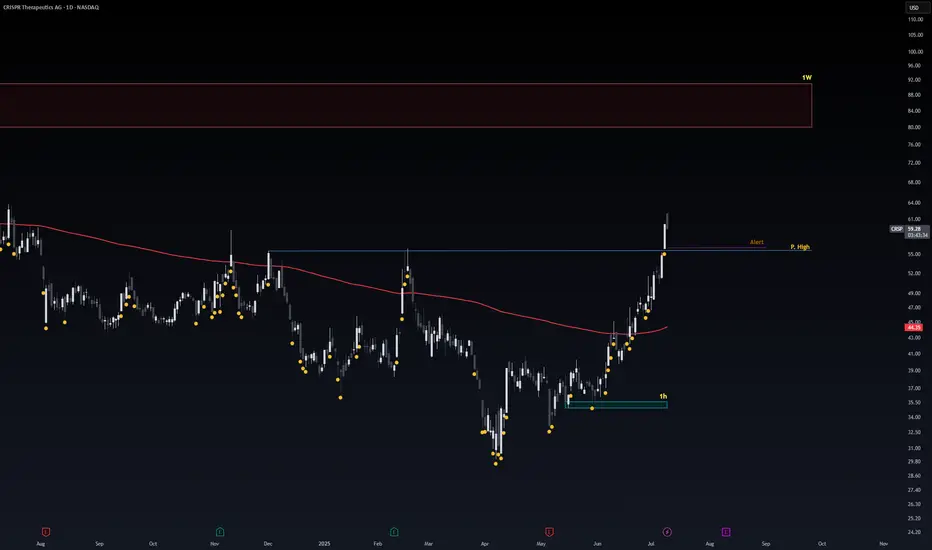
Safe Entry Zone CRSPPrice will Re-test Blue Line.
Blue Line act As Strong Support level now.
Note: 1- Potentional of Strong Buying Zone:
We have two scenarios must happen at The Mentioned Zone:
Scenarios One: strong buying volume with reversal Candle.
Scenarios Two: Fake Break-Out of The Buying Zone.
Both indicate buyers stepping in strongly. NEVER Join in unless one showed up.
2- How to Buy Stock (safe way):
On 1H TF when Marubozu/Doji Candle show up which indicate strong buyers stepping-in.
Buy on 0.5 Fibo Level of the Marubozu/Doji Candle, because price will always and always re-test the
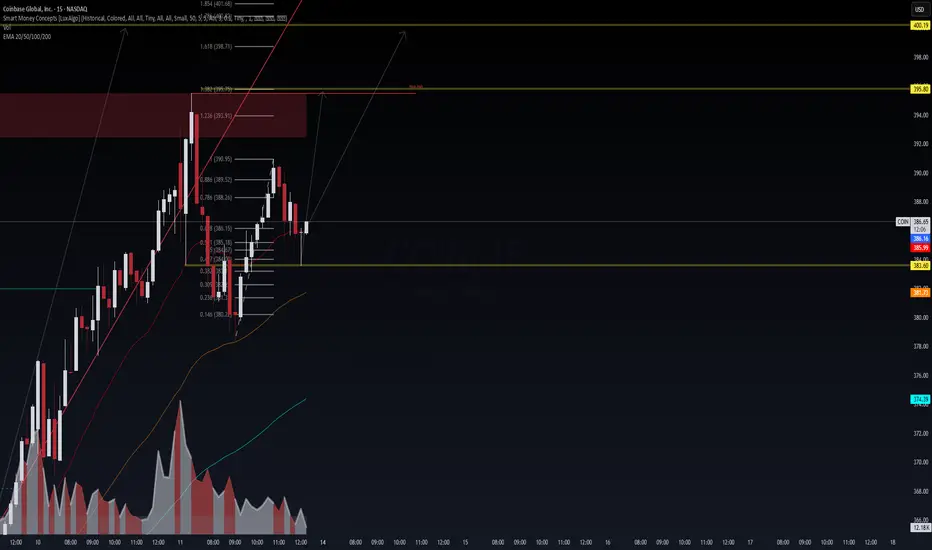
COIN Breakout Loading: Smart Money Reclaim Underway | WaverVanir🚀 COIN Breakout Loading: Smart Money Reclaim Underway | WaverVanir Alpha Alert
NASDAQ:COIN just tapped a deep discount zone, rebounded from the 0.5–0.618 retracement band, and is now reloading liquidity under the previous high.
⚙️ Technical Breakdown:
✅ Fibonacci Golden Pocket (0.618 at $384.67) was respected with strong wick rejections.
🧠 Volume compression hints at algorithmic absorption under $388.
🔴 Red Supply Block @ $393.91–$395.80 is next liquidity target.
🟡 EMA ribbon acting as dynamic support, stabilizing at $381–$382.
🎯 Target Structure:
🚀 Break $388 → blast through $393.91 (1.236) → ignite options gamma toward $400.19
🔥 Your move, institutions. This is the last discount before markup.
💰 Trade Thesis:
Holding 7/11 $387.5C @ 0.71 – Target Sell @ $1,000 per contract.
Time is short. But so is volatility.
One wick above $393.91 can detonate open interest.
🧠 If this reclaims $388 with a strong candle and volume surge, expect FOMO to carry this into the gamma squeeze zone by EOD.
📍 Posted by WaverVanir International LLC – Quant-Fueled Liquidity Engine | VolanX Protocol Alpha Layer
#COIN #Coinbase NASDAQ:COIN #OptionsFlow #GammaSqueeze #LiquidityRaid #SmartMoney #TradingStrategy #SMC #QuantEdge #FibLevel #WaverVanirAlpha #VolanX #BreakoutTrade #VolumeProfile #BuyTheDip #HighConvictionTrade
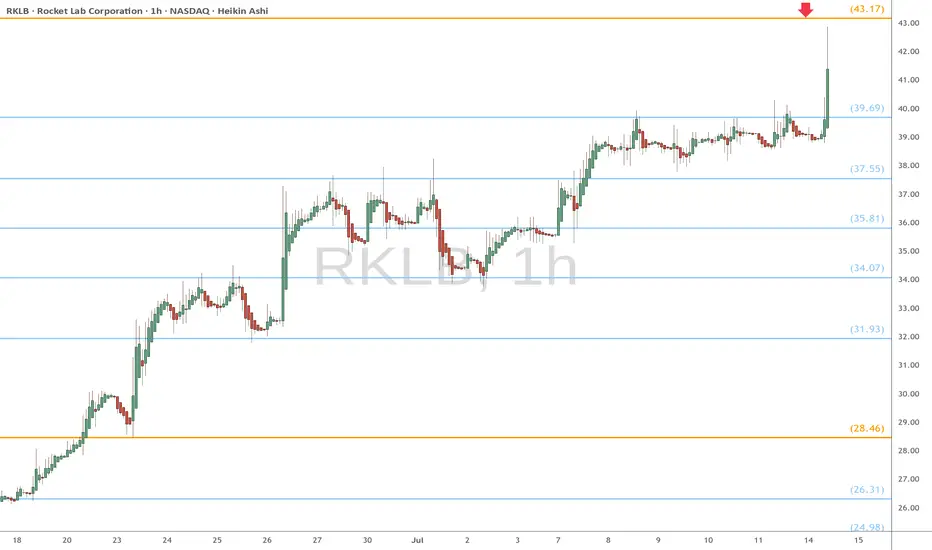
RKLB heads up at $43.17: Golden Genesis fib may knock it downRKLB has been rocketing upward from $4 to $43.
It is about to hit a Golden Genesis fib at $43.17
Expectng a dip from it, or a few orbits at least.
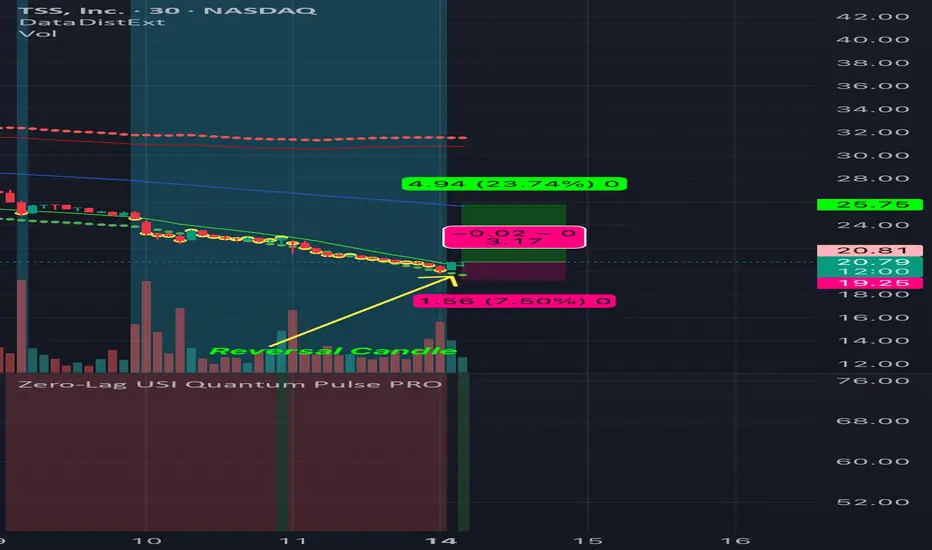
Potential 23% Move in TSSIThere is a high change of reversal in TSSI. This is due to a number of factors:
1. Both the 30min and 150min time frames are showing that the price is overextended to the downside on the custom Data Distribution script. (Yellow dots)
2. The custom USI script has shown a buy signal on the 30min chart. (Background changed to green)
3. There was a good reversal candle on the 30min chart.
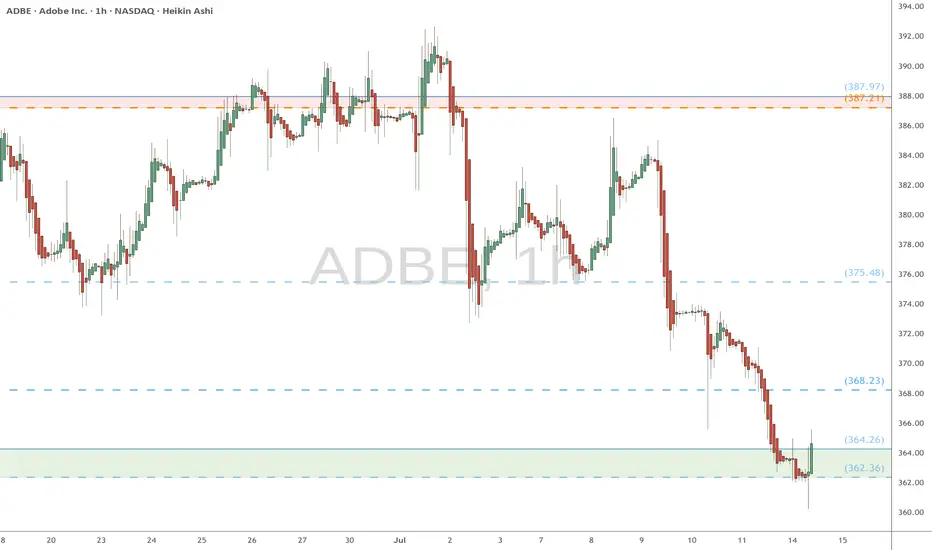
ADBE watch $362-364: Key Support zone must hold to end DownTrendADBE was struggling before last earnings and dumping since.
Currently trying to lift out of a significant support at $362-364
Looking for a Break-n-Retest of zone top Genesis fib at $324.26
.
Apple - The next major push higher!🍎Apple ( NASDAQ:AAPL ) will head for new highs:
🔎Analysis summary :
Apple has been underperforming markets for a couple of months lately. However technicals still remain very bullish, indicating an inherent and substantial move higher soon. All we need now is bullish confirmation and proper risk management and this setup looks very decent.
📝Levels to watch:
$200, $300
🙏🏻#LONGTERMVISION
Philip - Swing Trader

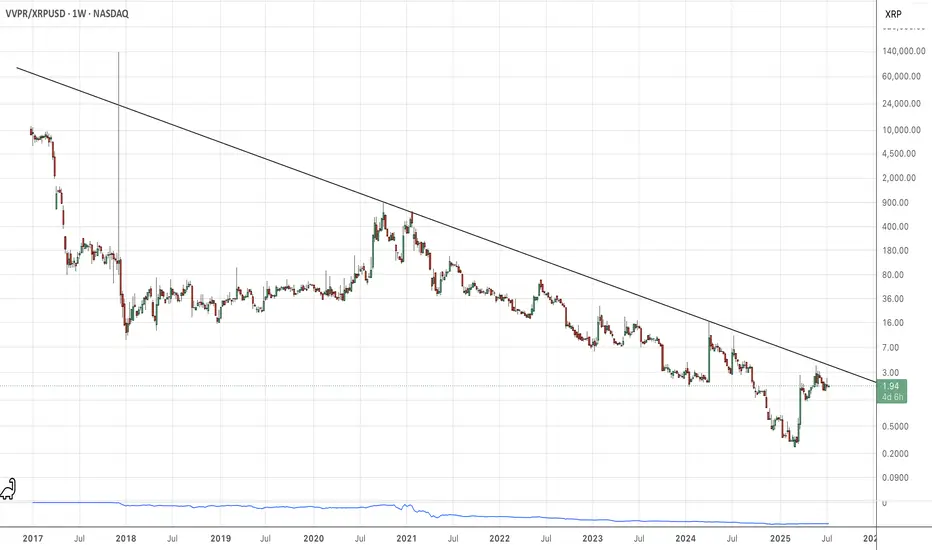
VivoPower/RippleIf you concatenate VVRP/XRP, you can see that Ripple has been outperforming VVRP. But, we have a bunch of touches of the descending overhead, and I bet that VVPR breaks out from the overhead and starts outperforming XRP.