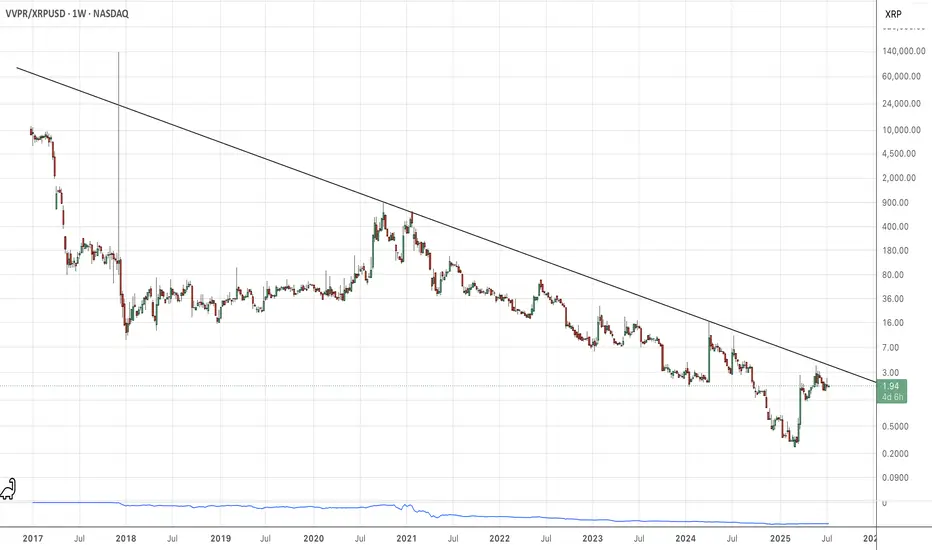
VivoPower/RippleIf you concatenate VVRP/XRP, you can see that Ripple has been outperforming VVRP. But, we have a bunch of touches of the descending overhead, and I bet that VVPR breaks out from the overhead and starts outperforming XRP.
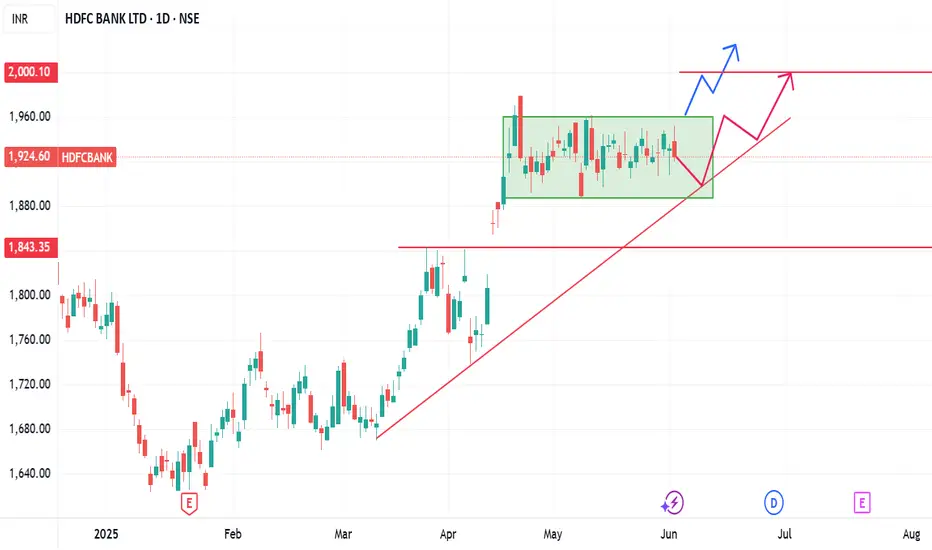
hdfc bank on side way formation hdfc bang today formed a negative pattern can go in consolidation for a while trendline support is good and needs to sustain above it for positive trend hold
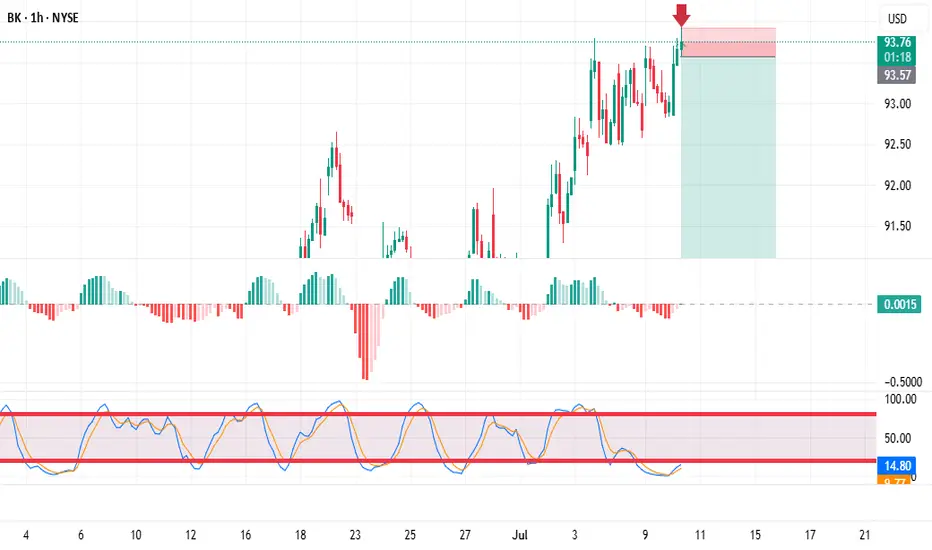
Analyzing and trading stocks using Dr. Elder's Three Screen MethThe first thing I do is analyze the weekly chart. Here I want to see price divergence to the MACD indicator
Next, I go to the daily chart and want to see the divergence between the price and the indicator
I then move to the hourly chart and look for the divergence here.
The price has only risen a couple of points above the previous peak, but that's enough for me. I enter a trade when the bar is broken
NYSE:BK
Micron Technology - Another +50% rally will follow!Micron Technology - NASDAQ:MU - will rally another +50%:
(click chart above to see the in depth analysis👆🏻)
About two months ago Micron Technology perfectly retested a confluence of support. This retest was followed by bullish confirmation, nicely indicating a reversal. So far we saw a rally of +100%, but looking at the channel pattern and previous cycles, another +50% will follow.
Levels to watch: $200
Philip (BasicTrading)
#LONGTERMVISION

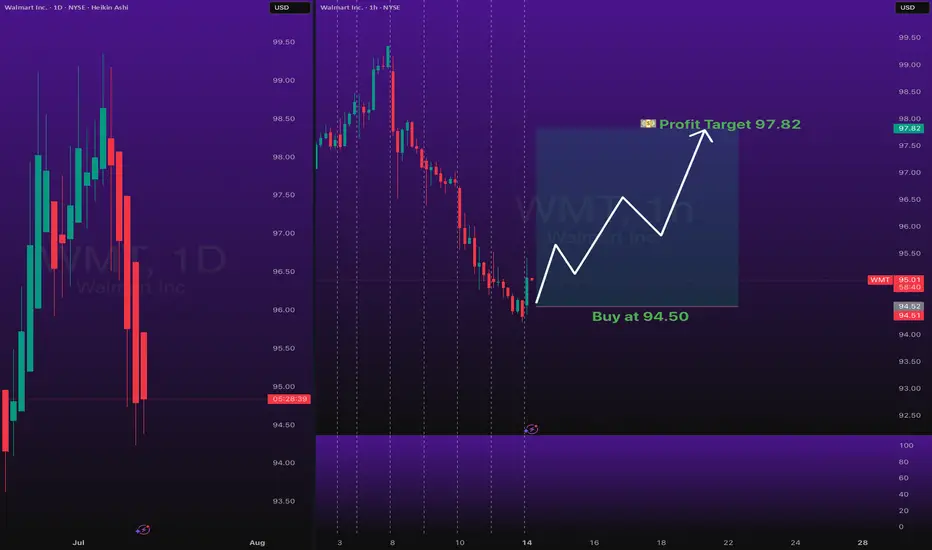
Stocks SPOT ACCOUNT: WMT stocks Buy Trade with Take ProfitStocks SPOT ACCOUNT: NYSE:WMT stocks my buy trade with take profit.
This is my SPOT Accounts for Stocks Portfolio.
Trade shows my Buying and Take Profit Level.
Spot account doesn't need SL because its stocks buying account.
Looks good Trade.
Disclaimer: only idea, not advice
Adobe - A gigantic triangle breakout! 🔋Adobe ( NASDAQ:ADBE ) will break the triangle:
🔎Analysis summary:
Yes, for the past five years Adobe has been overall consolidating. But this consolidation was governed by a strong symmetrical triangle pattern. Thus following the underlying uptrend, there is already a higher chance that we will see a bullish breakout, followed by a strong rally.
📝Levels to watch:
$400, $700
🙏🏻#LONGTERMVISION
Philip - Swing Trader

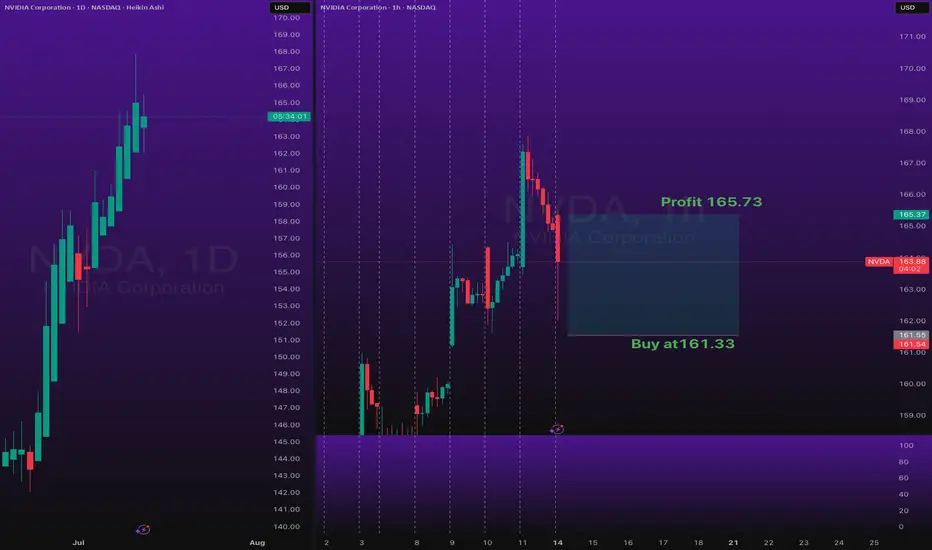
Stocks SPOT ACCOUNT: NVDA stocks Buy Trade with Take ProfitStocks SPOT ACCOUNT: NASDAQ:NVDA stocks my buy trade with take profit.
This is my SPOT Accounts for Stocks Portfolio.
Trade shows my Buying and Take Profit Level.
Spot account doesn't need SL because its stocks buying account.
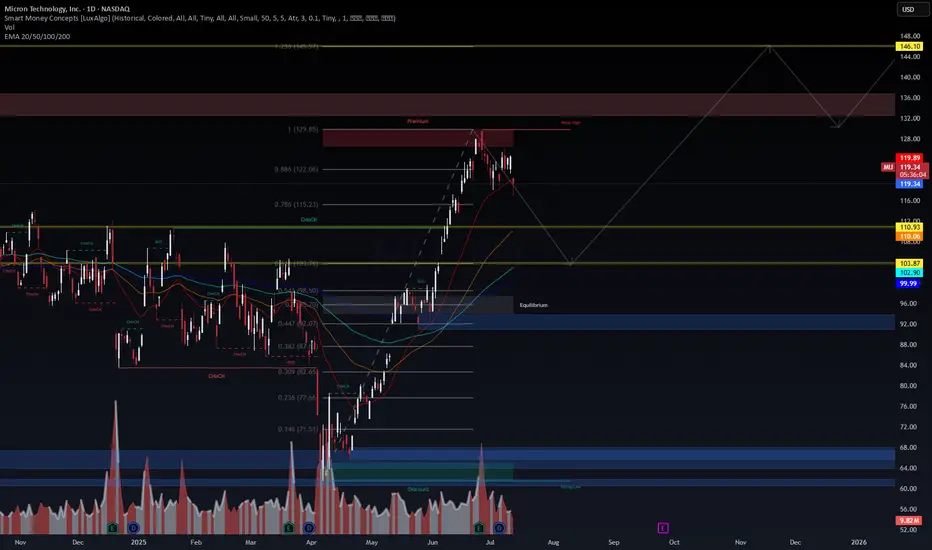
MU - SMC Premium Zone Rejection | Targeting Equilibrium Before E📉 MU - SMC Premium Zone Rejection | Targeting Equilibrium Before Expansion
🔍 WaverVanir DSS Framework | SMC x Fibonacci x Liquidity
We just observed rejection from the Premium zone and 0.886 Fibonacci retracement near $129.85, aligning with prior weak high liquidity. Price has shown signs of distribution, with a likely retracement to the Equilibrium zone ($98–$103) before any bullish continuation.
🧠 Key Observations:
ChoCH confirmed post-run to premium → Expect redistribution
Price rejected 0.886 (122.06) and weak high near 129
Strong EMA confluence forming around 110–103 range
Equilibrium zone and volume spike near $98–$103 offers valid demand
Long-term target remains open toward Fib extension @ $146.10, but only after deeper retrace
📉 Short Bias Until $103–$98 Demand Zone
🔁 Then flip long if bullish confirmation appears
📊 VolanX Market View:
Structure: Breaker → ChoCH → Premium Rejection
Bias: Retracement → Reaccumulation
Tools Used: Smart Money Concepts, Fib, Volume, EMA stack, Liquidity zones
🧠 Built using the WaverVanir DSS, designed to navigate institutional flows and macro-infused setups. We’re tracking this sequence closely across cycles.
📅 Chart Date: July 14, 2025
📍 Asset: NASDAQ:MU (Micron Technology Inc.)
💬 Follow @WaverVanir for macro-aware, alpha-focused setups.
📈 Disclaimer: Not financial advice. Educational content only.
#SMC #OptionsFlow #FibLevels #LiquidityZones #WaverVanir #VolanX #TradingView #MU #Micron #TechStocks #InstitutionalTrading #VolumeProfile #ChoCH #Equilibrium #SmartMoney
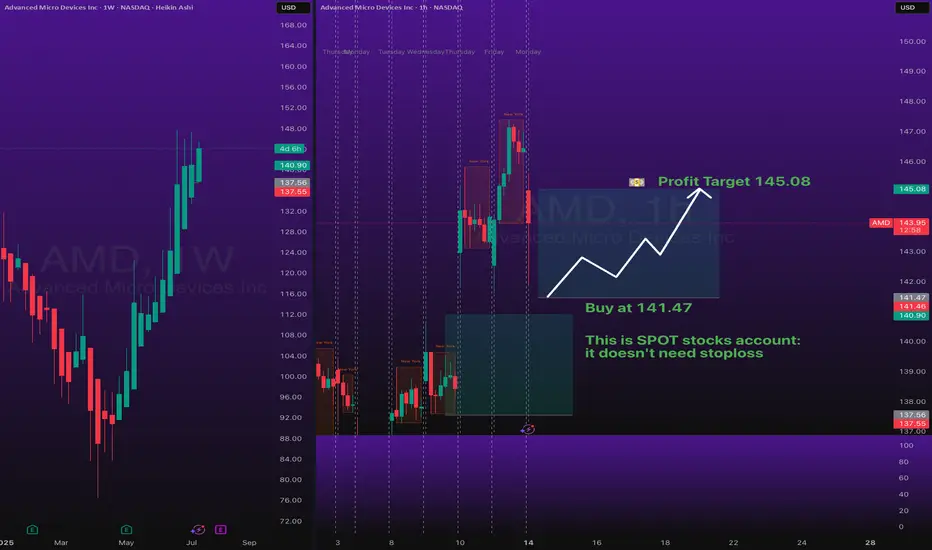
Stocks SPOT ACCOUNT: AMD stocks buy trade with take profitStocks SPOT ACCOUNT: NASDAQ:AMD stocks my buy trade with take profit.
This is my SPOT Accounts for Stocks Portfolio.
Trade shows my Buying and Take Profit Level.
Spot account doesn't need SL because its stocks buying account.
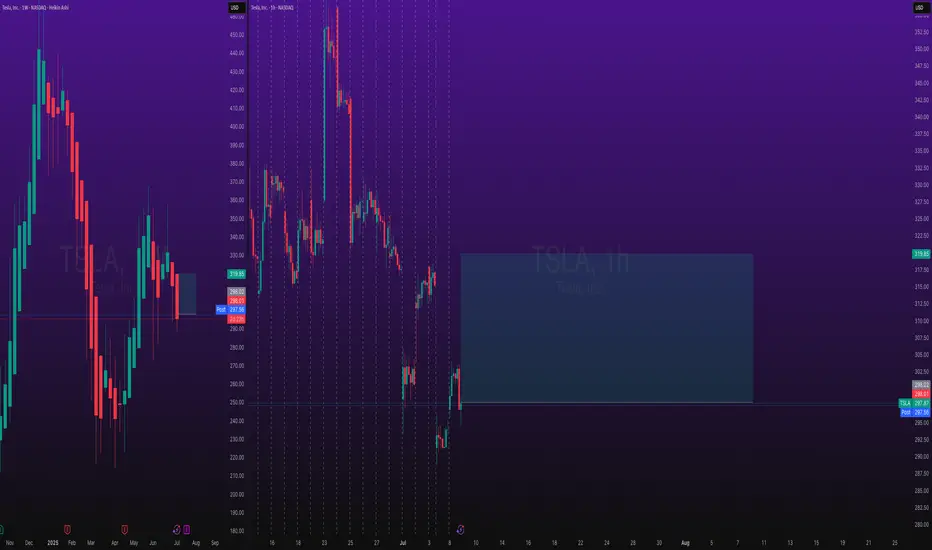
Stocks SPOT ACCOUNT: TESLA stocks buy trade with take profitStocks SPOT ACCOUNT: MARKETSCOM:TESLA stocks my buy trade with take profit.
Buy Stocks at 297 and Take Profit at 319.
This is my SPOT Accounts for Stocks Portfolio.
Trade shows my Buying and Take Profit Level.
Spot account doesn't need SL because its stocks buying account.
BABA longPotential double bottom to be formed on the Weekly TF.
I think well into Aug and Sept, this will mature.
$143 is a key price value zone.

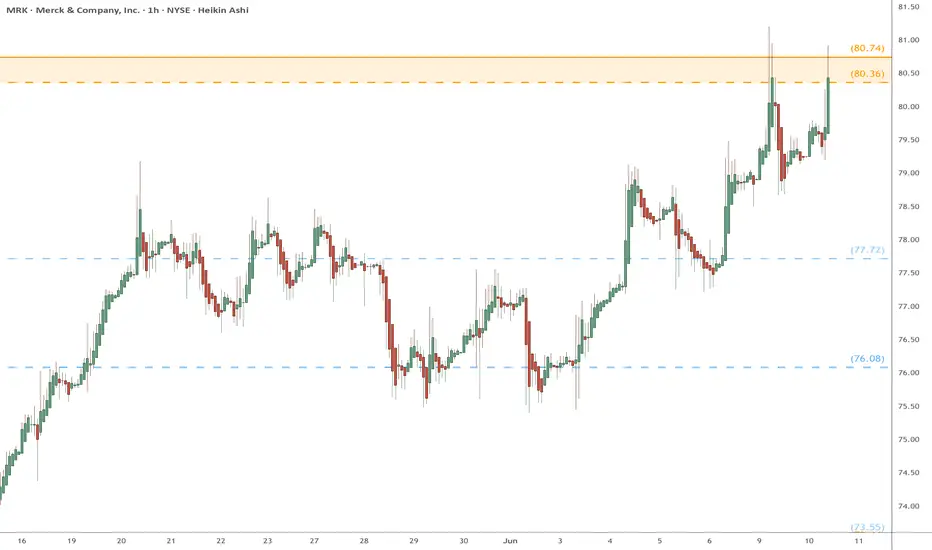
MRK eyes on $80.36/74: Double Golden zone break to end DownTrendMRK and all pharma has been dropping forever.
Just pierced the Double Golden zone yet again.
Break and Hold of this zone will say "bottom".
.
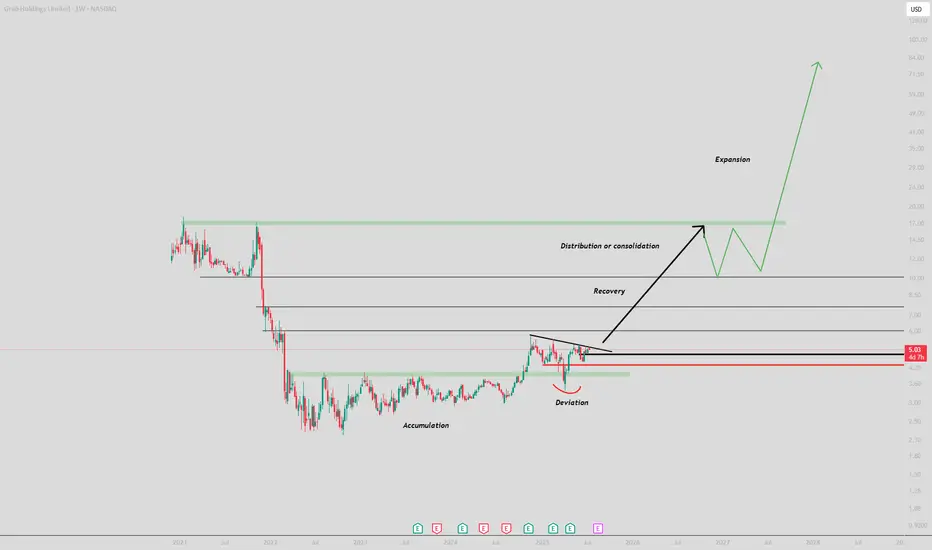
GRAB : They grab your moneyHello
Fine ?
Me no and yes, or ?
What is Grab ? = Like UBER but in ASIA.
Let's go to ATH, Probably.
Enter when the actual consolidation is destroy by the up in weekly.
Don't be greedy. Stay patient.
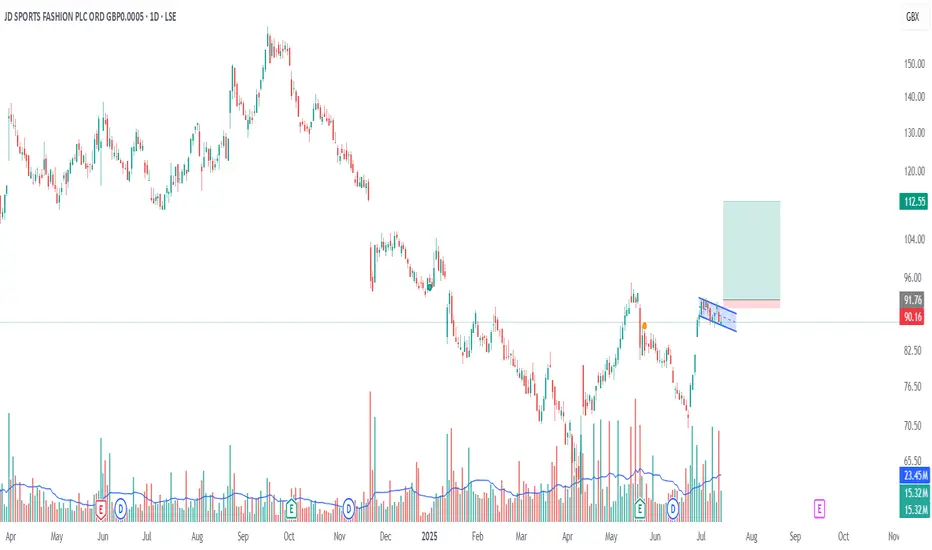
Bull Flag Formation on the Daily ChartA bull flag pattern is forming on the 1-day chart, supported by a steady increase in volume—suggesting growing bullish momentum.
Flagpole base: ~72
Potential breakout level: ~92
First price target (PT1): ~100 (next key resistance level)
Measured move target (PT2): ~112 (based on flagpole height)
This setup indicates a strong potential for continuation if price breaks above the 92 level with volume confirmation.
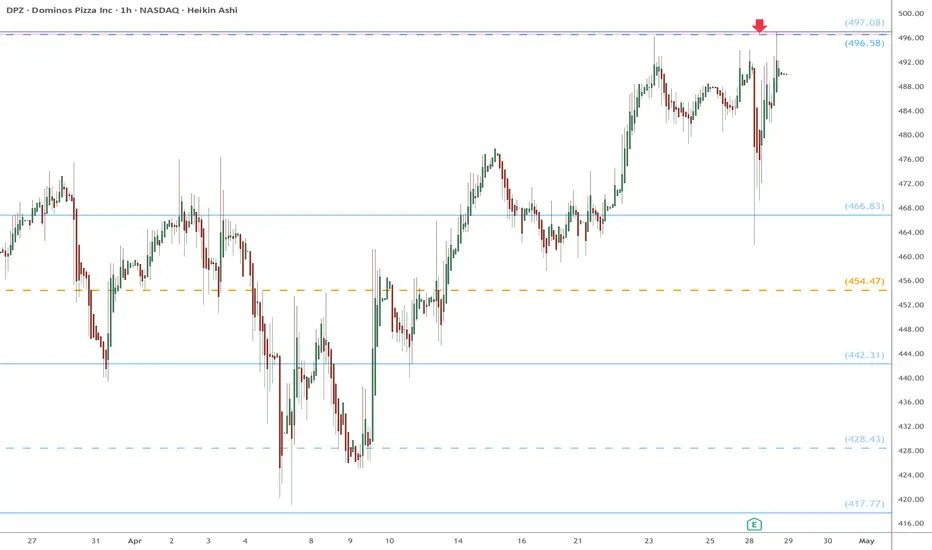
DPZ watch $496/497: Double Fib resistance to possible new ATHDPZ has been range bound for a while.
Up against a double fib barrier into earnings.
Look for reject or break of $296.58-497.08
$MSTR: Long term bullish trendNASDAQ:MSTR long term signal triggered...
Up trend in monthly scale until end of 2025.
Heard it here first, lads.
Best of luck!
Cheers,
Ivan Labrie.

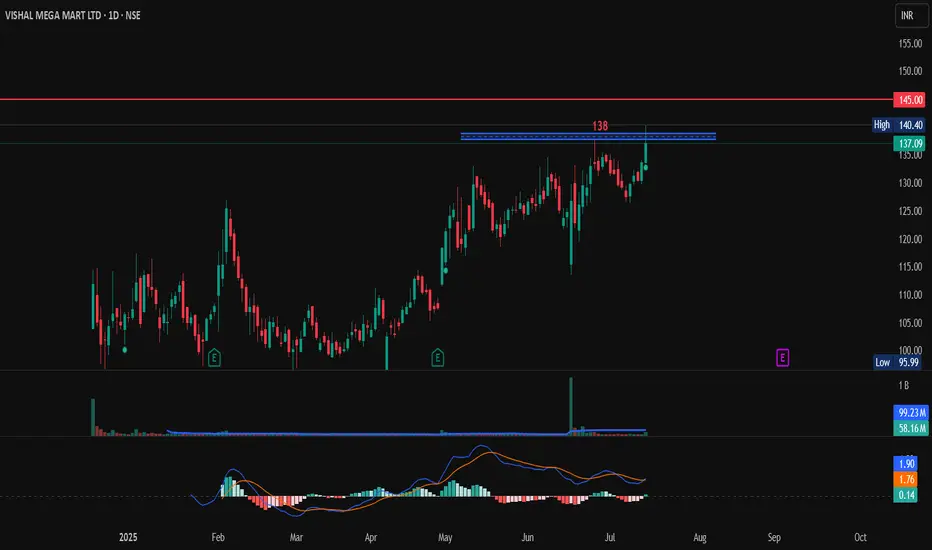
Vishal Mega Mart Long TradeVishal Mega Mart has broken it all time high of 137, but it was unable to sustain it close just below it. If is breaks the 138 mark it can easily to till 145 in next 10 sessions (2 weeks).
Enter above 138 on bullish candle pattern.
Target 145
SL 135
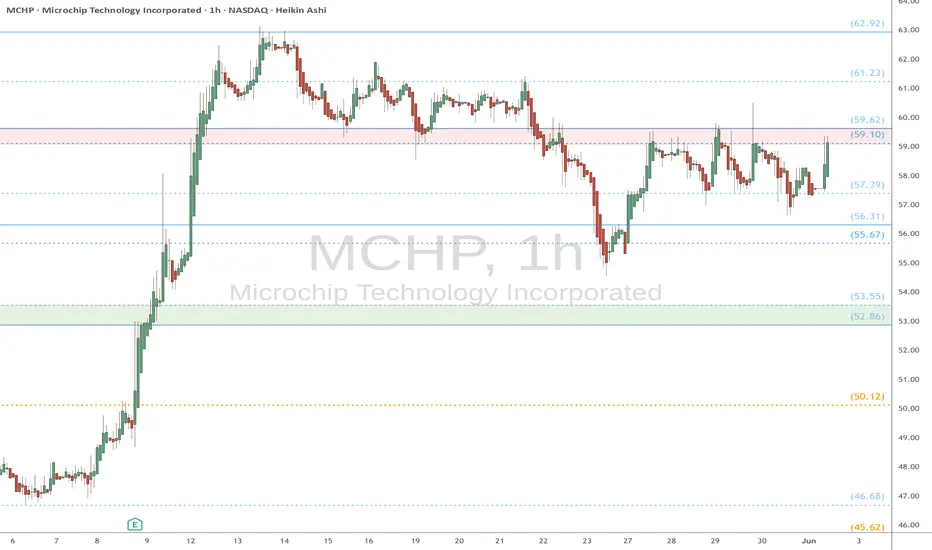
MCHP watch $59.xx: Proven Resistance break could POP stronglyMCHP trying to recover along with the Chip sector.
Now testing a well proven resistance $59.10-59.62
Looking for a Break-and-Retest of zone to enter long.
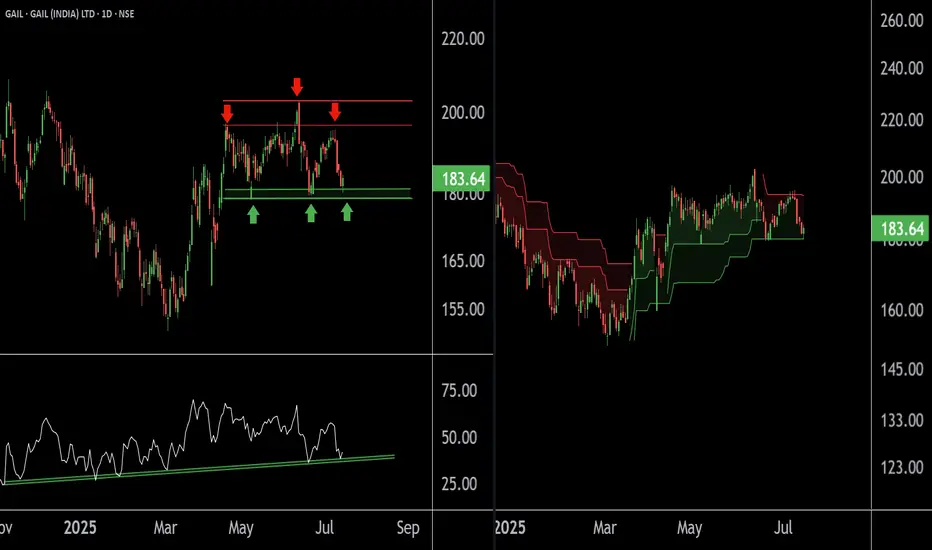
GAIL at Best Support zone !! There are two chart of Gail on Daily timeframe.
On the first chart Gail is moving in well defined parallel channel with support near at 178-180 zone.
Daily RSI is also taking support and bouncing back, indicating a revival in short-term momentum and strengthening the overall bullish setup.
On the second chart , the stock is bouncing from the supertrend support around ₹180, reinforcing bullish sentiment. However, on the shorter timeframe, the supertrend indicator is acting as resistance near ₹192, which needs to be breached for further upside continuation.
Thank You !!
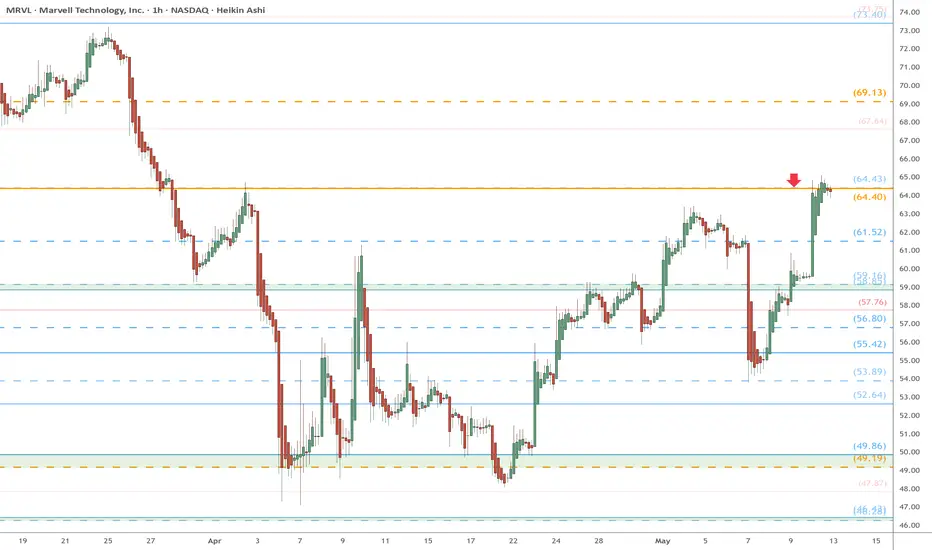
MRVL watch $64.40/43: proven Double Fib holding up the recovery MRVL trying to recover with the chip sector.
Up against a proven Double Fib at $64.40/43.
Look for a Dip-to-Fib or Break-n-Retest entry.
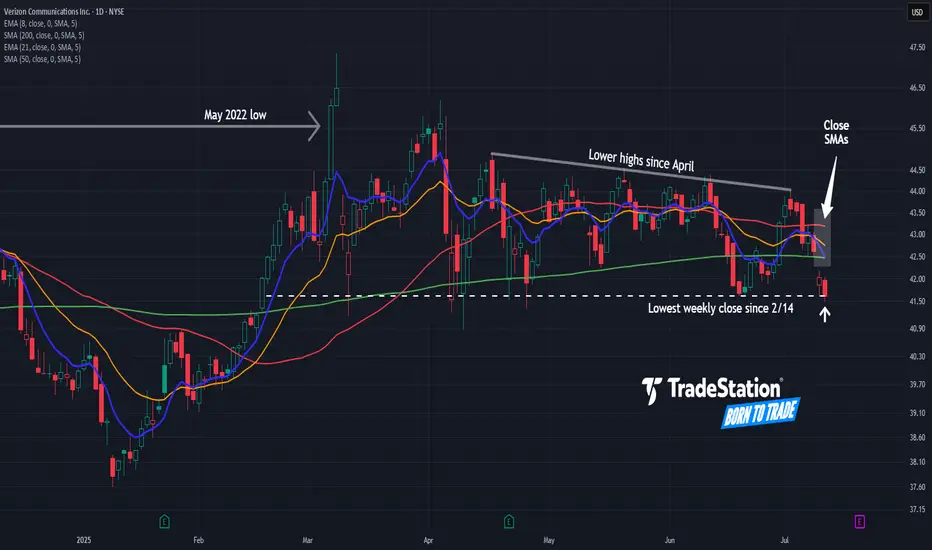
Verizon May Be Rolling OverVerizon Communications has been rangebound for more than a year, and now some traders could think it’s rolling over.
The first pattern on today’s chart is the May 2022 low of $45.55. VZ fell below that level in late 2022 and rebounded to it by mid-2024. The stock has been stuck below the same level since, including a rejection in March. Has old support become new resistance?
Second, prices have slipped below the 50- and 200-day simple moving averages (SMAs). The two SMAs are also close to each other. Those points may reflect weakening longer-term trends.
Third, the telecom stock has made lower highs since April -- even as the broader market broke out to new all-time highs.
Next, VZ just had its lowest weekly close since February. The 8-day exponential moving average (EMA) is also below the 21-day EMA. Those points may suggest that bearishness is taking hold in the short term.
TradeStation has, for decades, advanced the trading industry, providing access to stocks, options and futures. If you're born to trade, we could be for you. See our Overview for more.
Past performance, whether actual or indicated by historical tests of strategies, is no guarantee of future performance or success. There is a possibility that you may sustain a loss equal to or greater than your entire investment regardless of which asset class you trade (equities, options or futures); therefore, you should not invest or risk money that you cannot afford to lose. Online trading is not suitable for all investors. View the document titled Characteristics and Risks of Standardized Options at www.TradeStation.com . Before trading any asset class, customers must read the relevant risk disclosure statements on www.TradeStation.com . System access and trade placement and execution may be delayed or fail due to market volatility and volume, quote delays, system and software errors, Internet traffic, outages and other factors.
Securities and futures trading is offered to self-directed customers by TradeStation Securities, Inc., a broker-dealer registered with the Securities and Exchange Commission and a futures commission merchant licensed with the Commodity Futures Trading Commission). TradeStation Securities is a member of the Financial Industry Regulatory Authority, the National Futures Association, and a number of exchanges.
Options trading is not suitable for all investors. Your TradeStation Securities’ account application to trade options will be considered and approved or disapproved based on all relevant factors, including your trading experience. See www.TradeStation.com . Visit www.TradeStation.com for full details on the costs and fees associated with options.
Margin trading involves risks, and it is important that you fully understand those risks before trading on margin. The Margin Disclosure Statement outlines many of those risks, including that you can lose more funds than you deposit in your margin account; your brokerage firm can force the sale of securities in your account; your brokerage firm can sell your securities without contacting you; and you are not entitled to an extension of time on a margin call. Review the Margin Disclosure Statement at www.TradeStation.com .
TradeStation Securities, Inc. and TradeStation Technologies, Inc. are each wholly owned subsidiaries of TradeStation Group, Inc., both operating, and providing products and services, under the TradeStation brand and trademark. When applying for, or purchasing, accounts, subscriptions, products and services, it is important that you know which company you will be dealing with. Visit www.TradeStation.com for further important information explaining what this means.
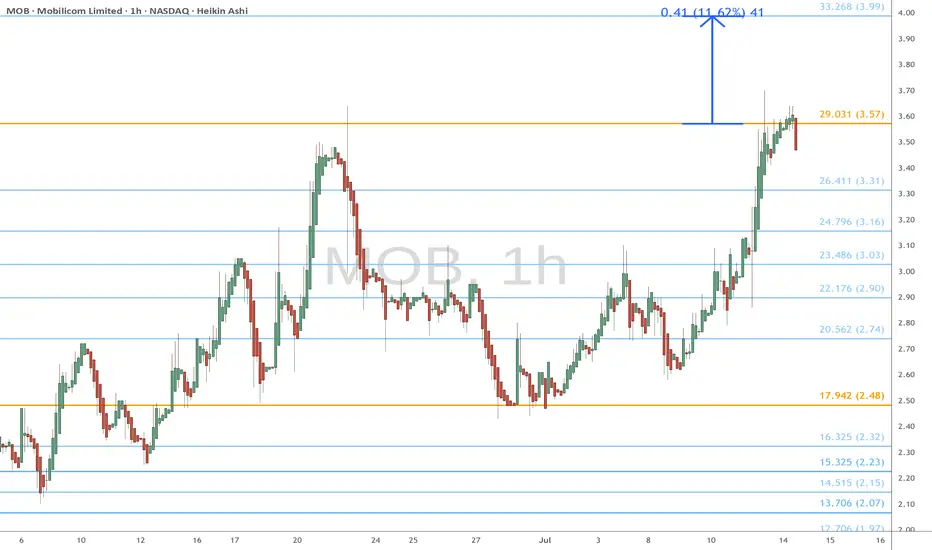
MOB eyes on $3.57: Break should POP and run OR Double TopMOB with a nice recovery from much needed retrace.
Once again testing the proven Golden Genesis fib at $3.57
If/when it breaks it should be a quick pop and then some.
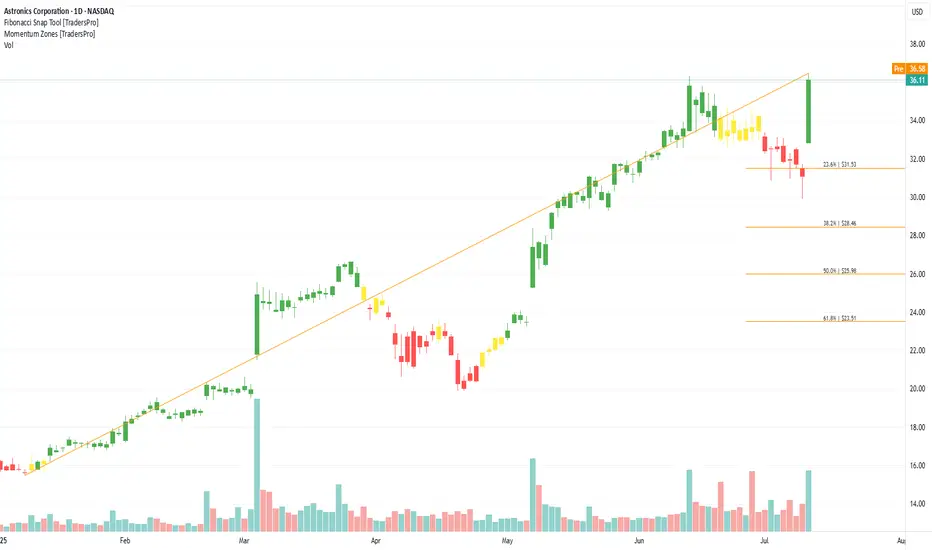
Astronics Corporation (ATRO) Powers Aircraft SystemsAstronics Corporation (ATRO) designs and manufactures advanced technologies for the aerospace, defense, and electronics industries. Its products include in-flight power systems, lighting, connectivity, and testing equipment used in both commercial and military applications. Astronics’ growth is driven by increasing air travel, modernization of aircraft systems, and rising defense spending that supports demand for mission-critical components.
On the chart, a confirmation bar with rising volume highlights strong buying momentum. The price has entered the momentum zone after breaking above the .236 Fibonacci level. A trailing stop can be placed just below that level using the Fibonacci snap tool to lock in gains while allowing for further upside.