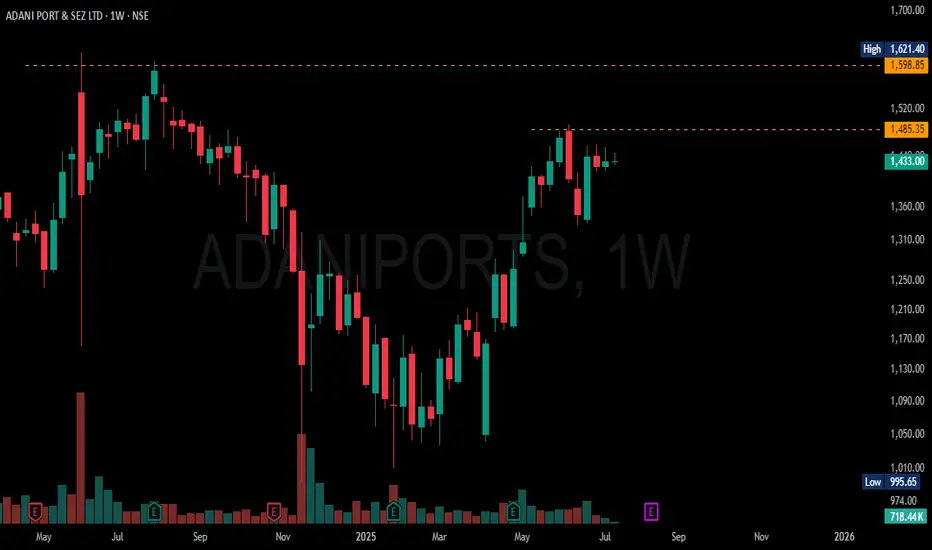
ADANIPORTS READY TO GOADANIPORTS is almost ready to break its nearest high and there after in the making of new high, as the volume feature shows investors are holding tight no sellers left, so there is short supply.
Btcm long position Btcm 5day 1week stocks and Rsi in favor
1hr time frame shows a flag and hidden bullish divergence in my humble opinion 🎇

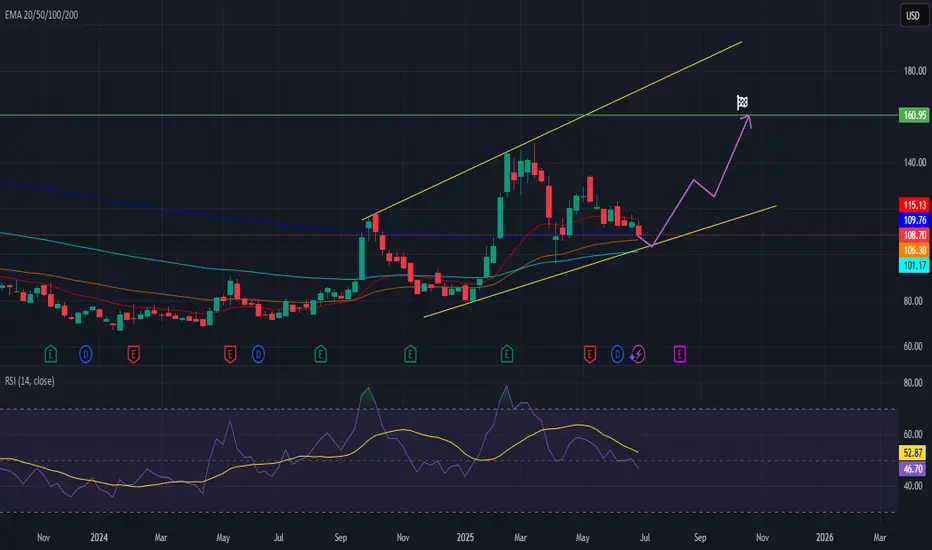
BABA – Dollar Cost Averaging Opportunityhi Traders,
Let's have a look at BABA.
Alibaba (BABA) appears to be approaching the end of its correction phase within a well-defined ascending channel. Based on the current price action and technical setup, we believe now is a good time to begin dollar cost averaging into this stock.
Our identified buy zone lies between $108 and $100, where price intersects the lower trendline support and key EMAs (20/50/100/200). This area offers a strong risk-reward setup for medium- and long-term investors.
The mid-term target for this trade is $160, which aligns with the upper channel resistance and previous price structure. However, from a long-term perspective, we anticipate that BABA will resume its growth trajectory and eventually surpass its previous all-time highs.
Supporting this idea, the RSI is stabilizing in neutral territory, suggesting that momentum is resetting and may shift bullish as price finds support.
Summary:
🔁 Strategy: Dollar cost averaging
🟩 Buy zone: $108 – $100
🎯 Mid-term target: $160
🚀 Long-term view: Return to growth and new ATH
📉 Correction nearing completion; bullish structure remains intact
This setup offers an attractive entry point for patient investors aiming to ride the next major upside cycle in Alibaba.
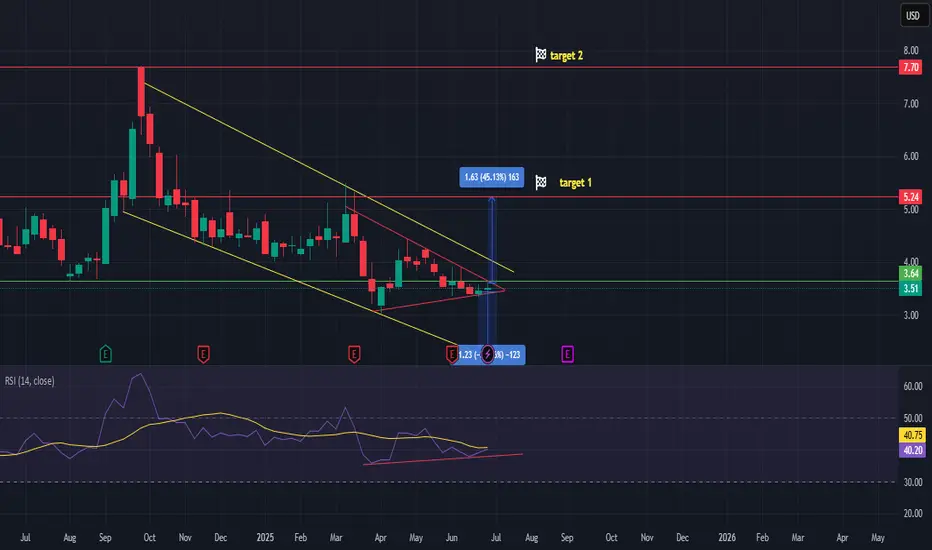
NIO – Breakout Approaching from Apexhi Traders
How are you today? Do you like NIO stock today?
The price of NIO is currently sitting right at the apex of a narrowing wedge, indicating that a decisive breakout is likely imminent. This technical formation has been building for months, and the price has now tightened into a point where volatility and direction are expected to return soon.
The RSI (Relative Strength Index) is showing bullish signs, with an upsloping structure despite the sideways price action, which suggests growing bullish momentum under the surface. This hidden strength adds confidence to a potential bullish breakout.
We’ve identified two key upside targets for the bulls:
🎯 Target 1: $5.24 — a 45% move from current levels
🎯 Target 2: $7.70 — previous resistance and a major psychological level
However, on the flip side, if the price breaks down from this pattern instead of up, we could see NIO revisit levels as low as $2.20, which would delay the bullish scenario significantly and potentially extend the consolidation phase.
Summary:
🔺 At apex of wedge pattern — breakout expected soon
📈 RSI is bullish and rising, indicating potential strength
🎯 Bullish targets: $5.24 and $7.70
⚠️ Bearish breakdown risk: Downside to $2.20
Traders should watch for a confirmed breakout or breakdown before entering, as momentum can accelerate quickly once direction is established.
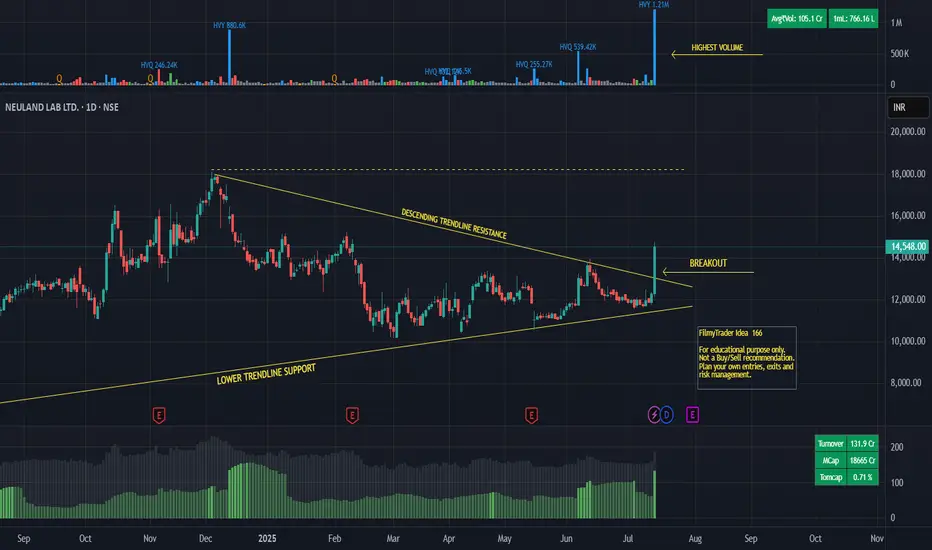
Neuland Lab - Trendline BreakoutNEULAND LABORATORIES LTD.
Breakout from trendline resistance on daily timeframe.
Breakout with heavy volume.
Close crossing last week high.
Increasing relative strength.
Disclaimer:
For educational purpose only.
Please do your own research before taking any trades.
Happy Trading!
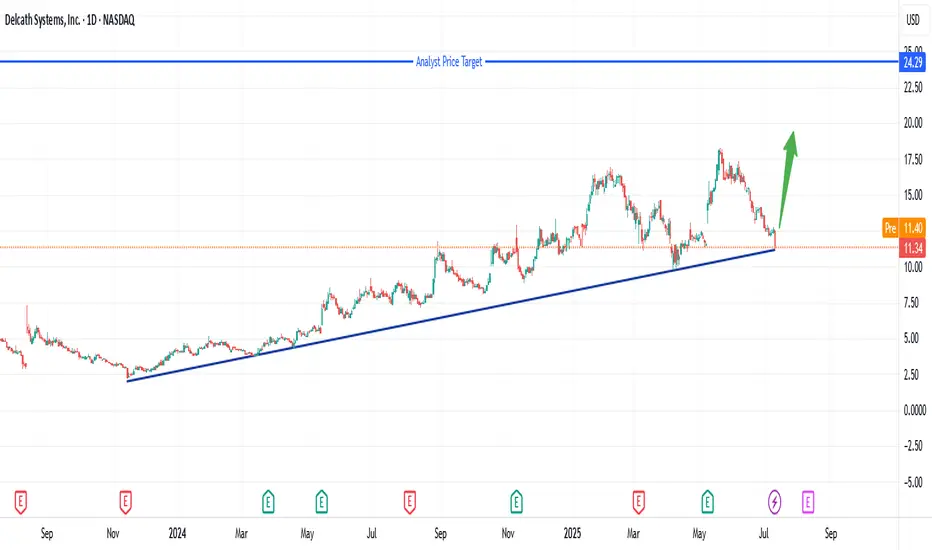
Explosive Rebound: Delcath at Critical Support Zone!Delcath Systems (DCTH) has pulled back to a key long-term support trendline after a sharp correction, presenting an exciting opportunity for a powerful rebound. The stock has respected this rising support for over a year, and buyers have historically stepped in at this level.
With the analyst price target set much higher at $24.29, risk/reward here is highly attractive. A confirmed bounce could ignite strong momentum toward previous highs and beyond. I’m watching closely for bullish price action and increased volume to signal entry. Stop placement should be just below the trendline to manage risk.
Not financial advice—always use proper risk management and do your own research!
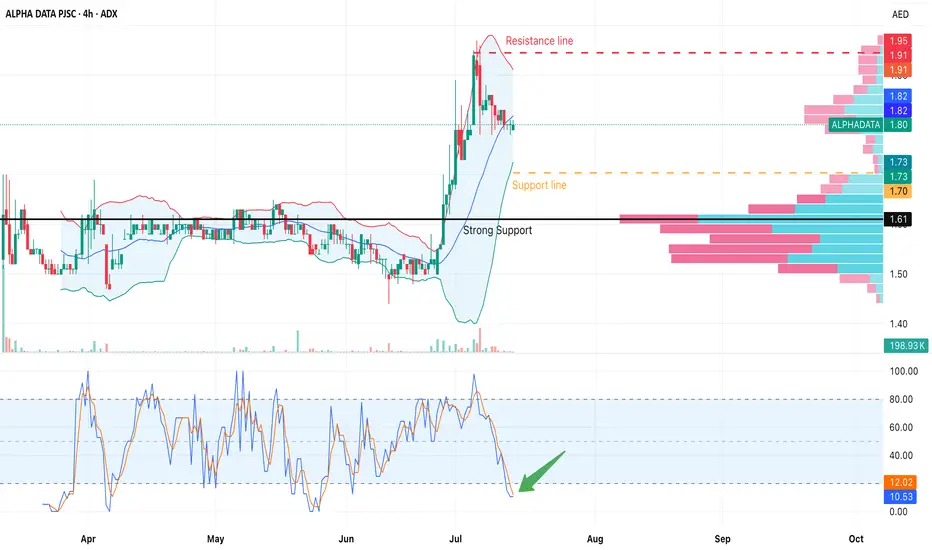
Overview: Alpha Data PJSC (ALPHADATA, ADX)Sector: IT & Digital Solutions | Location: UAE
🔹 New to the stock market — but not to the business
ADX:ALPHADATA is one of the largest IT companies in the UAE. It went public very recently — in May 2025 — but has been operating for over 40 years (founded in 1981). The company provides solutions in digital transformation, cloud computing, cybersecurity, and IT services.
What makes it especially attractive is its client base, which includes some of the UAE’s most prominent organizations:
• ASX:ADNOC , ADX:TAQA , ADX:EAND , Emirates, Etihad, DP World, Dubai Police, ADX:FAB
• These names represent the core of the UAE’s economy and government sector — large, reliable, and financially stable partners.
The digital and cybersecurity sector continues to grow rapidly, particularly in GCC countries where government-led digital transformation is accelerating. This makes Alpha Data’s business both relevant and resilient in today’s geopolitical and technological climate.
📉 Technical analysis: is the entry point near?
The chart shows that after the IPO, the price reached the 1.90–1.95 AED zone before undergoing a correction.
Currently, the price is holding around 1.78–1.80 AED, with the main volume area (POC) located at 1.61 AED — a strong support level.
Indicators suggest:
• RSI and Stoch RSI are in the oversold zone — signaling a potential reversal.
• The Volume Profile confirms that the price is still above key volume areas.
🟩 Bullish scenario:
• Holding above 1.70–1.75 AED → bounce toward the 1.90–1.95 zone is possible.
• A breakout above this range could open the way toward 2.00+.
🟥 Bearish scenario:
• A breakdown below 1.70 AED could lead to a retest of 1.61 AED, which may offer another long opportunity.
✳️ Why I’m interested in this stock:
• ✅ Recent IPO — the market is still forming its long-term view.
• ✅ Strong sector (IT, cybersecurity, digital transformation).
• ✅ Top-tier clients — from ADNOC to Etisalat.
• ✅ Rare dividend story: the company has already announced plans to pay dividends twice a year,
with an expected yield of 8–9% (based on the IPO price). Of course, the amount depends on profitability,
but the fact itself is unusual for a tech company in this region.
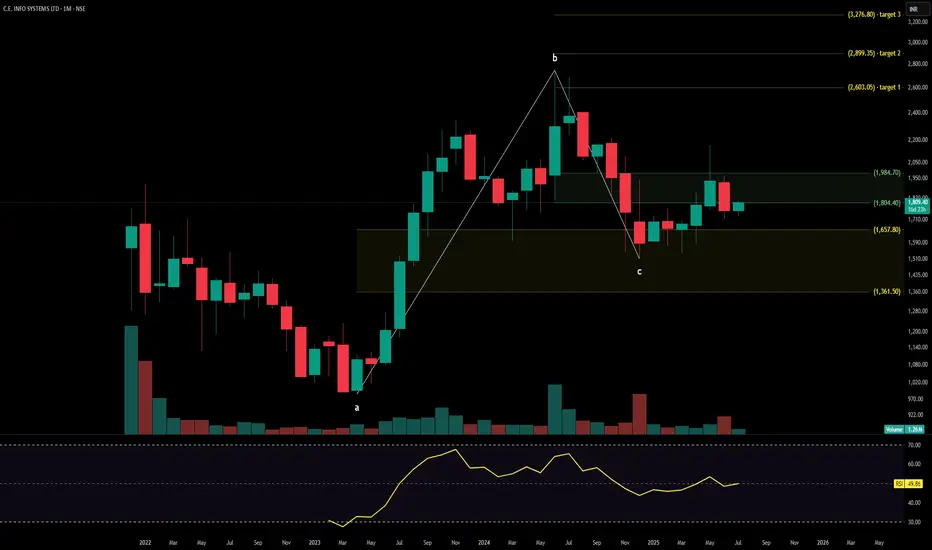
MAP MY INDIAC.E. Info Systems Ltd., operating under the brand MapmyIndia, is a leading geospatial SaaS and digital mapping company offering AI-powered mobility platforms, navigation tools, and automotive-grade telematics solutions. It serves marquee clients in automotive, logistics, government, and e-commerce verticals. The stock is currently trading at ₹1,804.40 and is forming a base post-correction, with early signs of trend reemergence supported by volume and Fibonacci alignment.
C.E. Info Systems Ltd. – FY22–FY25 Snapshot Sales – ₹215 Cr → ₹264 Cr → ₹314 Cr → ₹360 Cr – Consistent growth driven by SaaS subscriptions and automotive partnerships Net Profit – ₹89.3 Cr → ₹103.5 Cr → ₹116.2 Cr → ₹129.4 Cr – Steady margin profile with scalable revenue mix Company Order Book – Moderate → Strong → Strong → Strong – Expanding pipeline in mobility platforms and GIS services Dividend Yield (%) – 0.00% → 0.00% → 0.00% → 0.00% – No payouts, focused on reinvestment Operating Performance – Moderate → Strong → Strong → Strong – SaaS leverage driving operating margins Equity Capital – ₹10.71 Cr (constant) – Lean and efficient capital structure Total Debt – ₹0 Cr (debt-free) – Conservative balance sheet Total Liabilities – ₹185 Cr → ₹192 Cr → ₹204 Cr → ₹217 Cr – Stable, aligned with business scale Fixed Assets – ₹62 Cr → ₹68 Cr → ₹72 Cr → ₹78 Cr – Light capex structure supporting software stack
Latest Highlights FY25 net profit rose 11.4% YoY to ₹129.4 Cr; revenue increased 14.6% to ₹360 Cr EPS: ₹12.08 | EBITDA Margin: 31.2% | Net Margin: 35.94% Return on Equity: 25.28% | Return on Assets: 19.67% Promoter holding: 53.78% | Dividend Yield: 0.00% New deployments in EV navigation, autonomous mapping, and smart city platforms OEM integrations with leading automotive brands extending platform reach
Institutional Interest & Ownership Trends Promoter holding remains healthy at 53.78%, with no dilution or pledging. Recent quarterly filings show marginal uptick in FII interest, while mutual fund holdings remained steady. Delivery volume trends suggest accumulation by small-cap institutional trackers and thematic tech-focused portfolios.
Business Growth Verdict Yes, C.E. Info Systems is scaling sustainably with differentiated geospatial offerings Margins remain robust across product lines Zero debt and high ROE underscore financial discipline Asset-light model supports scalable growth with minimal capex needs
Company Guidance Management expects continued double-digit revenue growth in FY26, driven by expansion in automotive-grade maps, IoT platforms, and SaaS contracts. Profit margins are projected to stay above 30%.
Final Investment Verdict C.E. Info Systems Ltd. offers a unique play in India’s emerging deep-tech and mobility infrastructure ecosystem. With strong profitability metrics, zero debt, and expanding adoption across automotive and government platforms, the company is positioned for long-term value creation. Despite modest topline scale, its consistent margin profile and differentiated IP stack make it suitable for staggered accumulation by investors seeking niche tech exposure with high capital efficiency.
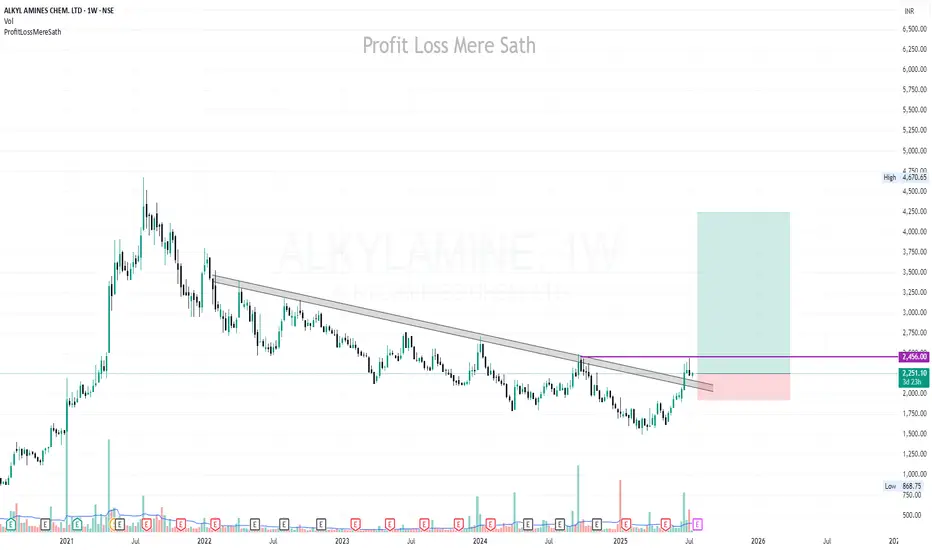
ALKYLAMINE | Buy @LTP | SL below 1900 | Targets 2700, 3440, 4250Disclaimer:
This is not financial advice. Please do your own research or consult with a financial advisor before making any investment decisions. Investments in stocks can be risky and may result in loss of capital.
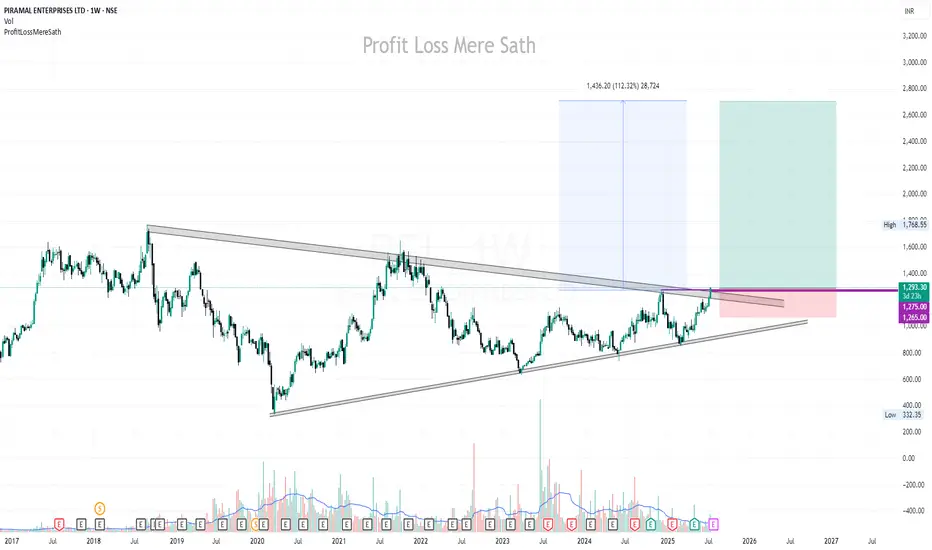
PEL | Buy @LTP | SL below 1070 | Targets 1560, 1765, 2700Disclaimer:
This is not financial advice. Please do your own research or consult with a financial advisor before making any investment decisions. Investments in stocks can be risky and may result in loss of capital.
IDEA : Watch out for the Red Band resistances IDEA : Watch out for the Red Band resistances
( Not a Buy / Sell Recommendation
Do your own due diligence ,Market is subject to risks, This is my own view and for learning only .)

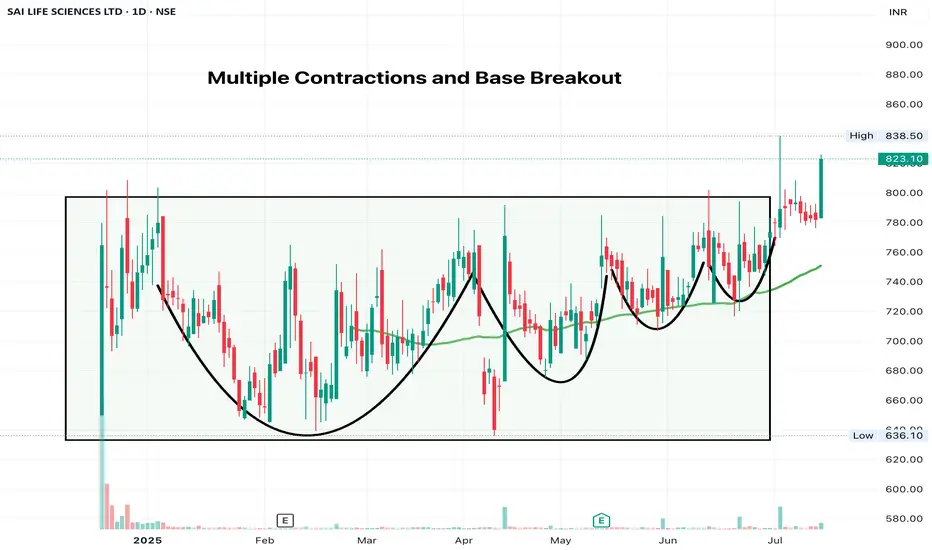
SAILIFE - IPO base breakoutTighter the consolidations, better the breakout.
A solid base has formed. Moving with the index, sector tailwinds in play
$MULTIVERSE Multiverse over 60% retracement from All time HighNSENG:MULTIVERSE Multiverse Mining & Exploration Plc focuses on quarrying solid minerals (granite, zinc, tin, tantalite, barite, columbite, gold, etc.) in Nigeria, with operations in Ogun and Nasarawa State.
Currently NSENG:MULTIVERSE has lost over 60% of its value from an all time high of 24.50/share and is in consolidation.
Current price: 9.85naira/share
Low risk Buy zone levels is between 6.8naira - 10naira/share
Expecting #Multiverse to retest previous resistances at 17naira/share and 24naira/share if price attempts a recovery.
📈 Key Levels
Breakout above ₦10.20 Breakout zone – key resistance turning into support if broken
₦17.1 TP1 – next major resistance (target)
₦24.5 TP2 – higher resistance / bull target
Invalidation of this idea is a weekly close under 6.8naira/share

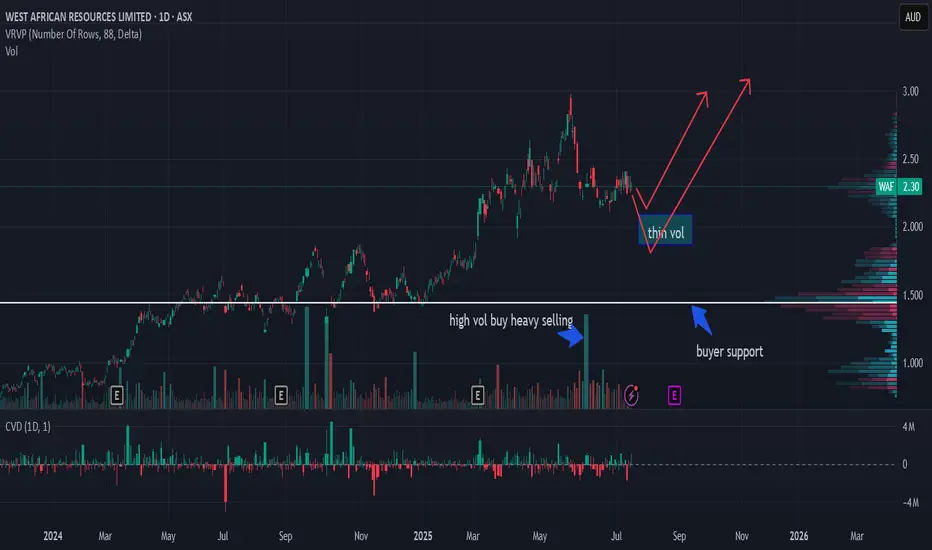
heavy buyers buy sold offlooking for buying support at $1.5 or higher and continuation through sellers at 1.75
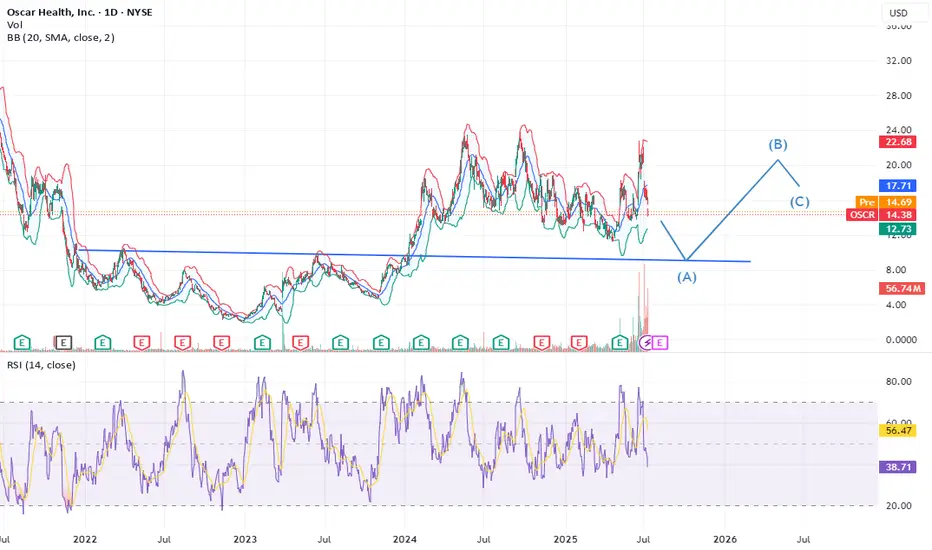
Oscar will go down to 10$ in next 3-4 months timeRecent Stock Pressure
Weak Q2 guidance from Centene weighed on sentiment, dragging OSCR down ~14%
.
Wells Fargo downgraded it to underweight, citing rising medical costs and pricing pressures in 2025
.
📊 Key Drivers for OSCR
1. 🩺 Healthcare Reform & the ACA / Medicare Advantage
Trump’s tariffs are targeted at pharma, not insurers. But if drug prices rise, costs trickle down to insurers like Oscar.
Conversely, Trump victories are seen as favorable for Medicare Advantage, potentially benefitting OSCR under a pro-Medicare Advantage regime
2. 💡 Growth & Momentum
Oscar recently posted strong Q1 results — 42% revenue growth and 45% share rally
The stock has explored the “meme stock”-like territory with ~52% weekly jump in June
🔍 What Trump Tariffs Mean for OSCR
No direct impact, as tariffs aim at imported drugs, not insurance firms.
Indirectly:
Higher drug costs → could pressure OSCR’s medical loss ratios
Meanwhile, political moves favoring Medicare Advantage and ACA stabilization could help OSCR
🌟 Outlook
Factor Impact on OSCR
⚠️ Downside risks Rising healthcare costs; regulatory uncertainty
✅ Upside catalysts Medicare Advantage tailwinds; continued execution & expansion
📉 Tech-driven momentum AI investments, ICHRA adoption, and growing RS rating (>90)
🔄 Volatility Meme-like spikes add risk—but also opportunity
🧭 Final Take
Trump tariffs on pharma won’t directly hit OSCR, but rising drug costs could hurt insurers if passed along to consumers.
Policy outlook (Medicare Advantage, ACA support) matters—bullish under Trump, bearish under heavier regulation.
OSCR is fundamentally a growth-tech-insurance stock, not a pharma or tariff play.
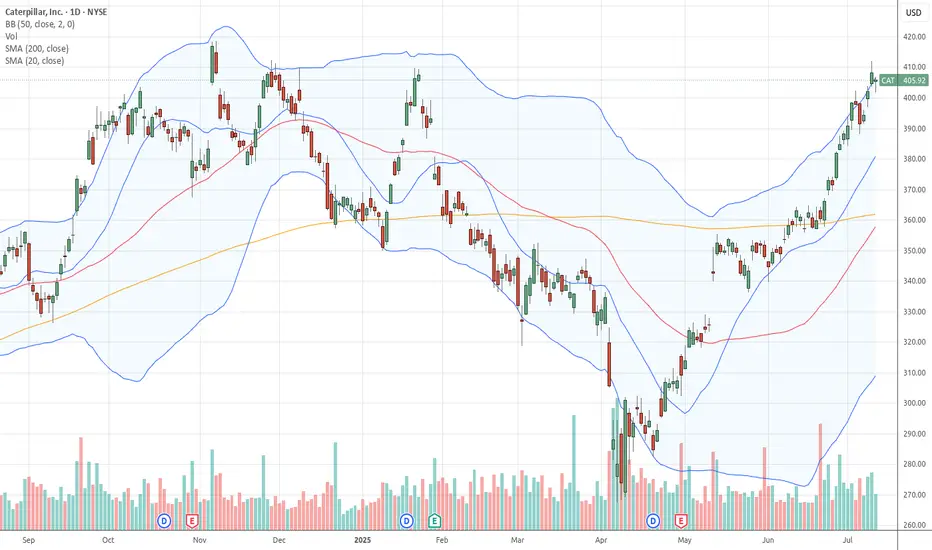
$CAT Tradespoon – Long Entry $404.54Tradespoon model generated long signal for NYSE:CAT . Predicted range: $404.54–$412.44. Trend: +0.38%. NYSE:CAT
Chili's: Still Cheap, Still Ignored, Still A Strong BuyCasual dining has been in limbo post-pandemic—too pricey for impulse meals, not fancy enough to feel special. But Brinker International (EAT), parent of Chili’s and Maggiano’s, is proving there's still a winning formula if you get the execution right.
🛠️ Operational Overhaul at Chili’s
Chili’s has quietly transformed itself. A deep operational review led to smarter kitchen processes and a slimmed-down menu. These changes boosted both food quality and efficiency. By simplifying things like wing sauces and adding real-time kitchen tools, Chili’s improved service speed and cut costs—freeing up staff to focus on core offerings like burgers and margaritas.
As management put it: "Marketing brings guests in, operations bring them back."
📣 Marketing That Works
Chili’s is also nailing the branding. Viral TikToks and a more relaxed, value-focused message have resonated with consumers—both old fans and new. Unlike competitors chasing trends or discounts, Chili’s has leaned into what it does best: an affordable, comfortable dining experience.
The strategy is working. Traffic is up, and customers are coming back—not just for the hype, but for the value.
📊 Financials and Growth Potential
Analysts expect revenue growth of 21%, 5%, and 5.5% over the next three years, with EPS potentially growing more than 11% annually. However, we believe these estimates undervalue Chili’s long-term growth, especially as margins improve and brand momentum continues.
At just 11x cash flow and a PEG ratio of 0.47, EAT is significantly cheaper than peers like Darden (2.1) and Shake Shack (3.8). That discount suggests the market hasn’t fully priced in Brinker’s turnaround.
⚠️ Risks to Watch
Slowing improvements: Much of the "low-hanging fruit" in operations may already be picked, so future gains could taper off.
Debt load: With $430M in long-term debt, a business slowdown could raise financial pressure, despite recent earnings strength.
✅ Bottom Line: Strong Buy
Chili’s turnaround is more than a viral blip—it’s a smart reinvention. Combined with solid execution at Maggiano’s, Brinker International is proving that casual dining can still thrive.
With strong fundamentals, smart leadership, and a discounted valuation, EAT stock looks like a compelling 'Strong Buy' for the next 12 months.
Spotify's Valuation Is Red-Lining (Rating Downgrade)📈 Spotify's Remarkable Comeback
Spotify NYSE:SPOT has transformed itself from a money-losing audio platform into a disciplined, profit-generating tech firm. Through smarter podcast investments, layoffs, and better monetization strategies, the company recently swung from red ink to positive free cash flow and strong earnings — a major shift for long-frustrated shareholders.
This operational turnaround helped fuel a massive rally: Spotify shares have surged nearly 140% since May 2024.
💵 Financials Look Strong... for Now
Revenue jumped from $15 billion to $17.4 billion over the past year — a 16% increase. Spotify also improved gross margins from 25% to 31.6%, while net margins turned positive at 7%. Bottom-line earnings exploded from a $119 million loss to $1.25 billion in profit.
These gains came from several smart moves:
- Reduced payouts to creators (from 75% to 70%)
- AI-generated content, like white noise playlists, cutting royalty costs
- Ad growth in podcasts and better ad tech
- Higher efficiency in infrastructure and operations
Analysts now expect Spotify’s earnings to grow another 74% this year, 45% in 2026, and 30% in 2027.
💰 But Valuation Is Stretched
Despite the impressive financial performance, Spotify's stock appears overheated. It now trades at:
117x trailing earnings
71x forward earnings
37x estimated 2027 earnings
These multiples are far above historical norms — and could spell trouble if growth slows even slightly. The company is running out of levers to improve margins further, and rising operational costs may start to weigh on profits.
Spotify also trades at its highest-ever price-to-sales ratio, indicating elevated investor expectations. If the company underdelivers, the stock could face a significant correction.
⚖️ Our Take: Time to Hold, Not Buy
We still believe in Spotify's long-term story. Its subscription model, improving margins, and global scale offer compelling advantages. But after this big run-up, the stock no longer offers favorable risk-reward.
We’re downgrading from "Strong Buy" to "Hold", suggesting investors with gains may want to trim positions and wait for a more attractive entry point.
📌 Bottom Line: Spotify has executed well — but the stock price now reflects near-perfect performance. A pause, or pullback, wouldn’t surprise us.

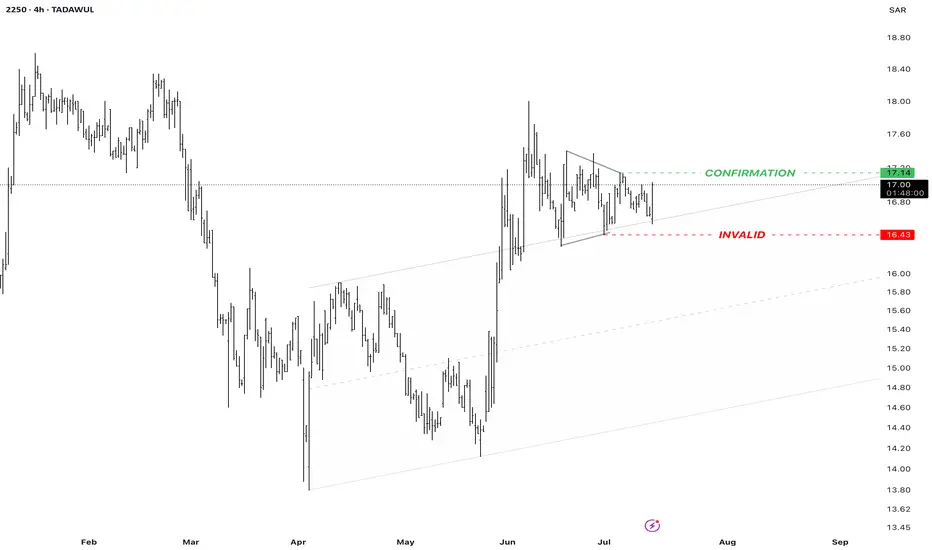
2250
On the chart:
Confirmation and failure zones.
After the triangle, the price is targeting a new high as a near-term target.
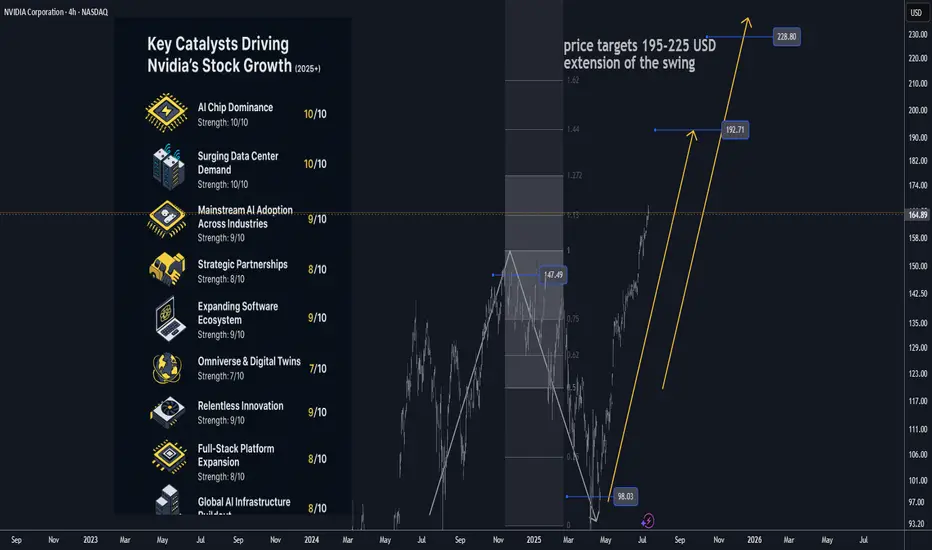
Nvidia (NVDA) 2025+ Catalysts & Risks: Analyst Views🚀 Nvidia (NVDA) 2025+ Catalysts & Risks: Analyst Views
🔑 Key Catalysts Driving Nvidia’s Stock Growth (2025+)
1. 🏆 AI Chip Dominance
Nvidia maintains >90% market share in data-center AI chips (Blackwell, Hopper, Rubin). Its CUDA ecosystem and relentless innovation keep it as the “default” supplier for advanced AI, giving NVDA massive pricing power.
2. 🏗️ Surging Data Center Demand
Cloud and enterprise AI spending remains white-hot. Tech giants (Meta, Microsoft, Amazon, Google) are collectively pouring $300B+ into 2025 AI CapEx. Data center revenues are at all-time highs; analysts expect this uptrend to extend through 2026 as “AI infrastructure arms race” persists.
3. 🌐 Mainstream AI Adoption
AI is now integrated in nearly every industry—healthcare, finance, logistics, manufacturing, retail. As companies embed AI at scale, NVDA’s hardware/software sales rise, with “AI everywhere” tailwinds supporting 15–25% annual growth.
4. 🤝 Strategic Partnerships
Big wins: Deals with Snowflake, ServiceNow, and massive sovereign/international AI collaborations (e.g., $B+ Saudi Arabia/“Humain” order for Blackwell superchips; UAE, India, and Southeast Asia ramping up AI infrastructure using Nvidia).
5. 🚗 Automotive/Autonomous Vehicles
NVDA’s automotive AI segment is now its fastest-growing “new” business line, powering next-gen vehicles (Jaguar Land Rover, Mercedes, BYD, NIO, Lucid) and expected to surpass $1B+ annual run rate by late 2025.
6. 🧑💻 Expanding Software Ecosystem
Nvidia’s “full stack” software (CUDA, AI Enterprise, DGX Cloud) is now a sticky, recurring-revenue engine. Over 4M devs are building on Nvidia’s AI SDKs. Enterprise AI subscriptions add high-margin growth on top of hardware.
7. 🌎 Omniverse & Digital Twins
Industrial metaverse and simulation/digital twin momentum is building (major partnerships with Ansys, Siemens, SAP, Schneider Electric). Omniverse becoming the industry standard for 3D AI/simulation, unlocking new GPU/software demand.
8. 🛠️ Relentless Innovation
Blackwell Ultra GPUs debuting in late 2025, “Rubin” architecture in 2026. Fast-paced, aggressive product roadmap sustains Nvidia’s tech lead and triggers constant upgrade cycles for data centers and cloud providers.
9. 📦 Full-Stack Platform Expansion
Grace CPUs, BlueField DPUs, and Spectrum-X networking mean Nvidia is now a “one-stop shop” for AI infrastructure—capturing more value per system and displacing legacy CPU/network vendors.
10. 🌏 Global AI Infrastructure Buildout
Recent US export rule rollbacks are a huge tailwind, opening up new high-volume markets (Middle East, India, LatAm). Nvidia remains the “go-to” AI chip supplier for sovereign and enterprise supercomputers outside the US, supporting continued global growth.
________________________________________
📈 Latest Analyst Recommendations (July 2025)
•Street Consensus: Overwhelmingly bullish—~85% of analysts rate NVDA as “Buy/Overweight” (rest “Hold”), with target prices often in the $140–$165 range (post-split, as applicable).
•Target Price Range: Median 12-month PT: $150–$160 (representing ~20% upside from July 2025 levels).
•Key Bullish Arguments: Unmatched AI chip lead, accelerating enterprise AI adoption, deep software moat, and a robust international/sovereign AI order pipeline.
•Cautious/Bearish Notes: Valuation premium (45–50x P/E), high expectations priced in, geopolitical and supply chain risks.
________________________________________
⚠️ Key Negative Drivers & Risks
1. 🇨🇳 US–China Tech War / Chip Export Restrictions
• US restrictions: While the Biden administration eased some export bans in May 2025 (allowing more AI chip exports to Gulf/Asia partners), China remains subject to severe curbs on advanced NVDA AI chips.
• Workarounds: Nvidia is selling modified “China-compliant” chips (H20, L20, A800/H800), but at lower margins and lower performance.
• Risk: If US tightens controls again (post-election), China sales could fall further. Chinese firms (Huawei, SMIC, Biren) are also racing to build their own AI chips—posing long-term competitive risk.
2. 🏛️ Political/Regulatory Risk
• Election year: A US policy shift (e.g., harder tech stance after Nov 2025 election) could re-restrict exports, limit new markets, or disrupt supply chains (especially TSMC foundry reliance).
3. 🏷️ Valuation Risk
• NVDA trades at a substantial premium to tech/semiconductor peers (45–50x fwd earnings). Any AI “spending pause” or earnings miss could trigger sharp volatility.
4. 🏭 Supply Chain & Capacity Constraints
• As AI chip demand soars, there’s ongoing risk of supply/delivery bottlenecks (memory, HBM, advanced packaging), which could cap near-term revenue upside.
5. 🏁 Competitive Threats
• AMD, Intel, and custom in-house AI chips (by Google, Amazon, Microsoft, Tesla, etc.) are scaling up fast. Loss of a hyperscaler account or a successful open-source software alternative (vs CUDA) could erode Nvidia’s dominance.
6. 💵 Customer Concentration
• A small handful of cloud giants account for >35% of revenue. Delays or pullbacks in their AI spending would materially impact results.
________________________________________
📝 Summary Outlook (July 2025):
Nvidia’s AI chip monopoly, software moat, and global AI arms race create a powerful multi-year growth setup, but the stock’s high valuation and US-China chip tension are real risks. Analyst consensus remains strongly positive, with most seeing more upside as data-center and enterprise AI demand persists—but with increased focus on geopolitical headlines and potential supply chain hiccups.
________________________________________
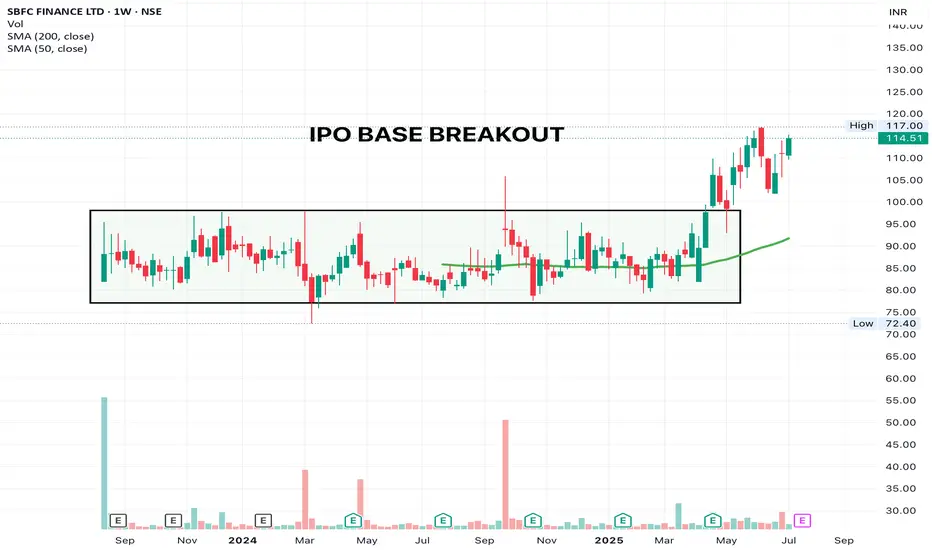
SBFC - RESISTING TO FALLStructures like this deserve a place in every portfolio. Buyers are ready to pounce on any shares available. This is why having sector tailwinds is so important.
SL - 101
NYKAA - Cup and HandleGood candle today, valid entry for a swing trade. The volume candle on earnings day is hiding the high volume candles printed in the last week. Keep today's low as SL
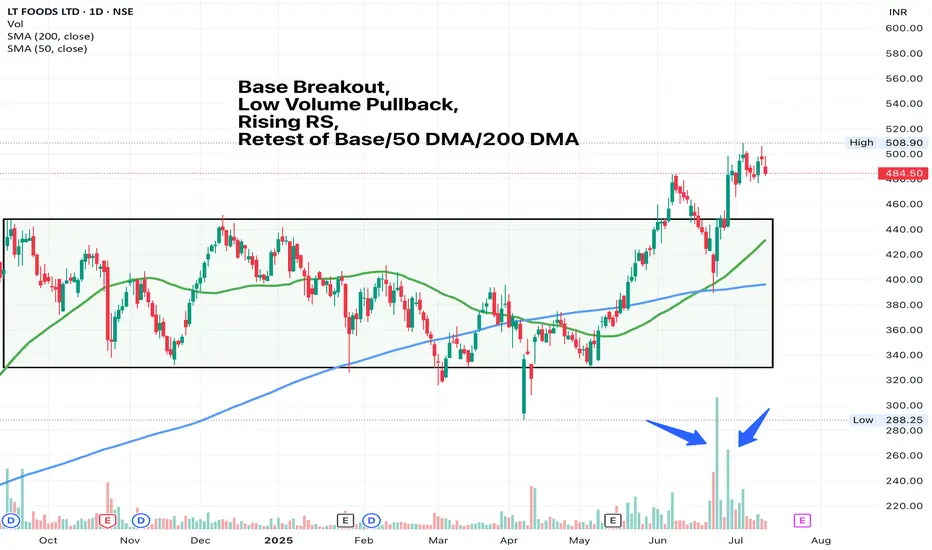
LTFOODS - Golden Crossover Golden Crossover and a new ATH. Simple things can make you money. You don't need fancy indicators for it. Most will ignore a simple template, but those who see the beauty will mint.
SL: 441 (Low of Breakout Candle)