Time to buy? Too much negative press. Buy in Fear- Updated 18/7Apple has significantly underperformed compared to the other Magnificent 7 stocks, but I don’t believe it’s a company you should bet against in the current climate. With a slow rollout of AI and recent statements from Apple, they may not always be first to market, but they generally execute well. The remarks regarding Sony, Samsung, and Netflix by Apple were very revealing and demonstrate a solid long-term strategy. However, there may be some bumps along the way as they work toward their goals, potentially involving acquisitions.
The fear spread in the media is similar to the FUD (fear, uncertainty, doubt) often associated with Bitcoin, and this is typically a good time to buy. Remember the saying: if retail investors miss the boat, it’s gone, but if institutions miss it, they often bring the boat back.
While this is not financial advice, based on the green weekly candle, it's hard not to pay attention, and Apple may now have a very positive year ahead! Especially with the weakening dollar and reports stating that this will benefit them greatly.
Apple has been consolidating in the 210 USD region, forming a smaller flag pattern that is nearing completion. Based on this previous pattern, the next upward move is expected to reach >$220, where consolidation will likely begin again. With Apple’s earnings rapidly approaching and stronger-than-expected results anticipated, July and August could be very positive months for Apple holders.
A golden cross appears likely, with the 50-day EMA just $5.50 below the 200-day EMA. This would be very bullish for Apple and could trigger significant interest from both institutional and retail investors. Additionally, Apple has been lagging behind the other “Magnificent Seven” stocks, experiencing considerable selling pressure; however, this trend is now reversing. Apple is shaping up to be a good short-term and long-term hold.
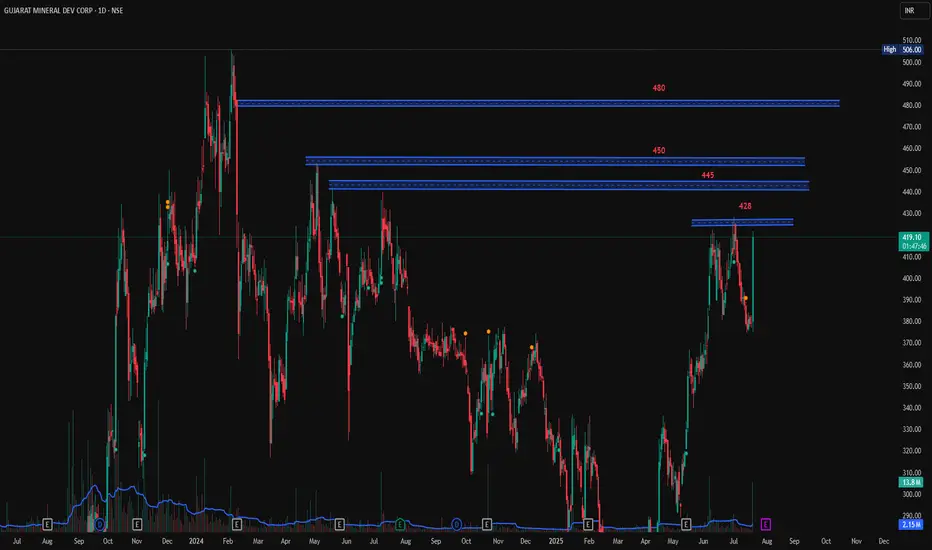
GMDC, Long 1D, Breakout, VolumesGMDC has shown a good volume in the stock today and has taken support from the previous low. If it breaks its recent high of 428 with Bullish candlestick patterns like Bullish Engulfing, Hammer & Inverted Hammer, Piercing Line, Morning Star, Three White Soldiers, Tweezer Bottoms or Bullish Harami, then take a long trade on this stock.
Entry: 428 (on Bullish candlestick pattern)
Target1: 445
Target2: 450 till 480.
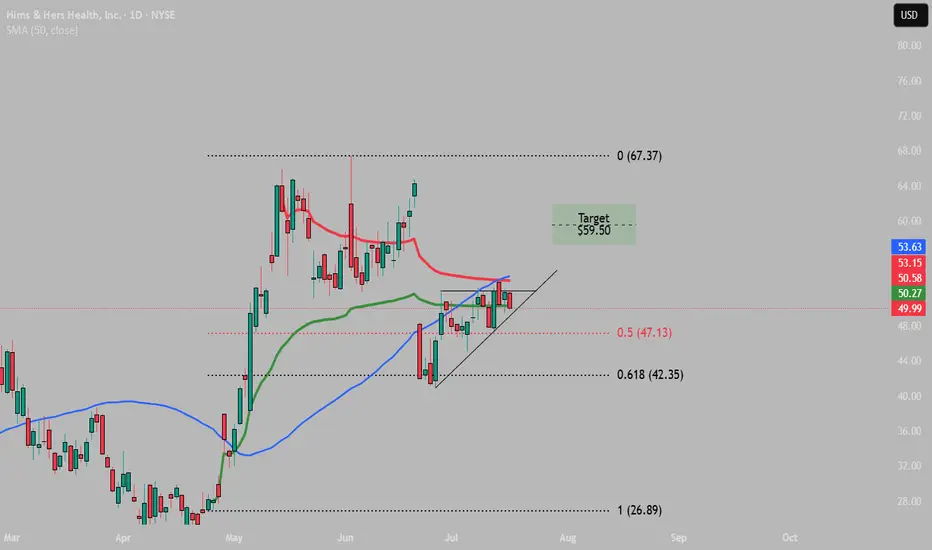
$HIMS Squeeze Time Frame: 1D
RSI : Neutral
MACD: Bullish Cross
Fib Levels: Retraced back to 61.8%
Target:
$59.50
Pattern invalidated of drop below 61.8% ($42.35) Fib level.
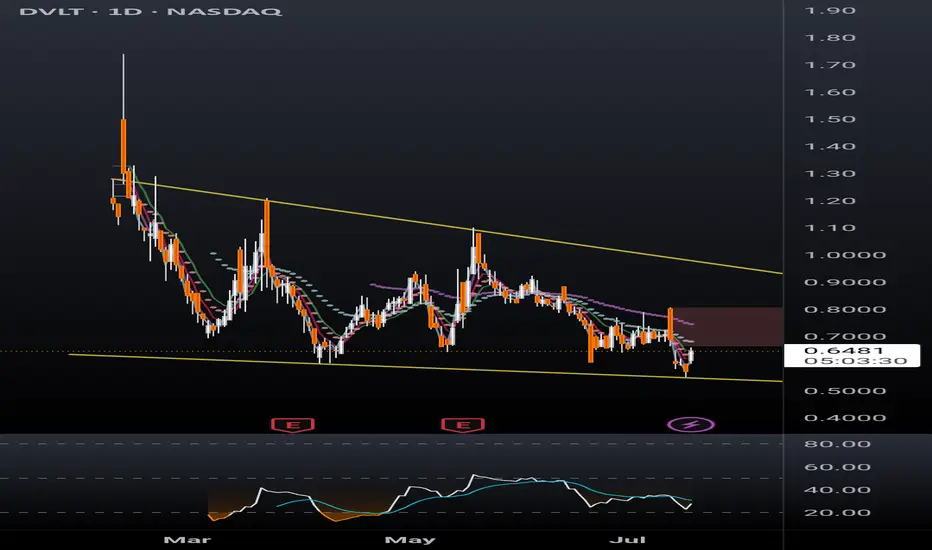
DVLT falling wedge, TP $1+DVLT a relatively new ticker is already drawing a lot of attention. Up 13% today after hitting new all time low yesterday, sure to catch a lot of eyes from retail investors. With recent news releases such as a licensing agreement with IBM, a lawsuit against naked short selling, and US patent allowances, target prices have been announced ranging from $3 to $11/share.
Disclaimer, this ticker is PRONE TO HEAVY DILUTION, however in order to remain listed on NASDAQ the SP will have to hit $1 and remain there. This being the case, the company must have something in the books to break upward out of this falling wedge and give shareholders a reason to stay with the company long term.
I'm just a cat not a financial advisor.
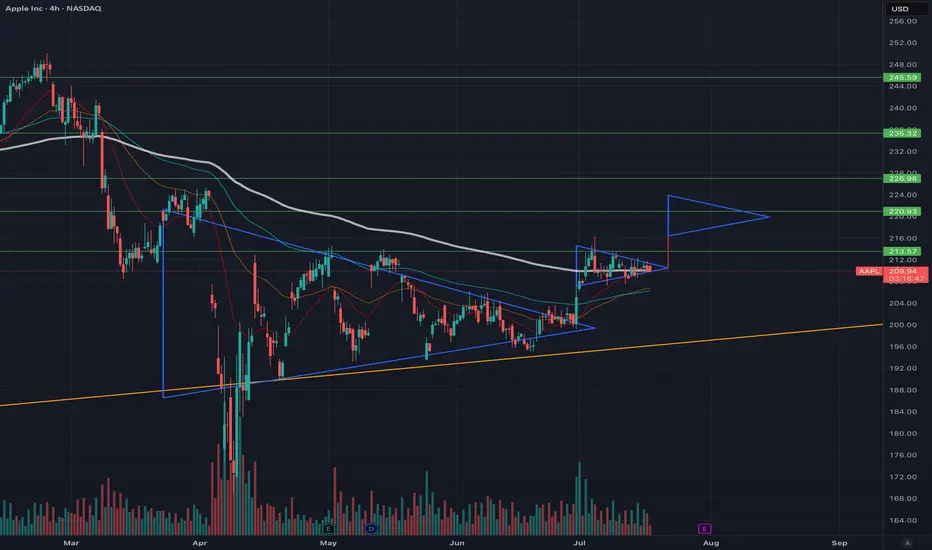
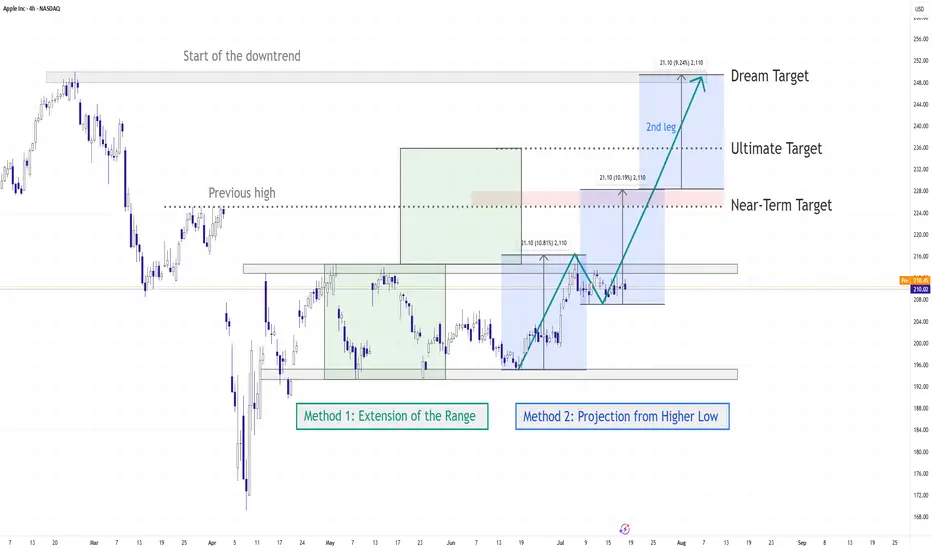
AAPL Set for a Breakout? | Technical Checklist & Projections
▍Observation & Context
▪ AAPL has been moving sideways within a clearly defined range for the past three months .
▪ On July 07 , price tested the range resistance decisively, showing some interest in the upside.
→ Let's first explore the bullish breakout scenario.
▍What Makes a Good Breakout ?
Before we talk about targets, let’s define what a good breakout looks like:
▪ A strong bullish candle breaking through the resistance in one clean move .
▪ Followed by a retest of the broken resistance (now acting as support).
▪ After that, price should ideally:
1. Form a higher low , and
2. Reach the next resistance or target zone before pulling back.
▍Target Price – Method 1: Extension of the Range
🔹 Near-Term Target: 1.5–1.618x Fibonacci Extension
- A common zone where momentum often pauses.
- Aligns with the previous high from the last downtrend.
- Technically, to reverse a trend, price needs to take out the previous high. Even though the range has “cooled off” the pressure, we still respect that level.
🔹 Ultimate Target: 2x Range Extension
- Represents a 100% projection of the previous range.
- Commonly used in range breakout targets.
🔹 Dream Target: 2.618x Fibonacci Extension
- Aligns with the start of the last downtrend , adding significance to the level.
- Often marks the exhaustion point of strong trends.
▍Target Price – Method 2: Projection from Higher Low
Note: The new higher low is not yet confirmed at the time of writing. The levels below assume an upward breakout without dropping below 207.22 . However, the same logic can be applied once the higher low forms.
🔹 Near-Term Target: Same as Method 1
🔹 Ultimate Target: 100% Projection of Prior Swing
- Projecting the prior swing (from previous low to recent high) from the new higher low .
- This level also aligns with the 1.5–1.618x Fibonacci extension of that swing, increasing its significance.
🔹 Dream Target: Another 100% projection
- Rare, but happens when momentum is very strong .
- In such cases, price might skip any retracement and launch directly into a second leg , equal to the previous swing.
- Here, the level aligns perfectly with the start of the last downtrend , just like the 2.618x extension in Method 1.
▋Mental Notes
▪ No one knows for sure if the breakout will be real or fake. But when it happens, knowing what to look for and where price might go next gives us a clear plan of action .
▪ The market will always find ways to surprise. Stay open and follow the flow.
▋Not Financial Advice
The information contained in this article is not intended as, and should not be understood as financial advice. You should take independent financial advice from a professional who is aware of the facts and circumstances of your individual situation.
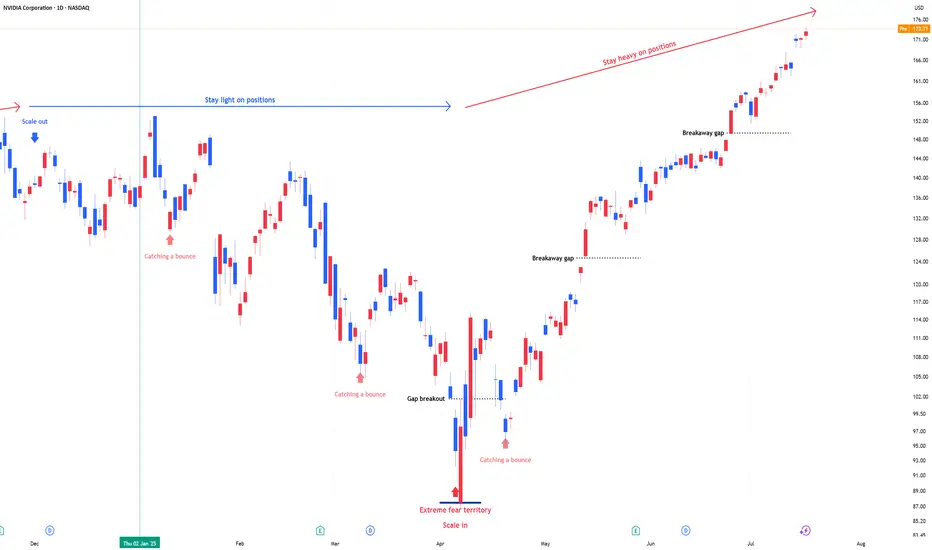
NVIDIA: Stay heavy on positionsNVDA position size is adjusted in line with US market signals for underweight or overweight allocations. During panic phases, 2x leverage ETFs are on the table
Stay heavy on positions.
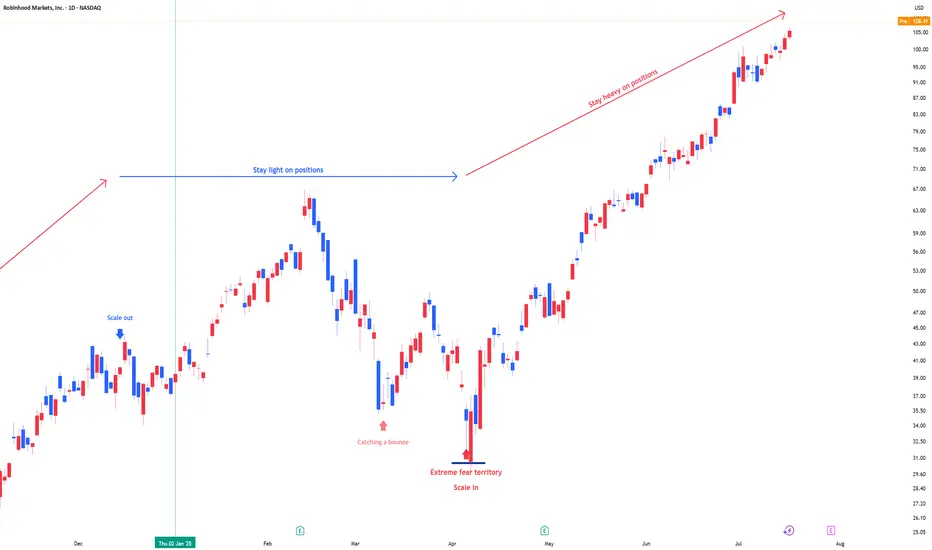
RobinHood Markets: Stay heavy on positionsHOOD position size is adjusted in line with US market signals for underweight or overweight allocations. During panic phases, 2x leverage ETFs are on the table
Stay heavy on positions.
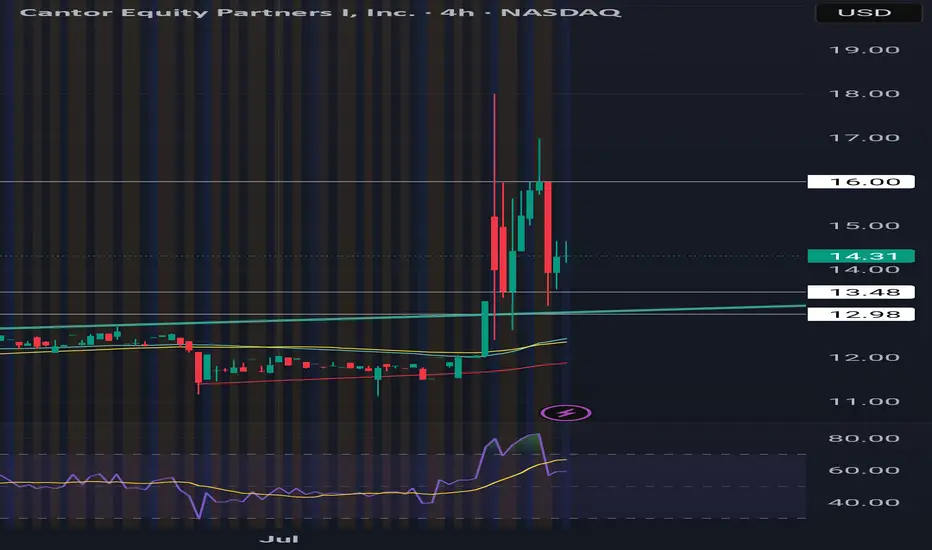
BTC TREASURY Adam Back, a satoshi era OG, is launching Bitcoin Standard Treasury Company (BSTR), which plans to go public through a merger with Cantor Equity Partners I (CEPO), a special-purpose acquisition company. BSTR will debut with 30,021 BTC, valued at approximately $3.5 billion, making it the fourth-largest public Bitcoin treasury. The company has secured $1.5 billion in private investment in public equity (PIPE) financing, the largest for a Bitcoin treasury SPAC merger, with CEPO contributing up to $200 million, subject to shareholder redemptions. The merger, expected to close in Q4 2025, aims to maximize Bitcoin ownership per share and accelerate adoption through Bitcoin-native financial products and advisory services. Ill be loading shares tommorrow and continuing to dca. Btc price swings will influence this heavily wind direction is currently North!
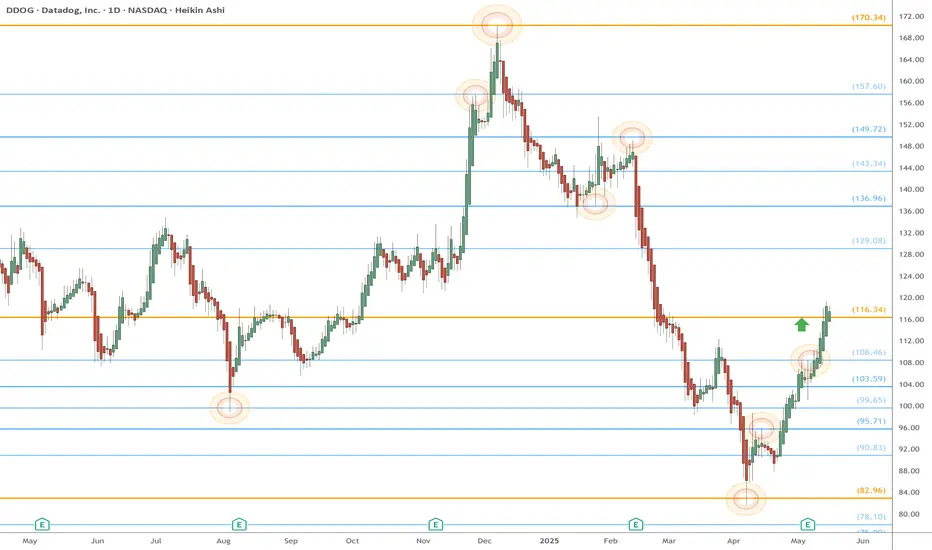
DDOG eyes on $116.34: Golden Genesis fib to determine the TrendDDOG bounce just hit a Golden Genesis at $116.34
The sister Goldens above and below marked extremes.
This one could mark the orbital center for some time.
It is PROBABLE that we orbit this fib a few times.
It is POSSIBLE that we see a pullback from here.
It is PLAUSIBLE but unlikely to continue non-stop.
===============================================
.
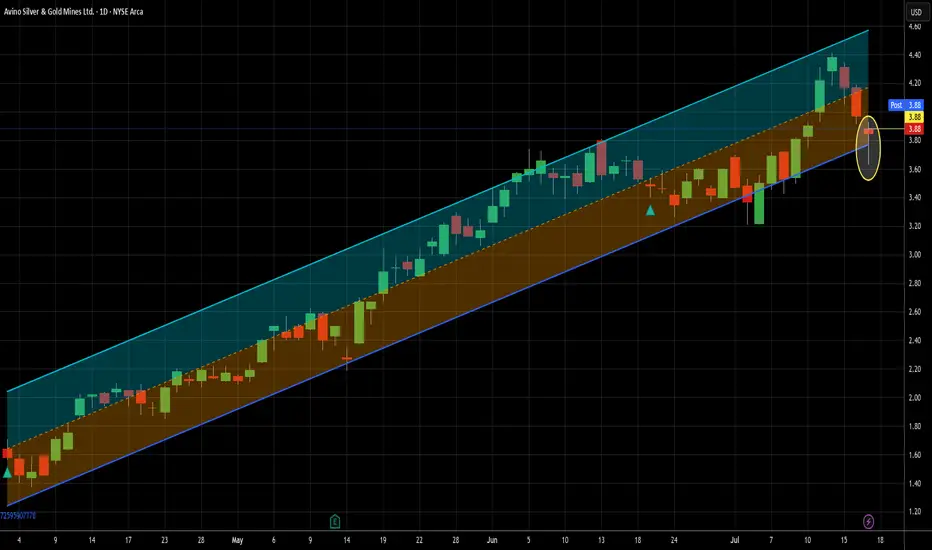
I'm just going to keep putting the hammer down - Long at 3.88I've done two other ideas for ASM in the last 3-1/2 months, so I'm not gonna rehash all those details here. If you are new to me or to my ideas for this ticker, just look at those. In them, I make a fairly compelling argument for short term trading this name. I'll sum it up quickly here - it's been extremely profitable. I'm expecting no different this time.
Since my last idea on June 20th, there has been only one buy signal on this name until this week, but that one paid 9.5% in two trading days. Today's signal is actually the 3rd in a row (not uncommon for this ticker) and full disclosure, I traded the other two so I'm in this already. That said, today's signal is extra spicy, thanks to that pretty little hammer of a candlestick that printed today. For those unfamiliar, it is often a sign of a bullish reversal. It requires confirmation, but given the perfect record my signals have provided to this point on ASM, I can justify not waiting for that confirmation as it can cause missed trades if the stock jumps 4 or 5% the next day, as it is fond of doing. But if someone were to jump in on this trade but wanted to wait for confirmation, I believe that the move here would last more than one day, should it happen.
I also have been increasing my exposure to inflation-related trades lately and why not get that from something that bumps like this does?
The solid uptrend that goes back well farther than this chart shows sweetens the deal even more. Given that my first recent signal clicked at the 4.17 level two days ago, I'm expecting a move to and beyond that level in the relatively near term, though that's obviously not a guarantee. I will likely get out of this leg of the trade before it gets there, unless it does it in one move, which isn't out of the question at all. That's only about 7.5% above the current price and this stock moves that much in a day semi-frequently. Twice in the last 7 trading days, in fact.
So that's my case. If the market stays semi-strong, this will likely stay weak until the market cools off some. This is my second add to my real life position, so I'm certainly not shy about adding more if my signals warrant it.
As always - this is intended as "edutainment" and my perspective on what I am or would be doing, not a recommendation for you to buy or sell. Act accordingly and invest at your own risk. DYOR and only make investments that make good financial sense for you in your current situation.
Apple: Consolidation Before Potential Breakout Toward $260Apple shares have recently pulled back into a consolidation phase. We see further upside potential in magenta wave (B) before a pullback occurs as part of the same-colored wave (C), which is expected to target the low of green wave . After that, we anticipate a new upward move: Green wave should take over—remaining above support at $168—and drive the stock toward the next major resistance at $260.10. However, if the price drops back below the $168 support level, our alternative scenario comes into play: in that case, we would expect a lower low for blue wave alt.(IV), with a probability of 32%.
📈 Over 190 precise analyses, clear entry points, and defined Target Zones - that's what we do (for more: look to the right).

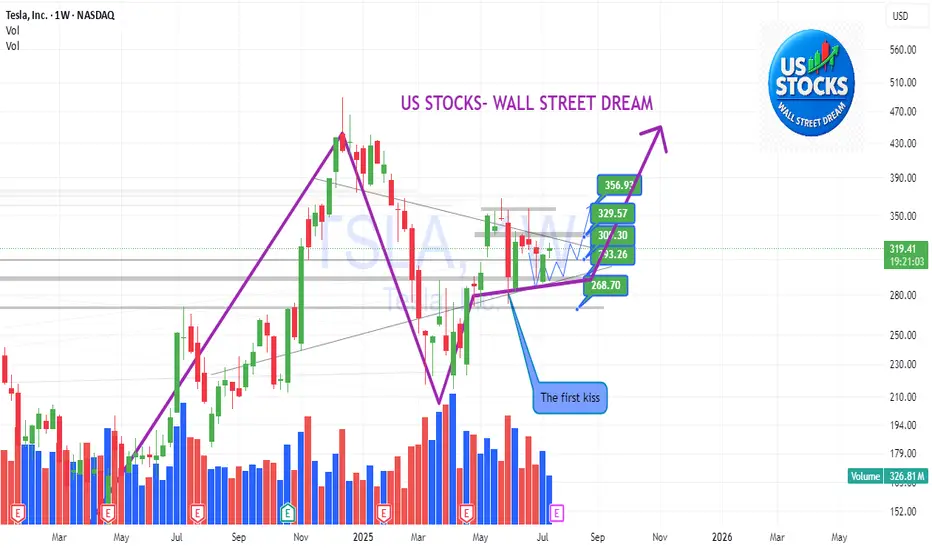
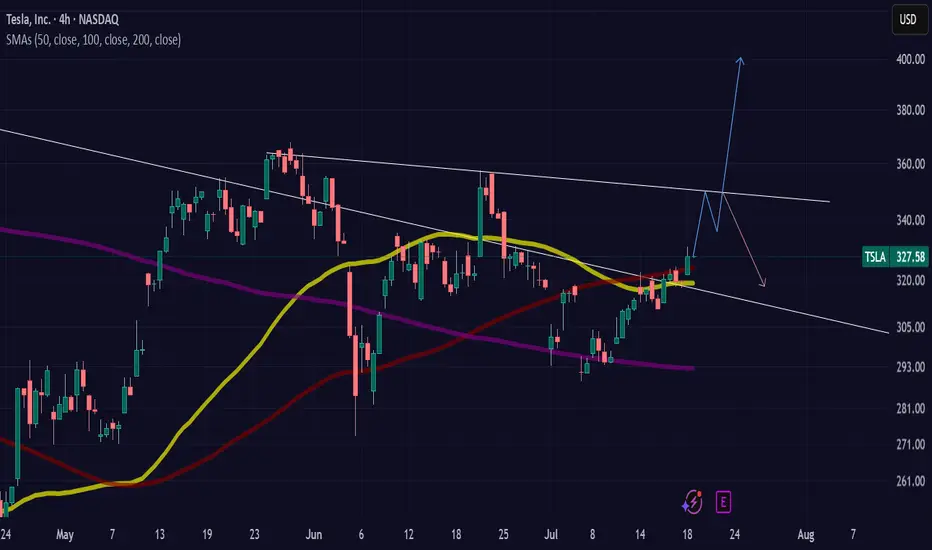
TSLA: Anyone knows this pattern?TSLA:
Anyone knows this pattern?
Think contrarily to the market — seek opportunities in things that few people notice or pay attention to, and when you do, opportunities will come to you earlier than they do to the crowd.
.
US STOCKS- WALL STREET DREAM- LET'S THE MARKET SPEAK!
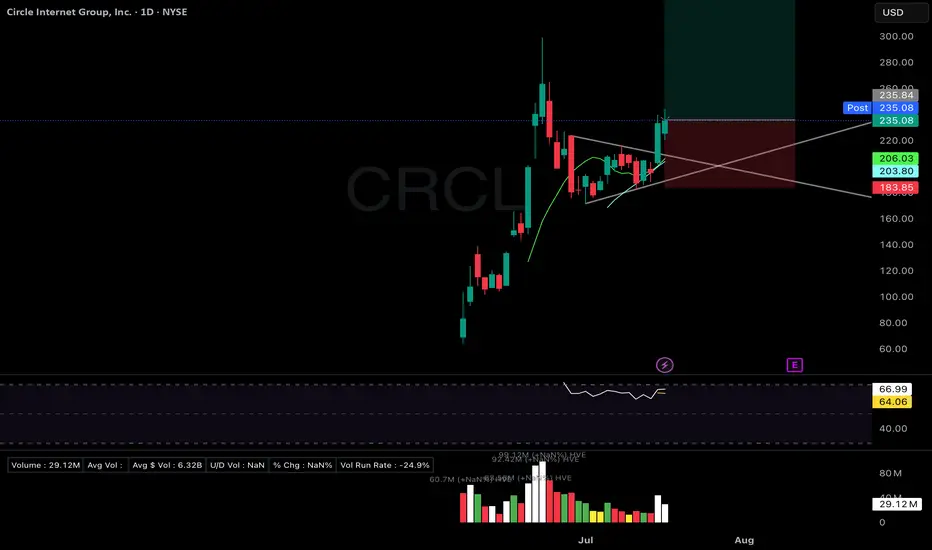
CRCL Right-side base forming post-IPO. Volume supporting accumCRCL – Circle Internet Financial (IPO)
Setup Grade: A
• Entry: $235.84 (7/17)
• Status: Active
• Trailing Stop: $183.85 (2x ATR)
• Setup: Right-side base forming post-IPO. Volume supporting right-side structure. Higher high after higher low. Sector: blockchain/stablecoins.
• Plan: Add on breakout over ATH $98.99. Hold with strict trailing stop discipline.
RDDT - Ready for Round 2?RDDT is setting up a base here, let's see if it holds this previous support level around 80.
Target 1 - 160
Target 2 - 180
Stop loss - 75

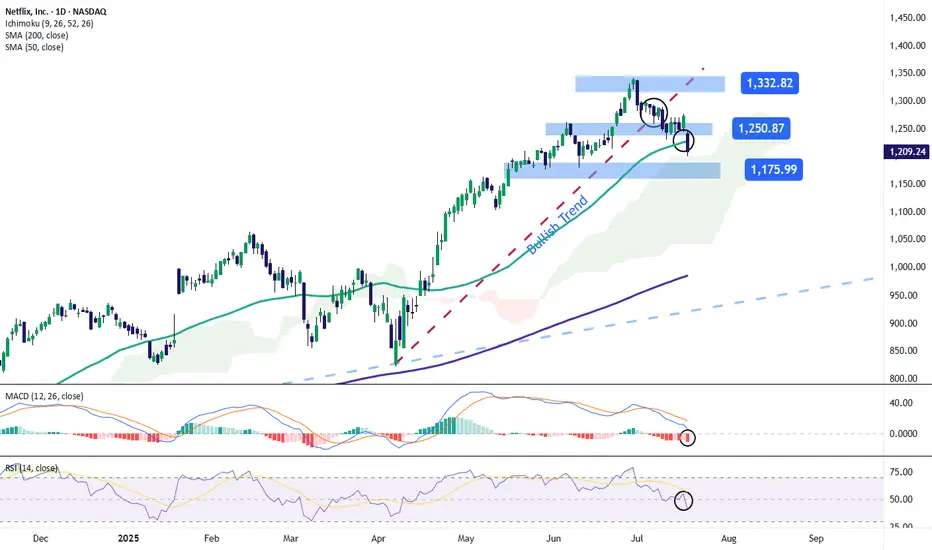
Netflix Stock Drops After Earnings ReleaseShortly after publishing its financial results, Netflix posted a decline of over 5% toward the end of the week and continues to show a strong bearish bias. This comes despite reporting a positive earnings per share (EPS) figure of $7.19, beating the expected $7.08, and revenue of $11.08 billion, slightly above the forecast of $11.07 billion.
However, in its post-earnings communications, the company stated that it expects very moderate growth for the remainder of the year. It also warned that the positive indicators could begin to compress due to increased spending on marketing and content, which has ultimately weakened the impact of the solid financial results. As a result, the stock faced persistent selling pressure heading into the weekly close.
Uptrend Breaks
Over the past few weeks, starting in early April, the stock had followed a steady uptrend, pushing the price above $1,300. However, continued bearish corrections have now brought the price down to the $1,200 area, causing a clear break in the previous uptrend. This breakdown could further strengthen the bearish pressure in the coming sessions if the negative sentiment persists.
MACD
The MACD histogram continues to move below the zero line, and as it drifts further from this level, it signals a steady bearish momentum that could remain dominant in the near term if the trend continues.
RSI
The RSI line has broken sharply below the neutral 50 level, indicating a clear dominance of bearish momentum in the market. As long as it does not reach oversold territory, this move may suggest a continued increase in short-term selling pressure.
Key Levels:
1,332 – Recent High: This is the most important resistance level. If price action returns to this area, it could reactivate the previous uptrend, which had been weakening on the chart.
1,250 – Nearby Resistance: A barrier defined by the most recent neutral zone. It may act as a temporary ceiling against short-term bullish corrections.
1,175 – Key Support: A critical level located below the 50-period simple moving average. If the price breaks below this level, it could strengthen a bearish bias and trigger a more consistent downtrend.
Written by Julian Pineda, CFA – Market Analyst
TSLA: Up for earnings on Wednesdayinitial move is, I think $350.
But can Elon bring in the buyers for earnings?
There's a healthy mix of bearish and bullish sentiment, but at the end of the day, promises hold weight, and do they hold weight?
All the best.
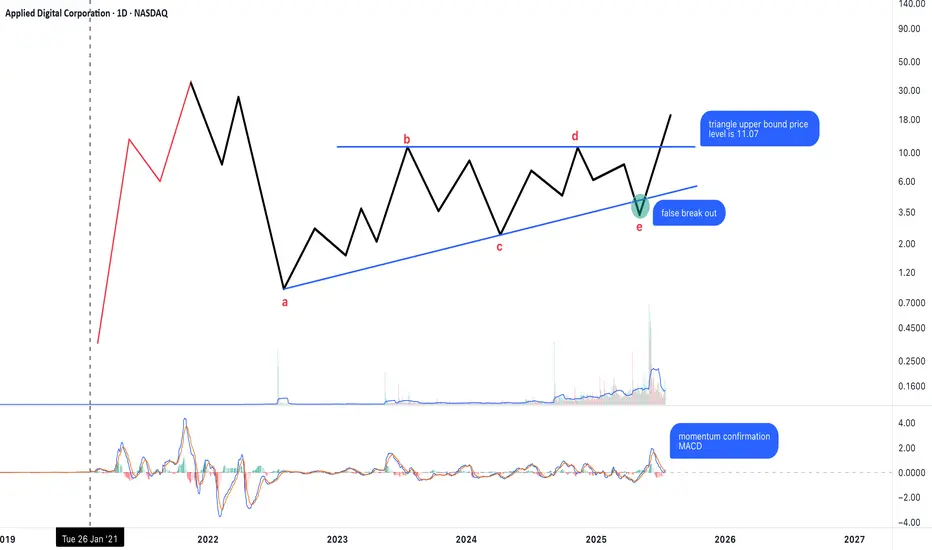
Possible Neutral Triangle Breakout – Key Level at 11.07The chart appears to show a completed neutral triangle (a–b–c–d–e), with a breakout emerging above the upper boundary at 11.07.
Wave a looks like a complex structure (possibly elongated flat or flat + zigzag).
The rest of the legs are mostly zigzag forms, consistent with triangle rules.
False breakdown below wave e followed by a strong reversal.
MACD is confirming momentum during the breakout attempt.
As long as price stays above 11.07, this breakout may be sustained. If confirmed, the next target zone could align with the height of the triangle projected upward.
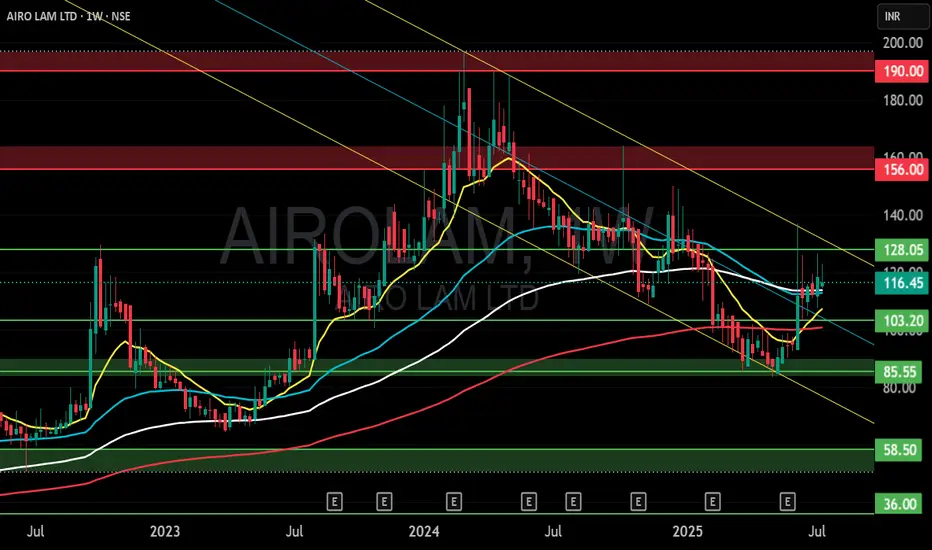
AIROLAM (AIRO LAM LTD) S/RSupport and Resistance Levels:
Support Levels: These are price points (green line/shade) where a downward trend may be halted due to a concentration of buying interest. Imagine them as a safety net where buyers step in, preventing further decline.
Resistance Levels: Conversely, resistance levels (red line/shade) are where upward trends might stall due to increased selling interest. They act like a ceiling where sellers come in to push prices down.
Breakouts:
Bullish Breakout: When the price moves above resistance, it often indicates strong buying interest and the potential for a continued uptrend. Traders may view this as a signal to buy or hold.
Bearish Breakout: When the price falls below support, it can signal strong selling interest and the potential for a continued downtrend. Traders might see this as a cue to sell or avoid buying.
MA Ribbon (EMA 20, EMA 50, EMA 100, EMA 200) :
Above EMA: If the stock price is above the EMA, it suggests a potential uptrend or bullish momentum.
Below EMA: If the stock price is below the EMA, it indicates a potential downtrend or bearish momentum.
Trendline: A trendline is a straight line drawn on a chart to represent the general direction of a data point set.
Uptrend Line: Drawn by connecting the lows in an upward trend. Indicates that the price is moving higher over time. Acts as a support level, where prices tend to bounce upward.
Downtrend Line: Drawn by connecting the highs in a downward trend. Indicates that the price is moving lower over time. It acts as a resistance level, where prices tend to drop.
Disclaimer:
I am not SEBI registered. The information provided here is for learning purposes only and should not be interpreted as financial advice. Consider the broader market context and consult with a qualified financial advisor before making investment decisions.
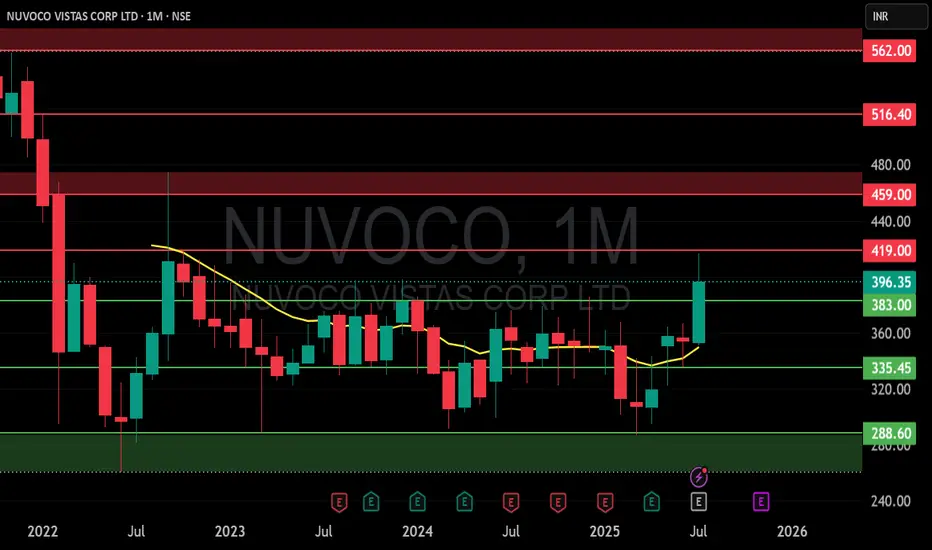
NUVOCO (NUVOCO VISTAS CORP LTD) S/RSupport and Resistance Levels:
Support Levels: These are price points (green line/shade) where a downward trend may be halted due to a concentration of buying interest. Imagine them as a safety net where buyers step in, preventing further decline.
Resistance Levels: Conversely, resistance levels (red line/shade) are where upward trends might stall due to increased selling interest. They act like a ceiling where sellers come in to push prices down.
Breakouts:
Bullish Breakout: When the price moves above resistance, it often indicates strong buying interest and the potential for a continued uptrend. Traders may view this as a signal to buy or hold.
Bearish Breakout: When the price falls below support, it can signal strong selling interest and the potential for a continued downtrend. Traders might see this as a cue to sell or avoid buying.
MA Ribbon (EMA 20, EMA 50, EMA 100, EMA 200) :
Above EMA: If the stock price is above the EMA, it suggests a potential uptrend or bullish momentum.
Below EMA: If the stock price is below the EMA, it indicates a potential downtrend or bearish momentum.
Trendline: A trendline is a straight line drawn on a chart to represent the general direction of a data point set.
Uptrend Line: Drawn by connecting the lows in an upward trend. Indicates that the price is moving higher over time. Acts as a support level, where prices tend to bounce upward.
Downtrend Line: Drawn by connecting the highs in a downward trend. Indicates that the price is moving lower over time. It acts as a resistance level, where prices tend to drop.
Disclaimer:
I am not a SEBI registered. The information provided here is for learning purposes only and should not be interpreted as financial advice. Consider the broader market context and consult with a qualified financial advisor before making investment decisions.
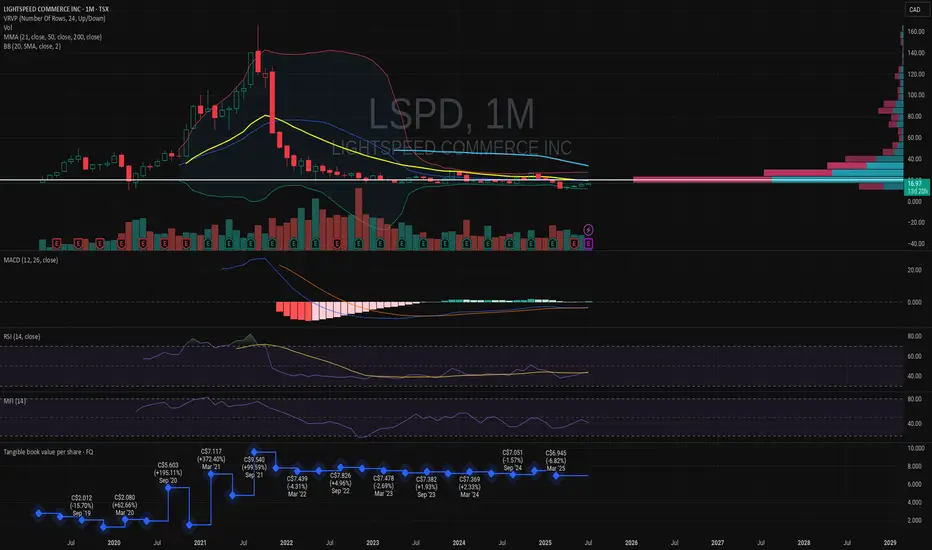
LSPD - Looks promising here. LONG. LSPD
If they can keep on keeping on, bring in cash, I think they have a good shot at carving out a market.
Of course I'm a newbie at all this and just giving my 0.00002 worth.
Same goes for all my charts. I don't profess to know a whole lot, but I'm trying.
If the last few years were tough for companies, expect more to come. IMO
So debt is a problem, staying cash positive is key, and creating a good management group is imperative. again, just thoughts.
cheers.
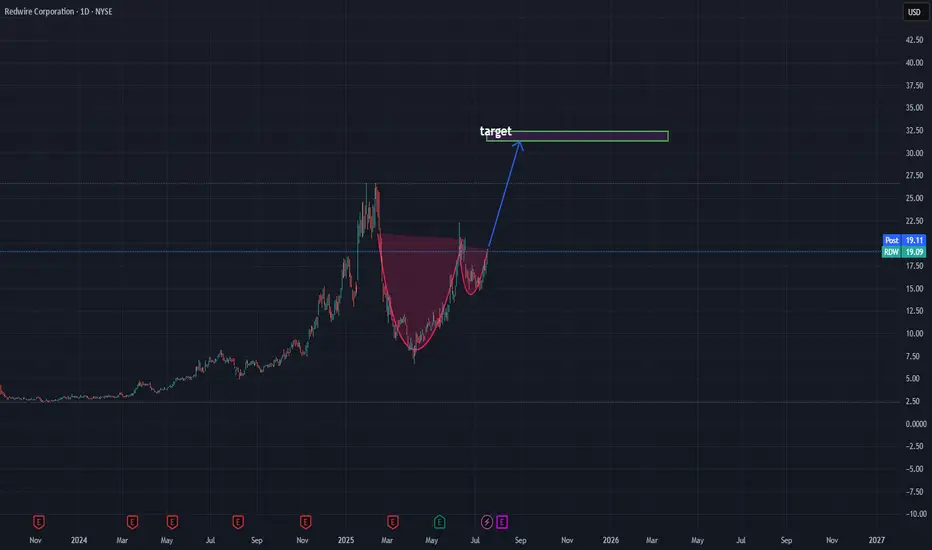
long for rdwlong NYSE:RDW
This content is for informational and educational purposes only and does not constitute financial, investment, or trading advice. I am not a licensed financial advisor. Any opinions, analyses, or forecasts are my own and are subject to change without notice. Always do your own research and consult with a qualified financial advisor before making any investment decisions. Trading involves risk, and you should only trade with capital you can afford to lose. Past performance is not indicative of future results.
ur welcome.
H3VL1N