Lockheed 25-07-14 - 467 USD - moving higherLockheed with high demand for following products:
- Himars
- F -35
- rockets for Patriot System
Gap around 540 USD. Moving average preparing for golden cross.
Expect 540 USD within 12 Months.

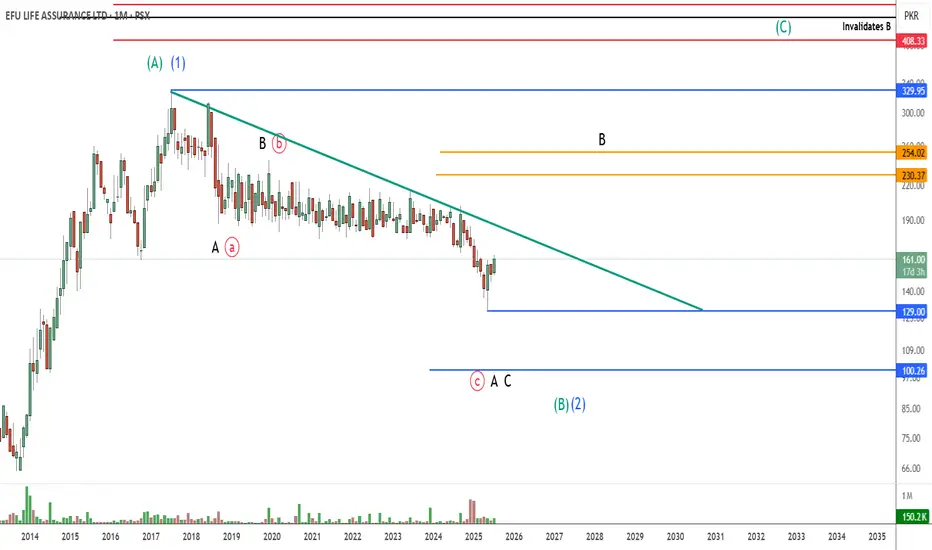
EFUL PROBABLY IN WAVE ' C ' OR ' 3 ' - LONGEFUL is most probably in wave C or 3
We are long term investor on this trade as the overall fundamentals are strong and the long term risk/reward ratio for this trade is very attractive.
Currently the price is in a lesser degree wave C which is almost finished or will finish soon starting an upside rally. If our wave count is correct then the lesser degree wave C is over and the bigger wave C or 3 has just started which will take prices toward 450 levels or even further up above 550 levels but this trade can take years to complete.
There's also a possibility that the lesser degree wave C is still in progress and will take prices further down towards 120 - 100 levels which will make this a more attractive buy trade.
Alternate wave count suggest of a wave B which will also take prices upward, however the target levels will change significantly i.e. 230 - 250 levels
We are already active in this trade and will accumulate more positions in EFUL if prices go below toward 120-100 levels
Let see how this plays, Good Luck!
Disclaimer: The information presented in this wave analysis is intended solely for educational and informational purposes. It does not constitute financial or trading advice, nor should it be interpreted as a recommendation to buy or sell any securities.
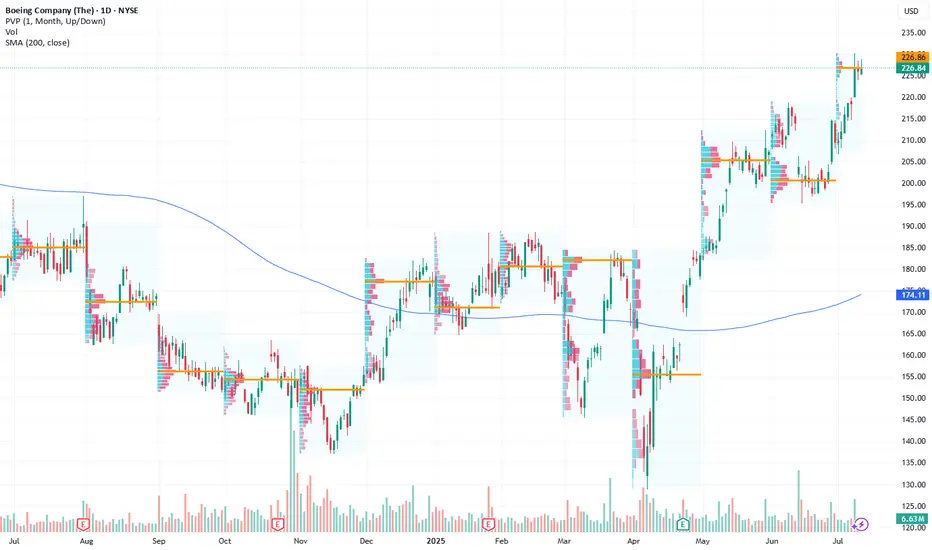
Long Opportunity: Boeing Could Take Flight Next WeekCurrent Price: $226.84
Direction: LONG
Targets:
- T1 = $233.00
- T2 = $238.00
Stop Levels:
- S1 = $223.00
- S2 = $218.00
**Wisdom of Professional Traders:**
This analysis synthesizes insights from thousands of professional traders and market experts, leveraging collective intelligence to identify high-probability trade setups. The wisdom of crowds principle suggests that aggregated market perspectives from experienced professionals often outperform individual forecasts, reducing cognitive biases and highlighting consensus opportunities in Boeing.
**Key Insights:**
Boeing continues to be a key player in the aerospace industry. Strong demand in its commercial airplane segments, coupled with resilient defense contracts, provides the company with stability. The ongoing recovery in airline travel globally adds further momentum to growth, presenting opportunities to capitalize on this positive outlook. Boeing's concerted efforts to address operational inefficiencies and ramp up production capacity also add value, particularly as the company pivots to meet increasing demand in the commercial aviation industry.
The aerospace giant has also benefited from favorable regulatory measures and accelerated demand recovery in Asia and Europe, key regions for international travel plays. Boeing's focus on ramping up production of the 737 MAX series while maintaining strong growth in its aftermarket services positions it for sustained revenue gains.
**Recent Performance:**
Boeing has demonstrated steady upward movement over recent sessions while largely consolidating within a tight technical range. Volumes have remained consistent, signaling sustained investor confidence despite broader market uncertainties. The current price action shows a favorable risk-to-reward setup approaching key resistance levels.
**Expert Analysis:**
Market sentiment remains optimistic due to strong tailwinds in the commercial aviation sector. Analysts point to Boeing's better-than-expected execution on fulfilling delayed orders, particularly for the 737 MAX. Despite concerns over persistent supply chain disruptions, experts note that Boeing's strategic partnerships and operational agility mitigate the long-term risks. Investors are encouraged by the company's forward guidance, although higher material costs remain a watch point for margins.
Technically, Boeing is testing critical resistance at $230. Analysts view a break of this region as a trigger for additional gains, leading to breakout opportunities toward the $240 level.
**News Impact:**
Boeing recently increased its production targets for 2024 and announced strategic moves to expand global service offerings. Positive sentiment surrounding favorable regulatory measures, coupled with improving demand for replacement planes and international travel, has boosted outlooks. Continued commitments from airline giants to upgrade fleets support robust future order flow.
**Trading Recommendation:**
A long position in Boeing at the current price of $226.84 targets a movement to $233.00 (T1) and $238.00 (T2). Stops should be placed at $223.00 (S1) and $218.00 (S2) to limit downside risks. This trade benefits from near-term positive catalysts, including volume consistency, strong market sentiment, and supportive global travel demand recovery.
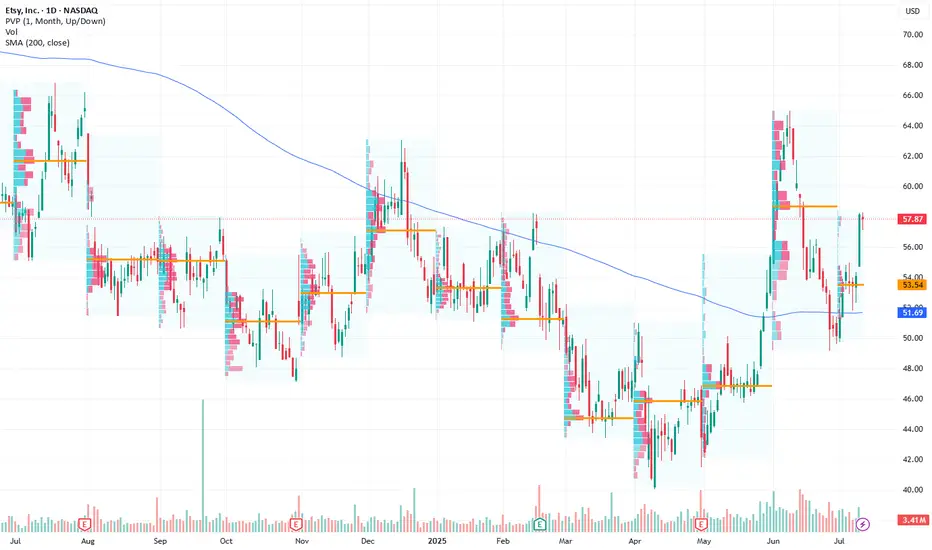
Etsy Positioned for a Strong Bullish Move Next WeekCurrent Price: $57.87
Direction: LONG
Targets:
- T1 = $60.50
- T2 = $64.00
Stop Levels:
- S1 = $56.00
- S2 = $54.50
**Wisdom of Professional Traders:**
This analysis synthesizes insights from thousands of professional traders and market experts, leveraging collective intelligence to identify high-probability trade setups. The wisdom of crowds principle suggests that aggregated market perspectives from experienced professionals often outperform individual forecasts, reducing cognitive biases and highlighting consensus opportunities in Etsy.
**Key Insights:**
Etsy has broken out of a descending wedge pattern, a bullish technical indicator that frequently signifies the end of a downturn and a shift in market sentiment. This breakout is complemented by a “golden cross” formation, where a short-term moving average crosses above its long-term counterpart, often associated with sustained bullish trends. These technical patterns, paired with increasing volume during the breakout, indicate growing investor confidence and the potential for significant upward momentum in the near term.
The company’s niche focus on craft-based e-commerce positions it well amid trends favoring small business support and unique products, adding further long-term growth potential. Recent volume-weighted metrics also show positive divergence, signaling underlying demand even during market-wide hesitations.
**Recent Performance:**
Etsy has recently recovered from a multi-month decline, trading at $57.87 after forming a strong support base around $54. This recovery has been marked by increasingly higher lows and higher highs, confirming the presence of an uptrend. The breakout from its descending wedge pattern was accompanied by above-average trading volume, underscoring market conviction in the move.
**Expert Analysis:**
Analysts are optimistic about the breakout’s implications, citing the combination of technical indicators that suggest Etsy is entering a bullish zone. A short-term target range between $60 and $64 aligns with Fibonacci retracement levels from prior downturns, while a long-term price objective could extend significantly higher if the upward trajectory sustains. The golden cross and robust RSI levels further validate a bullish stance, suggesting that momentum is far from peaking.
**News Impact:**
No major news headlines have directly driven Etsy’s recent movements, but broader macroeconomic factors, such as holiday season spending increases and potential improvements in consumer sentiment, could provide additional tailwinds. Furthermore, Etsy’s unique marketplace offering remains a draw for consumers even amid economic uncertainty, which could shield it from industry-specific headwinds.
**Trading Recommendation:**
With Etsy showing clear signs of bullish momentum and technical breakout patterns, a long position is recommended for traders seeking short- to medium-term gains. The initial target at $60.50 and the secondary target at $64.00 present attractive profit areas, while stop levels at $56.00 and $54.50 provide ample downside protection. This trade setup is supported by the confluence of technical signals, recent performance trends, and the company’s stable market positioning.
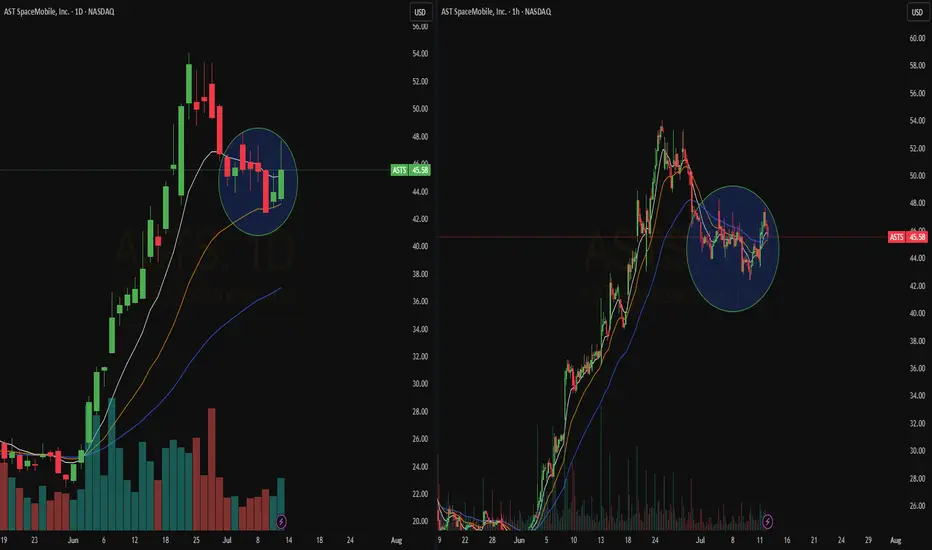
Quick View : $ASTSThe daily sees a test of the average EMA21 while the hourly tf already shows up a bullish crossover .
Looking for a new high above that level
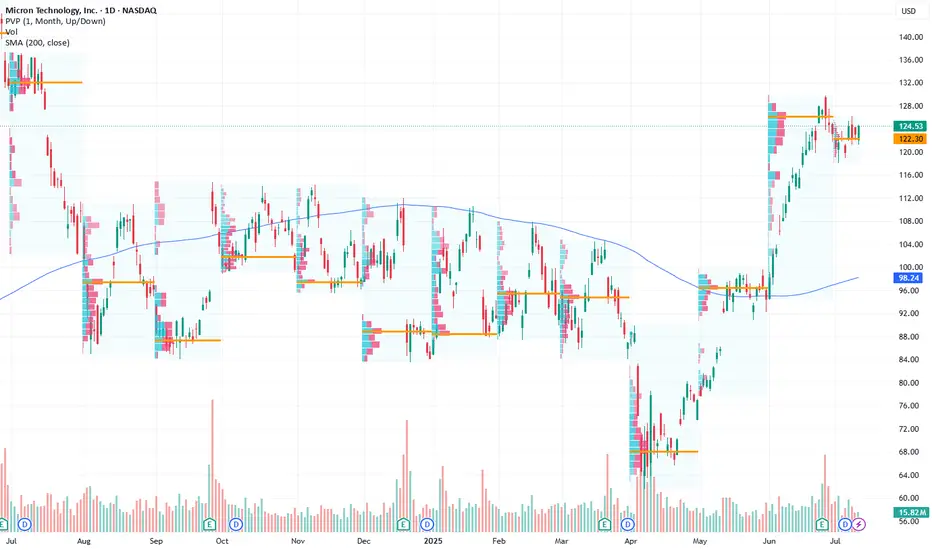
Micron Technology Inc.: Optimistic Long-Term Outlook Driven by ACurrent Price: $124.53
Direction: LONG
Targets:
- T1 = $128.50
- T2 = $130.00
Stop Levels:
- S1 = $123.00
- S2 = $120.00
**Wisdom of Professional Traders:**
This analysis synthesizes insights from thousands of professional traders and market experts, leveraging the collective intelligence to identify high-probability trade setups. The wisdom of crowds principle suggests that aggregated market perspectives from experienced professionals often outperform individual forecasts, reducing cognitive biases and highlighting consensus opportunities in Micron Technology Inc.
**Key Insights:**
Micron Technology Inc. (MU) remains a leading semiconductor company well-positioned to benefit from AI-driven demand for high-bandwidth memory, a key growth catalyst in the sector. Despite broader sector challenges with technical divergences, a break above the $130 resistance level could signal continued bullish momentum, while holding the $120 support level is critical to avoid triggering downside risks. Investors should carefully monitor price movements and geopolitical developments for directional cues.
**Recent Performance:**
Micron has traded within a tight range recently, reflecting a period of consolidation as investors weigh AI growth prospects against broader semiconductor market uncertainties. The stock has demonstrated notable relative strength, supported by positive macroeconomic trends. However, it remains vulnerable to external pressures, such as tariffs and concerns over China's economic stability.
**Expert Analysis:**
Industry experts project strong long-term demand for semiconductors driven by AI applications, with Micron benefiting from its leadership in memory technology. Optimism is underpinned by growing investments in data centers and cloud computing. Nevertheless, analysts urge caution due to potential near-term headwinds stemming from technical signals, geopolitical challenges, and macroeconomic factors such as demand fluctuations.
**News Impact:**
Reports of China's economic slowdown and upcoming policy decisions could significantly influence Micron’s short-term price movements. Additionally, developments related to tariffs and supply chain dynamics remain pivotal for assessing risks. The overarching AI growth story continues to be a key driver of optimism, which bolsters the long-term outlook for Micron’s growth narrative.
**Trading Recommendation:**
In light of Micron’s strong positioning in AI-driven markets, traders may consider a LONG position, with an entry at current levels ($124.53) and initial targets set at $128.50 and $130.00. Stops should be set conservatively at $123.00 and $120.00 to safeguard against downside risks. Carefully track any geopolitical or macroeconomic developments that might affect the broader semiconductor sector.
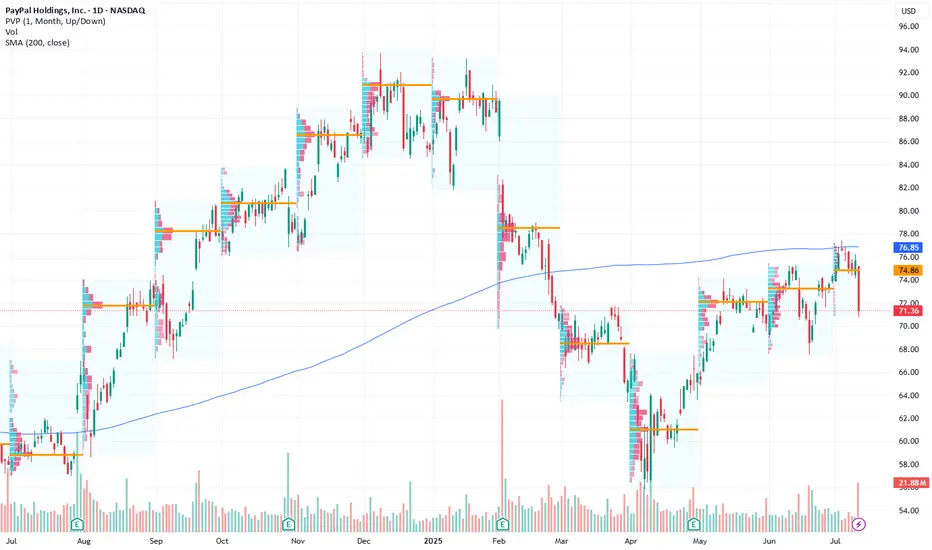
PayPal: Short Position Recommended as Bearish Divergence SignalsCurrent Price: $71.36
Direction: SHORT
Targets:
- T1 = $69.00
- T2 = $66.50
Stop Levels:
- S1 = $73.00
- S2 = $74.50
**Wisdom of Professional Traders:**
This analysis synthesizes insights from thousands of professional traders and market experts, leveraging collective intelligence to identify high-probability trade setups. The wisdom of crowds principle suggests that aggregated market perspectives from experienced professionals often outperform individual forecasts, reducing cognitive biases and highlighting consensus opportunities in PayPal.
**Key Insights:**
PayPal is currently showing bearish divergence on its technical charts. This pattern signals potential downward pressure in the near term, as momentum indicators weaken in alignment with subdued price action. Increased competition from fintech rivals like Stripe and Shopify, coupled with slowing transaction volume due to macroeconomic headwinds, further exacerbates the bearish outlook. Regulatory scrutiny over Buy Now Pay Later (BNPL) services and cryptocurrency initiatives has also dampened investor sentiment, adding to immediate challenges.
**Recent Performance:**
The stock has consistently underperformed relative to the broader market indices in recent weeks. Recent price movements indicate a lack of momentum, as resistance levels hold firm and sellers dominate. The fintech sector as a whole has struggled to regain investor confidence amid rising interest rates and overall market uncertainty.
**Expert Analysis:**
While PayPal remains a long-term innovator in digital payments with a diverse ecosystem including Venmo and other strategic assets, analysts have shifted focus to short-term concerns. Sizable growth in competition from nimble startups and well-funded businesses is eroding PayPal's market share. Additionally, its earnings growth has plateaued in recent quarters, with slowing active user growth underpinning these challenges. The stock's valuation appears stretched given the competitive pressures and an uncertain macroeconomic backdrop.
**News Impact:**
Recent developments, such as PayPal's exploration into blockchain initiatives and partnerships with global payment platforms, highlight its forward-thinking strategy. However, the immediate market reaction has been muted due to concerns over execution risk and the pace of e-commerce growth normalization post-pandemic. Until breakthrough results emerge from these initiatives, the short-term outlook remains bearish.
**Trading Recommendation:**
Given the bearish divergence and weak price momentum, a short position is recommended for PayPal at the current price of $71.36. A target of $69.00 (T1) and a secondary target of $66.50 (T2) provide lucrative reward potential. For risk management, place stops at $73.00 (S1) and $74.50 (S2). Traders should remain vigilant for any macroeconomic developments or earnings updates that could alter sentiment.
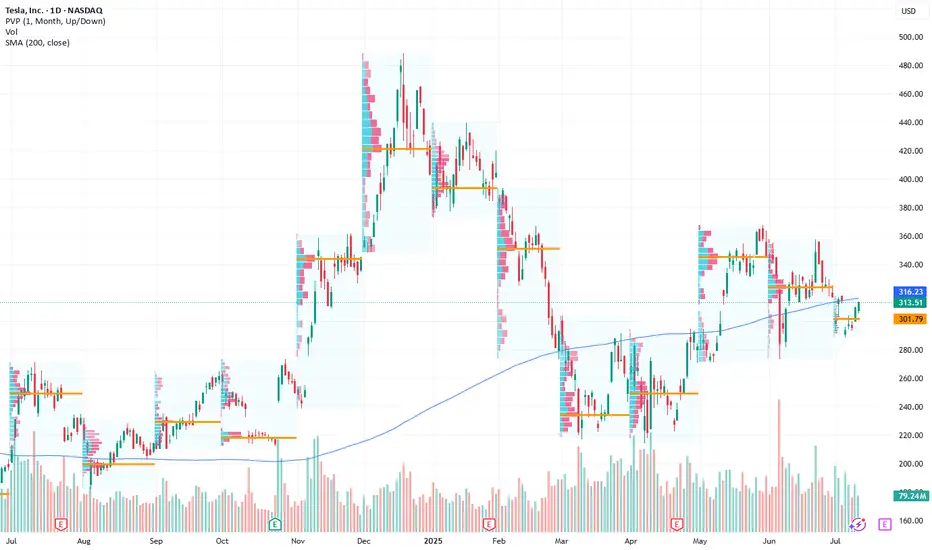
Tesla’s Next Move: Bullish Play Amid AI and Volatility Current Price: $313.51
Direction: LONG
Targets:
- T1 = $319.00
- T2 = $329.15
Stop Levels:
- S1 = $307.75
- S2 = $303.60
**Wisdom of Professional Traders:**
This analysis synthesizes insights from thousands of professional traders and market experts, leveraging collective intelligence to identify high-probability trade setups. The wisdom of crowds principle suggests that aggregated market perspectives from experienced professionals often outperform individual forecasts, reducing cognitive biases and highlighting consensus opportunities in Tesla.
**Key Insights:**
Tesla’s recent AI innovation and its expanding robo-taxi footprint signal long-term growth potential while short-term volatility requires strategic entry points. Market sentiment has significantly improved with positive news about the integration of Gro 4 AI, enhancing Tesla’s autonomous vehicle advancements. Trading at critical levels, Tesla offers a potential buying opportunity near key support zones.
The rallying investor focus on Tesla’s technological edge places it among the leaders in automation-driven growth. Despite macroeconomic pressures, Tesla’s proactive efforts in leveraging cost efficiencies and scaling autonomous solutions are helping to sustain bullish momentum.
**Recent Performance:**
Tesla demonstrated notable resilience during a turbulent earnings season, holding strong amidst mixed market signals. Recent delivery figures reflected a 13% year-over-year decline, which stirred concerns. Yet, the stock was buoyed by positive AI-related news and the market-wide optimism surrounding automation technologies, enabling Tesla to maintain its pivotal price range.
**Expert Analysis:**
Analysts acknowledge Tesla’s robust innovation pipeline centered around driver assistance and robo-taxi functionality powered by the Gro 4 AI platform. Concerns related to Elon Musk’s focus and governance have tempered enthusiasm for some traders, but these have largely been offset by Tesla’s strategic actions to sustain revenue and growth. Tesla’s prominent role in setting the market narrative for autonomous vehicles and broader EV adoption ensures ongoing support from long-term investors.
Tesla’s recent moves are growing investor confidence as it seeks to hedge against broader economic uncertainties and mitigate risks around regulatory changes. Its expansion strategy continues to highlight its leadership within the EV space, while early adopters of its AI-driven solutions may set the pace for sustainable revenue expansion.
**News Impact:**
The integration of Gro 4 AI is expected to significantly enhance Tesla’s robo-taxi and autonomous vehicle functionality, enabling it to capture market share in urban mobility services. Tesla’s announcement of an expanded robo-taxi fleet targeting key metropolitan areas could help offset delivery declines and drive future recurring revenues. While concerns about Elon Musk’s governance persist, ongoing innovation continues to support Tesla’s bullish outlook in global EV markets.
**Trading Recommendation:**
Tesla’s current price action signals an advantageous entry point for a long position, reinforced by recent bullish news and industry-leading innovations. Short-term traders can target $319.00 and $329.15 while maintaining disciplined stop-loss levels at $307.75 and $303.60. With strong support from institutional sentiment and expanding AI applications in its product line, Tesla offers substantial upside for bullish investors.
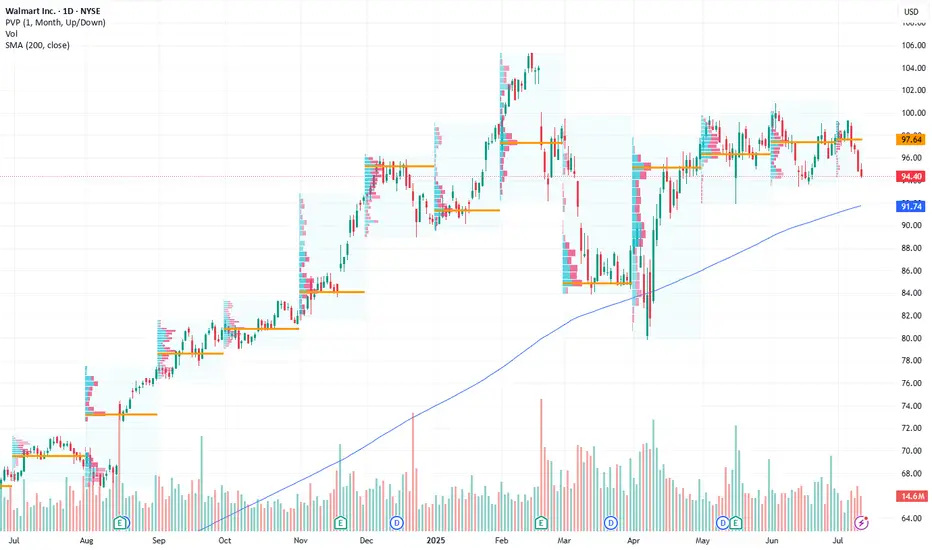
Walmart: Retail Giant Positioned for Growth Amid Bullish MomentuCurrent Price: $94.40
Direction: LONG
Targets:
- T1 = $98.20
- T2 = $101.80
Stop Levels:
- S1 = $92.10
- S2 = $90.40
**Wisdom of Professional Traders:**
This analysis synthesizes insights from thousands of professional traders and market experts, leveraging collective intelligence to identify high-probability trade setups. The wisdom of crowds principle suggests that aggregated market perspectives from experienced professionals often outperform individual forecasts, reducing cognitive biases and highlighting consensus opportunities in Walmart.
**Key Insights:**
Walmart continues to demonstrate resilience within the retail sector, benefiting from strong consumer spending trends. Its position at the 200-day simple moving average (SMA) indicates a key technical support level, providing investors with an attractive entry point for potential upside. As e-commerce gains momentum, Walmart’s operational strengths, bolstered by strategic pricing and logistics, emphasize its long-term growth potential. Consumer discretionary spending remains robust despite inflationary pressures, solidifying Walmart's steady trajectory.
The company's push into hybrid models of shopping, blending in-store and online experiences, has given it a significant edge over competitors. With strong leadership and strategic investments in technology and supply chain efficiencies, Walmart has proactively positioned itself for sustained profitability.
**Recent Performance:**
In recent sessions, Walmart’s price has shown resilience by maintaining stability at the $94 range, aligning closely with its 200-day SMA. Despite broader market volatility, bullish sentiment in the retail sector has supported investor confidence. Comparatively, Walmart has showcased better performance than many of its peers in controlling costs while expanding its digital footprint.
**Expert Analysis:**
Market experts view Walmart as a bellwether of the retail industry. Its ability to balance cost leadership with quality offerings underscores a competitive advantage. This analysis shows optimism for Walmart's e-commerce investments and operational efficiency. Technical indicators such as a narrowing Bollinger band suggest potential volatility expansion, which combined with recent upward price action, hints at possible bullish momentum. Indicators of increasing relative strength support the potential for breakout levels.
**News Impact:**
Retail activity has been positively influenced by consumer interest in savings-focused platforms, with Walmart emerging as a primary destination. Events like Amazon Prime Day indirectly bolster competition, driving visibility toward Walmart's comparable discount strategies. Additionally, Walmart's robust supply chain measures have ensured product availability, catering to high consumer expectations and supporting its market credibility.
**Trading Recommendation:**
With Walmart holding key technical support levels and benefiting from strong consumer trends, a long position appears substantiated. Traders should consider entering near the current price with stops placed below $92 for risk mitigation. Price targets at $98.20 and $101.80 reflect meaningful upside potential spurred by favorable market dynamics and Walmart’s strategic initiatives.
Shriram financeShowing bullish signal.
But there is resistance after 8 to 9%
So define your SL before leap into it.
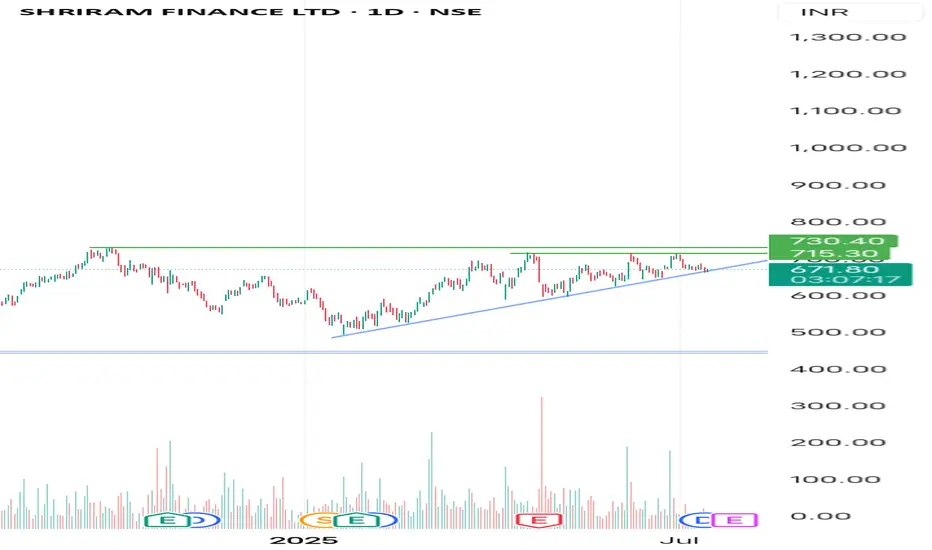
LongThis stock has broken its resistance level and trending with good volumes. We can take a swing trade in this stock with an SL of 6% and with target of 30%. Our profit and loss ratio is 1:5.
Points to remember:
* Take trade at current CMP.
* SL at point 1065.
* Target at point 1480.
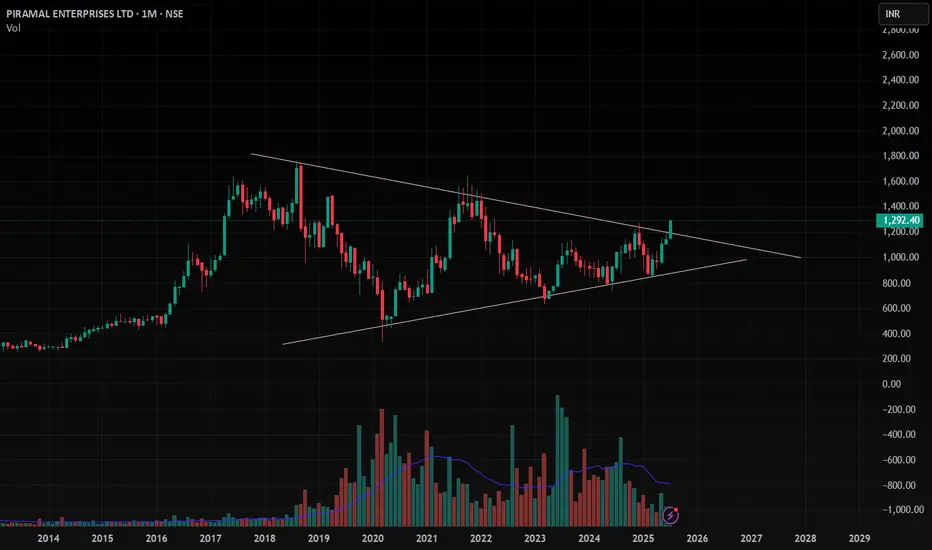
PEL , 1M , BullishThe Triangle Pattern is Breaking Out in Monthly Time Wait for Strong and Perfect close in Weekly Time and Enter after Confirmation .
Take Risk According to your capital
Follow for more ideas like this
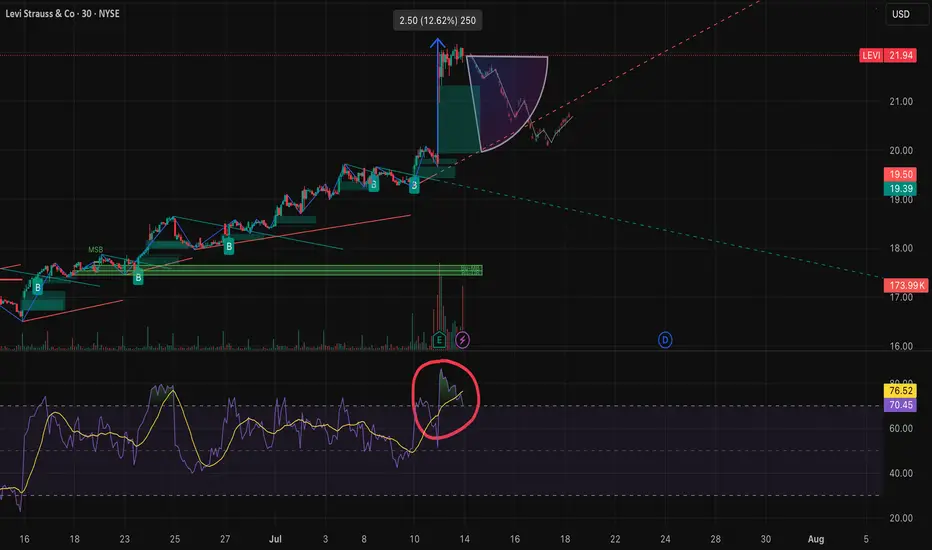
“How Other People’s Fear Becomes Our Profit”From a behavioral and technical standpoint, LEVI presents a textbook short opportunity following its post-earnings overreaction. After a strong earnings beat, the stock surged over 13% intraday, reaching a high of $22.07. However, this rally quickly pushed RSI into overbought territory, triggering natural selling pressure. Much of this sell-off can be attributed to traders who previously bought near the $21–$22 range and are now looking to exit at breakeven—a classic example of loss aversion and anchoring bias. This emotional response often leads to temporary price spikes followed by sharp corrections. We are now observing that exact pattern, with the stock fading to $21.92 in after-hours and closing at $21.95, signaling buyer exhaustion.
Technically, this marks a short-term trend reversal—from bullish earnings momentum to a developing downtrend. The price action shows rejection at key resistance, weakening volume, and emotional exit zones being triggered. Now is a clean, high-probability shorting opportunity, with potential to capture 2–7% downside in the next 1–2 sessions, especially as the broader market reacts to inflated valuations and profit-taking behavior.
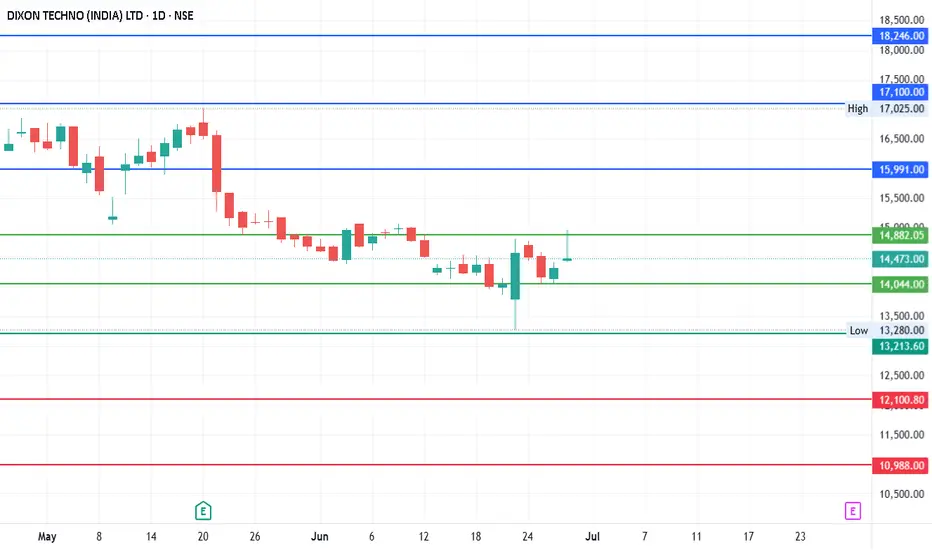
#DIXON - 4000 Pts move coming? 18246 or 9842.00?Date: 24-05-2025
#Dixon
Current Price: 14473
Pivot Point: 14044.00 Support: 13213.60 Resistance: 14882.04
Upside Targets:
Target 1: 15991.02
Target 2: 17100.00
Target 3: 18246.00
Target 4: 19392.00
Downside Targets:
Target 1: 12100.80
Target 2: 10988.00
Target 3: 9842.00
Target 4: 8696.00
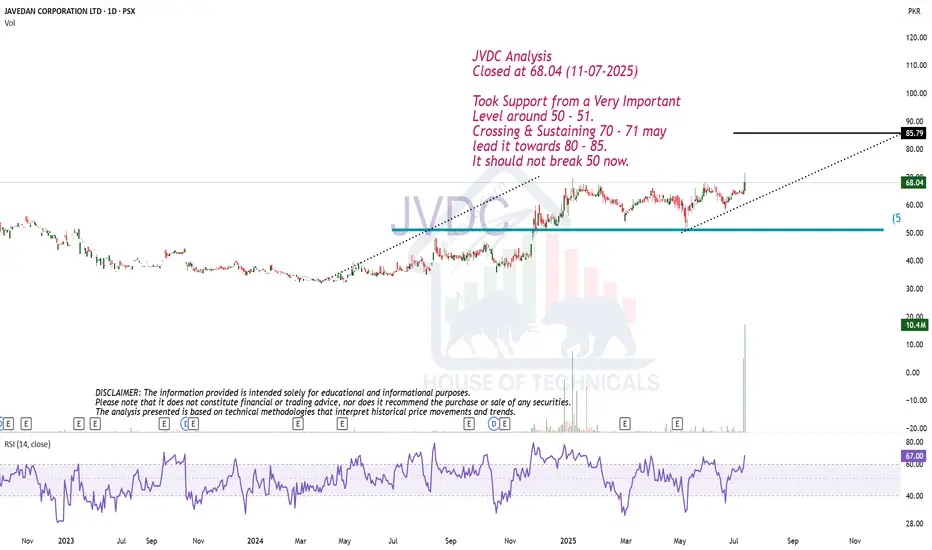
ABCD Possible.JVDC Analysis
Closed at 68.04 (11-07-2025)
Took Support from a Very Important
Level around 50 - 51.
Crossing & Sustaining 70 - 71 may
lead it towards 80 - 85.
It should not break 50 now.
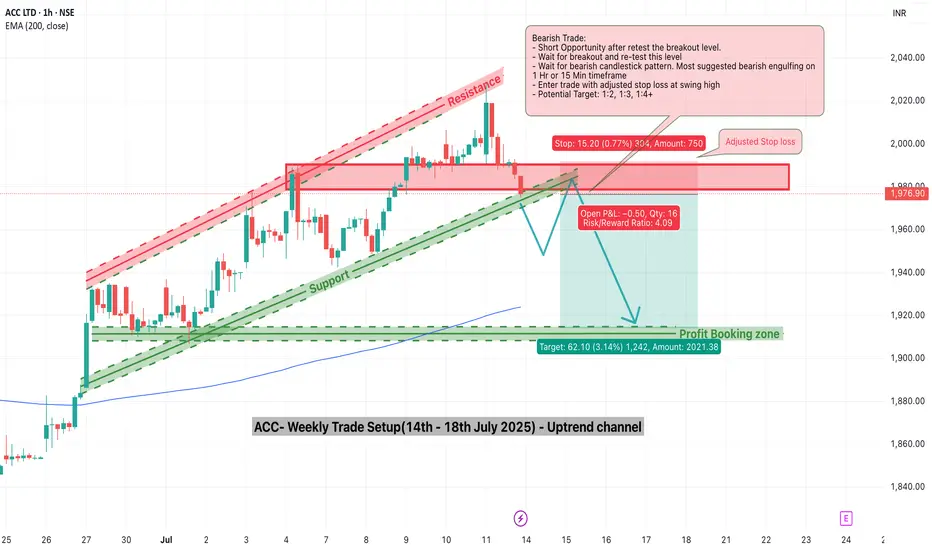
ACC Trade Setup for the Week(14–18 July 2025) – Uptrend ChannelACC Ltd. (NSE: ACC) has been trading inside a clean uptrend channel for the past few weeks, bouncing consistently between rising support and resistance. Now, it approaches a critical inflection point — the lower support of the channel.
While no breakdown has occurred yet, the structure is weakening, and a bearish opportunity may soon present itself. Let’s explore how to trade this if the setup confirms.
1. What’s Happening on the Chart?
ACC is trading close to the channel support zone (~₹1975).
The resistance zone near ₹2000–₹2020 has held strong.
A potential breakdown below the rising green support trendline could trigger a bearish move toward the ₹1910–₹1920 demand zone.
But nothing is confirmed yet — this is a watchlist setup.
2. Trade Setup – Conditional Bearish Opportunity
✅ Trade Plan:
Wait for breakdown of the rising support line.
After breakdown, wait for a re-test of the broken support zone (~₹1975–₹1980).
Look for bearish confirmation via a candlestick pattern (engulfing or strong rejection) on the 15-min or 1-hour timeframe.
🚨 Entry Trigger:
Only enter short if re-test holds and price starts reversing.
📉 Stop Loss:
SL should be above the re-test high (around ₹1990–₹1995).
🎯 Target:
Profit booking zone: ₹1910–₹1920.
Potential R:R: 1:2, 1:3, or even 1:4 depending on entry.
3. Why This Setup Matters
Trend exhaustion is visible near the upper resistance of the channel.
A clean breakdown + re-test gives a low-risk entry.
The 200 EMA lies near the target zone, providing confluence for mean reversion.
4. What If There’s No Breakdown?
If price respects the support and bounces again, no trade should be taken on the short side.
In that case, look for possible bullish reversal signals back toward channel resistance — or stay neutral.
5. Final Thoughts
This is a highly conditional setup — and patience is the key. Don’t jump the gun. The best trades happen after confirmation.
🔔 What to watch this week:
Breakdown below ₹1975 support
Re-test and rejection from ₹1975–₹1985
Confirmation candle (bearish engulfing)
Only then consider a short trade toward ₹1910 with a well-placed SL.
Plan your trade. Wait for structure. Trade only when the market shows its hand.
EPQL - Swing Trade SetupThe current price action is testing the support of an ascending parallel channel. A potential pullback from the 26 level, which aligns with the channel's support, is anticipated. If the price rebounds from this level, a swing trade setup could be confirmed, with a possible target of 38.
However, the MACD indicator has recently crossed over to the downside on weekly time frame, with red histograms forming. To confirm a more reliable entry point, we will await a reversal signal from the MACD indicator.

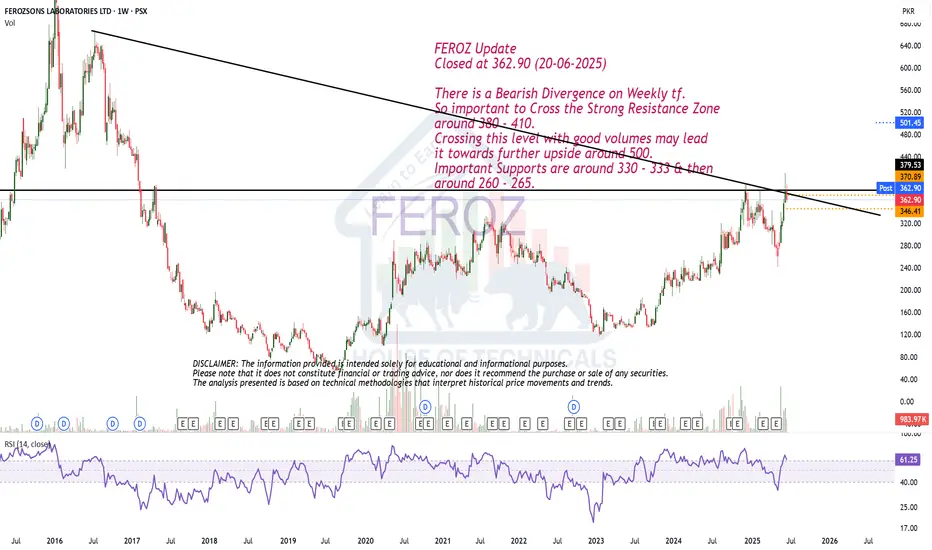
Bearish Divergence on Weekly tf.FEROZ Update
Closed at 362.90 (20-06-2025)
There is a Bearish Divergence on Weekly tf.
So important to Cross the Strong Resistance Zone
around 380 - 410.
Crossing this level with good volumes may lead
it towards further upside around 500.
Important Supports are around 330 - 333 & then
around 260 - 265.
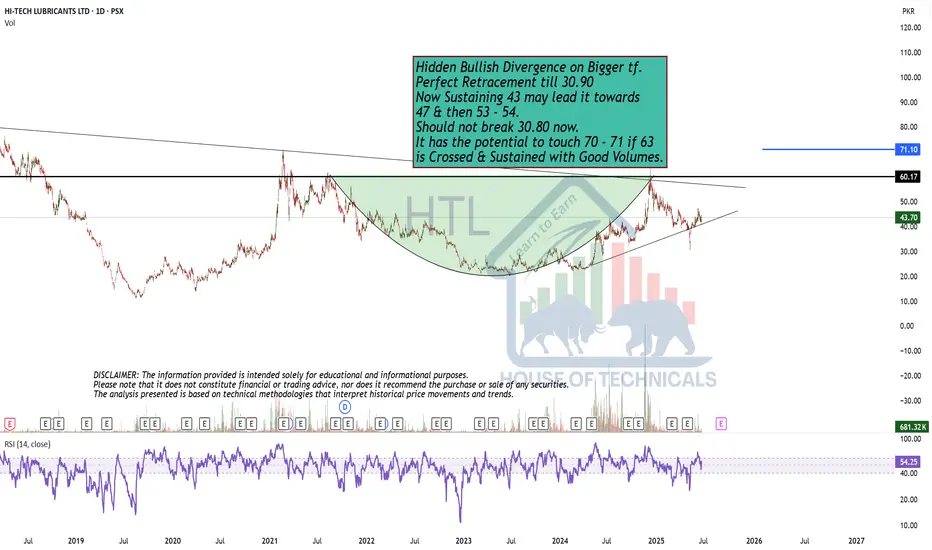
Perfect Retracement till 30.90Hidden Bullish Divergence on Bigger tf.
Perfect Retracement till 30.90
Now Sustaining 43 may lead it towards
47 & then 53 - 54.
Should not break 30.80 now.
It has the potential to touch 70 - 71 if 63
is Crossed & Sustained with Good Volumes.
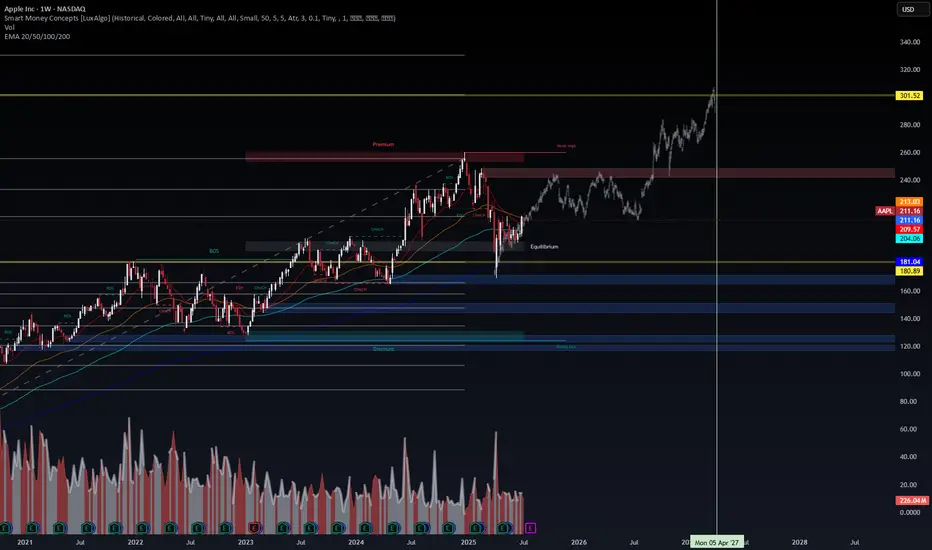
$AAPL | Smart Money Concepts Weekly DSS Update Apple ( NASDAQ:AAPL ) is approaching a critical decision zone on the weekly SMC structure, where liquidity, volume, and macro pressure converge.
🔎 Key Observations (WaverVanir DSS):
🔺 Premium Zone (240–260) acting as a weak high with multiple CHoCH & BOS confirmations
🔻 Major equilibrium level at ~$181 aligns with EMA 200 & potential downside sweep
📈 Projected upside target: $301.52, contingent on reclaiming premium zone
📉 Breakdown watch: If $211 fails, next liquidity pockets sit between $181 and $120
⚙️ Volume Profile shows divergence—price rally on declining volume = possible distribution pattern.
🌐 Catalysts to Monitor:
Q3 earnings (E icon on chart)
China iPhone demand
US macro (Fed policy, CPI, yield curve shifts)
🧠 DSS Probability Bias:
Neutral to Slight Bullish (17/25 score)
→ Expect volatility with directional bias forming post-premium test.
📊 Trade Management:
Wait for confirmation above $260 for continuation
Or short-term bearish setups if price stalls below EMA cluster (~$213)
🧠 Posted by WaverVanir DSS | Quant x Macro x Liquidity Driven
#AAPL #SmartMoney #TradingView #MarketStructure #VolumeProfile #LiquidityZones #QuantAnalysis #WaverVanir #AppleStock #MacroTrading #OptionsFlow #TradingSignals #RiskManagement
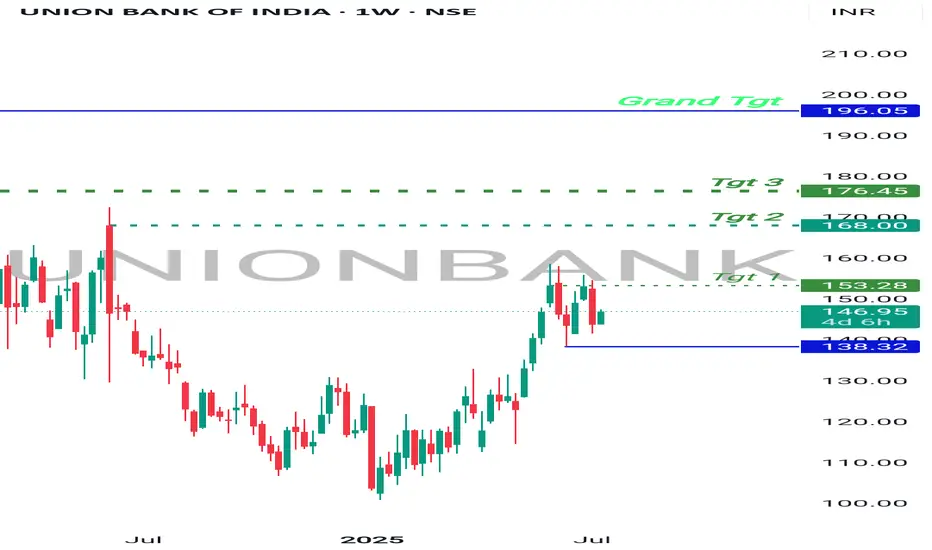
Bullish Bet , UnionBankBanknifty at support.
UnionBank on recent high making sideways moves, which means consolidation.
Once Banknifty Bounce back, UnionBank will break the resistance on weekly and monthly Basis and will start moving higher.
It has higher targets on a short and long term investment.
Good to hold for short term.