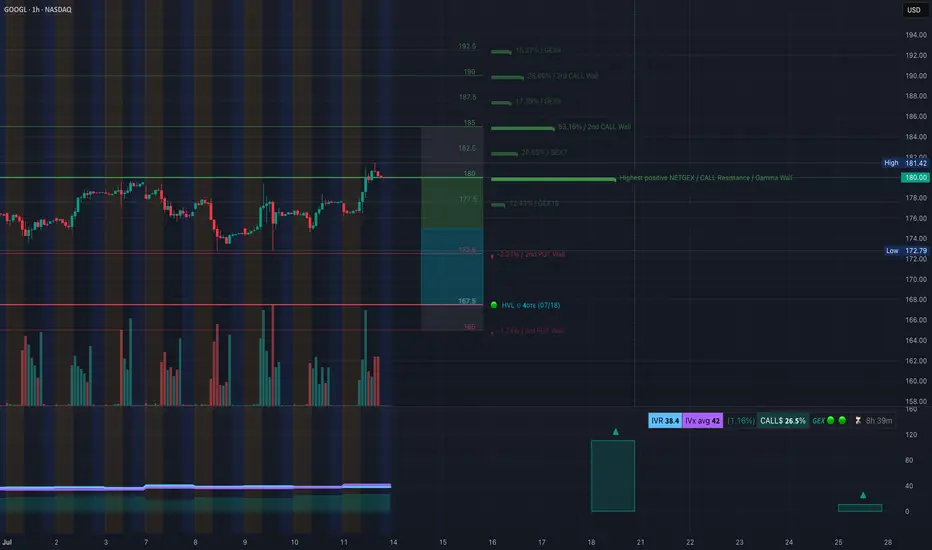
GOOGL Eyeing a Gamma Launch Above $182. for July 14🔹 GEX Options Sentiment Analysis
* Gamma Resistance Zone:
The $180 level marks the highest positive Net GEX / Call Wall, making it a magnet and potential resistance for GOOGL.
Above that:
* $182.5 = 2nd Call Wall
* $185 = 3rd Call Wall
* $186.43 is the extreme call zone from GEX
* Put Walls (Support):
* $172.5 = 2nd Put Wall
* $167.5 = HVL
* $165 = 3rd Put Wall
* IVR & Call/Put Sentiment:
* IVR = 38.4 → moderate implied volatility ranking
* IVX avg = 42
* GEX Score = 🟢🟢🟢 (bullish bias)
* CALLs flow = 26.5% net positive
🔸 Implication:
With price above $180 gamma wall and still pushing into $182.5–$185 range, GOOGL is positioned for a potential gamma squeeze, especially if volume supports a move over $182.5.
💡 Options Trade Suggestion Based on GEX
Bullish Scenario:
* 📈 GOOGL 182.5C 07/19 or 07/26
* Entry: On break and hold above $181.50
* Target: $185–$186.5
* Stop: Below $179.50
* Reason: Riding gamma squeeze above the GEX resistance wall with strong call flow and IV breakout potential.
Bearish Rejection Scenario (if false breakout):
* 📉 GOOGL 175P 07/26
* Entry: If price rejects $182.5 and breaks below $179
* Target: $174 → $172.5
* Stop: Above $181.20
📊 1H Chart Analysis (SMC Price Action)
* Market Structure:
* Clean Break of Structure (BOS) confirmed above previous highs.
* Price is currently consolidating inside a bearish OB between $180–$181.40.
* Key Levels:
* Support: $178.8 / $177.6
* Demand Zone: $174.65 → $172.79
* Resistance: $182.5 → $185 zone
* Bias: Bullish (as long as price holds above $177.6)
* Trendline: Still being respected, with CHoCH flip bullish.
📍 Trade Setup Based on 1H Chart
Scalping Intraday Long Setup:
* Long above $181.40 (breakout from OB)
* Target: $182.5 → $185
* Stop: Below $179.80
Intraday Short Setup (if rejected):
* Short below $179
* Target: $177.6 → $174.6
* Stop: Above $181.25
🧠 Final Thoughts
GOOGL looks ripe for continuation as long as price remains above the $180 GEX wall. However, failure to clear $182.5 could invite profit-taking. Watch volume into open and how it behaves near the order block range.
Disclaimer: This analysis is for educational purposes only and not financial advice. Trade your plan, manage your risk, and stay adaptive to market conditions.
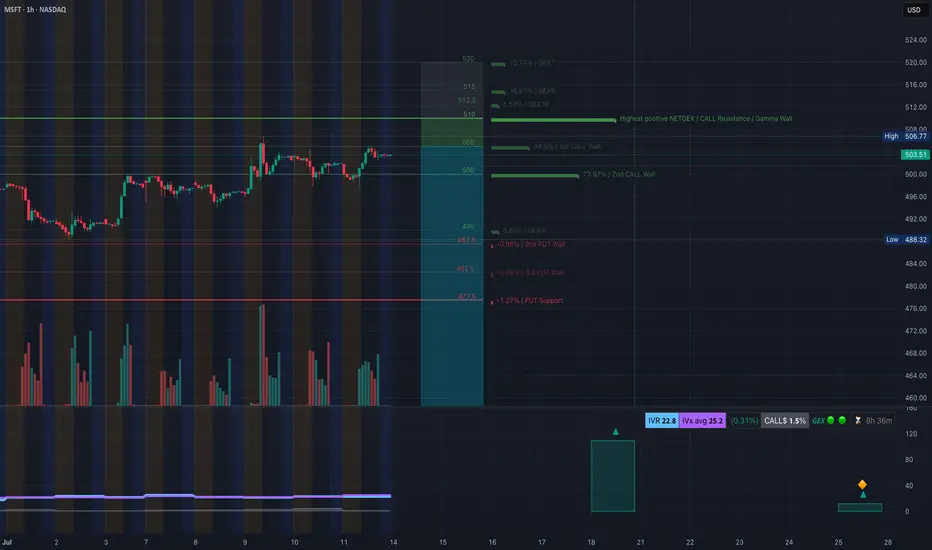
MSFT at Gamma Wall Crossroads–Will 506 Break This Time? July 14🧠 GEX and Options Sentiment (TanukiTrade GEX)
* GEX Zone Summary:
* 📈 Call Wall 1 (503.5–506.7) → major Gamma Resistance.
* 🧱 Gamma Wall (506.77) = Highest positive NETGEX — key sell zone for market makers.
* 🟢 GEX Flow: Moderate call dominance (1.95%) — not yet extreme bullish.
* 🟣 IVR 22.8 (low), IVX avg 25.2 – implied vol remains subdued.
* Options Suggestion:
* ⚠️ A move above 506.8 could trigger dealer hedging and gamma squeeze.
* Trade Idea (Bullish):
* Buy 510C or 515C (Jul 19/Jul 26 expiry) on breakout above 507 with volume.
* Stop: <503. Target: 512/516.
* 🚨 If rejection at Gamma Wall (506.8), fade the move:
* Trade Idea (Bearish):
* Buy 500P or 495P on rejection or candle close below 503.
* Target: 497.8 / 494. Stop: 506.5.
📉 1H Technical Trading Plan (Smart Money Concepts)
* Structure:
* Price made CHoCH → BOS toward 506 zone, now consolidating below resistance.
* Minor rejection seen from inside the purple supply box at 506.
* If bulls hold 501–503 zone, could be prepping a second push.
* Key Levels:
* Support: 501.48 / 497.78 / 494.11
* Resistance: 504.46 / 506.77
* Bias:
* 🟢 Bullish above 504.50, expecting breakout toward 510–512.
* 🔴 Bearish below 501.5, likely drop toward 497.8–495.
* Intraday Trading Setup:
* Scalp Long: Entry 504.5–505. Breakout candle confirmation.
* TP: 507. SL: 503.8
* Scalp Short: Entry <501.3
* TP: 498, SL: 503
* Swing Trade Scenario:
* Enter swing calls above 507. Hold for 515+ next week.
* Enter puts only if breakdown below 497.8 with CHoCH back down.
🎯 Final Thoughts:
MSFT is trading tightly below a significant GEX Call Wall, which often leads to a volatile breakout or strong rejection. If bulls push through 507+, we could see a sharp gamma squeeze into 510–515. However, if this fails, price may fade back toward 495–490 zone quickly. Patience at resistance is key.
Disclaimer: This analysis is for educational purposes only and does not constitute financial advice. Always do your own research and manage risk appropriately.
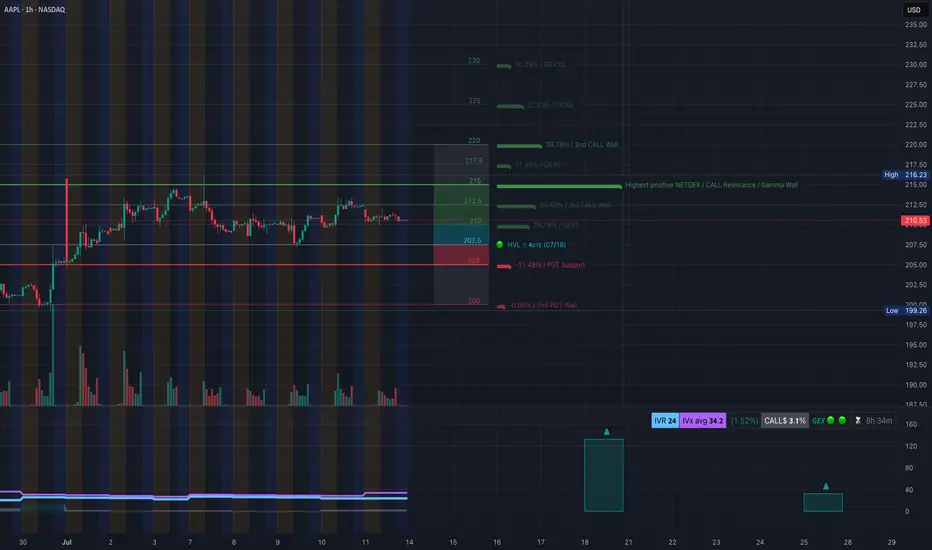
AAPL at a Pivotal Zone! TA for July 14AAPL at a Pivotal Zone! GEX & Price Action Align for Major Move 📉📈
🧠 GEX Sentiment (Options-Based Insight)
* Current Price: $210.53
* GEX Zone Traps:
* Below Price:
* 🟥 Put Support at $205 (-11.48%)
* 🔻 PUT Wall at $200 (-9.06%) — strong floor
* Above Price:
* 🟩 CALL Walls at:
* $212.5 → 29.79% GEX7
* $215 → 38.62% GEX6 (3rd largest resistance)
* $217.5 → 11.45% GEX9
* $220 → 39.78% GEX2 (heavy resistance zone)
* 🟩 Max GEX Cluster: $215–$220
* 🔺GEX10 spike at $230 → unlikely unless squeeze
* IVR/IVX:
* IVR: 24 (low volatility environment)
* IVX: 34.2 → Soft volatility bounce
* Call/Put Flow:
* Calls: 3.1% favored
* GEX trend: 🌕🌕🌕 (Neutral-to-Bullish if over $212.5)
📦 Interpretation:
Gamma compression is strong near $212.5–$215. If AAPL stays above $210.5 and reclaims $212.5, options market opens up space toward $217.5–$220. Below $207.5 = risk of drop toward $205 then $200 PUT wall.
🕹️ Option Trade Ideas Based on GEX
Bullish Strategy (IF Breaks $212.5):
* Trade: Buy AAPL 215c or 217.5c (Jul 19 or 26 expiry)
* Trigger: Hold above $212.5
* Target: $217.5–$220
* Stop: Break below $209.8
Bearish Strategy (IF Breaks $207.5):
* Trade: Buy AAPL 205p or 200p (Jul 19 or 26 expiry)
* Trigger: Loss of $207.5 with momentum
* Target: $205 → $200
* Stop: Reclaim of $210.5
🔍 1-Hour Chart Analysis (Price Action)
* Structure: Sideways consolidation between $207.5–$213.5
* Key Levels:
* Demand: $205–$207.5 (Buyers defended)
* CHoCH (Change of Character) confirmed near $209.8
* Resistance: $213.48 (rejected multiple times)
* Trendline: Rising wedge forming under liquidity sweep zone
* Liquidity Pools: Resting above $215 and below $205
* FVG/OB Zones: Thin FVG at $209.8–210.5 and mid OB around $207
📈 Scenario 1 (Bullish):
* If price bounces off $210 again and breaks $212.5 with volume, watch for sweep of $215–$217.5
* Watch for re-entry above CHoCH/BOS confluence near $211.5
📉 Scenario 2 (Bearish):
* If we break $207.5 and fail to reclaim $210.5 → liquidity vacuum opens toward $205 and $200
✅ My Thoughts & Suggestions
* Direction Bias: Neutral > Bullish if $212.5 is claimed, otherwise range-bound.
* Best Risk/Reward: Wait for $212.5 breakout confirmation OR $207.5 breakdown.
* Scalpers: Use $210.5–212.5 as chop zone — fade edges.
* Swing Traders: Only enter on clear breakouts with stop discipline.
🔒 Disclaimer:
This analysis is for educational purposes only and does not constitute financial advice. Always do your own research and manage your risk before trading.
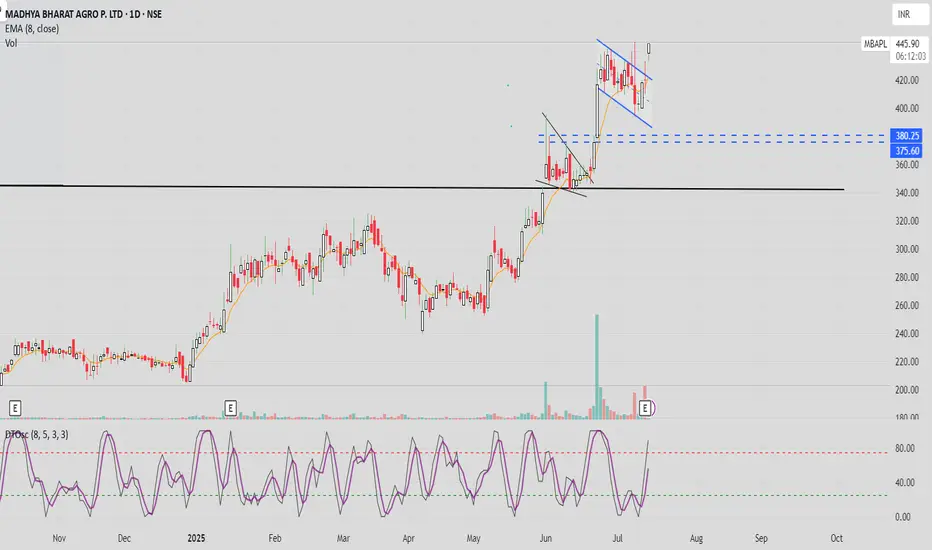
JSWINFRA - Daily time frame StudyFollowing are my Inputs for above chart reading -
1. MACD cross over
2. High volume Breakout of Symmetrical Triangle Pattern - Daily Time frame
3. It may go till weekly resistance line 330-340
This chart is only for educational purpose, Please contact your financial advisor for any trading or investment decisions.

PLTR at a Decision Point! for July 14GEX Walls and Wedge Breakdown Incoming?
🔸 GEX (Gamma Exposure) Breakdown for PLTR:
* Current Price: $141.99
* Key Gamma Resistance Zones:
* 📍 $145.15 – Highest Net Positive GEX (Gamma Wall)
* $144.58 – 2nd CALL Wall
* $146 – Overhead resistance from 2nd wall cluster
* Key Gamma Support Zones:
* $137 – HVL & 1st Put Layer
* $135 – 2nd Put Wall
* $132 – 3rd Put Wall
* $128.51 – GEX Low & Major Put Support
GEX Sentiment:
IVR: 39.3 (moderate)
IVx avg: 66.1
Options Flow Bias: CALL$ 56.7% – Slightly bullish
📈 Options Trade Strategy Based on GEX Zones:
🔹 Scenario A – Rejection from $145.15 (Most Probable):
* Bearish PUT Spread Play:
* Buy: $142.5 PUT
* Sell: $137 PUT (exp 7/19)
* Risk/Reward: Balanced downside toward HVL
* Trigger: If price stays below $142.5 and fails to reclaim $144.58
🔹 Scenario B – Breakout Above $145.15:
* Bullish CALL Play (speculative):
* Buy: $147.5 or $150 CALL
* Target: $155 (GEX9 zone)
* Only if: Price closes strongly above $145.5 on volume
🔸 GEX Outlook Summary:
* Upside capped at $146–$150 unless breakout volume enters
* Downside path to $135 / $132 is smoother if $140 breaks
* Gamma squeeze unlikely unless > $146
🧠 1-Hour Price Action & Intraday Trading Setup
⚙️ Market Structure:
* Trendline Support: Holding from recent rally
* CHoCH formed below resistance, suggesting a potential reversal
* BOS zone near $142.5–$144.6 creating supply
* Rising wedge breakdown forming
📊 Key Zones:
* Support: $140.53 (ascending trendline), then $137 (HVL)
* Resistance: $142.5 → $144.58 → $145.15
* Bearish Bias: As long as price is below $144.6
📉 Intraday Trading Plan (1H)
🔻 Short Setup:
* Entry: If price breaks below $140.50 with momentum
* TP1: $137
* TP2: $135
* Stop Loss: Above $144.60
🔼 Reversal Long (Less Probable):
* Entry: Break and hold above $145.15
* TP: $149.5 → $155
* SL: Below $143.5
🧭 Summary Thoughts:
* PLTR is sitting below strong GEX resistance with rising wedge weakness.
* Bearish structure forming unless bulls reclaim $145+ quickly.
* Favor PUT plays targeting $137–$135 unless breakout proves otherwise.
Disclaimer: This analysis is for educational purposes only and does not constitute financial advice. Always manage risk and do your own due diligence before trading.

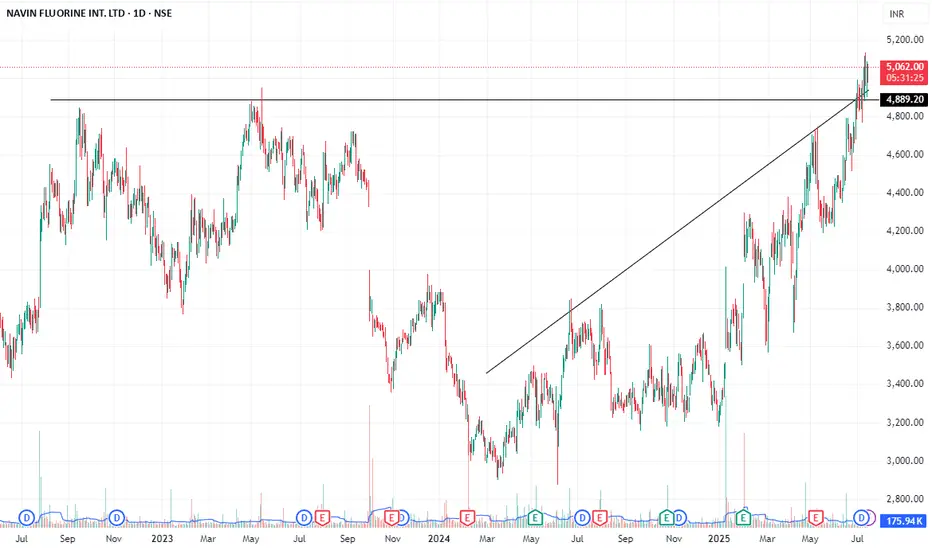
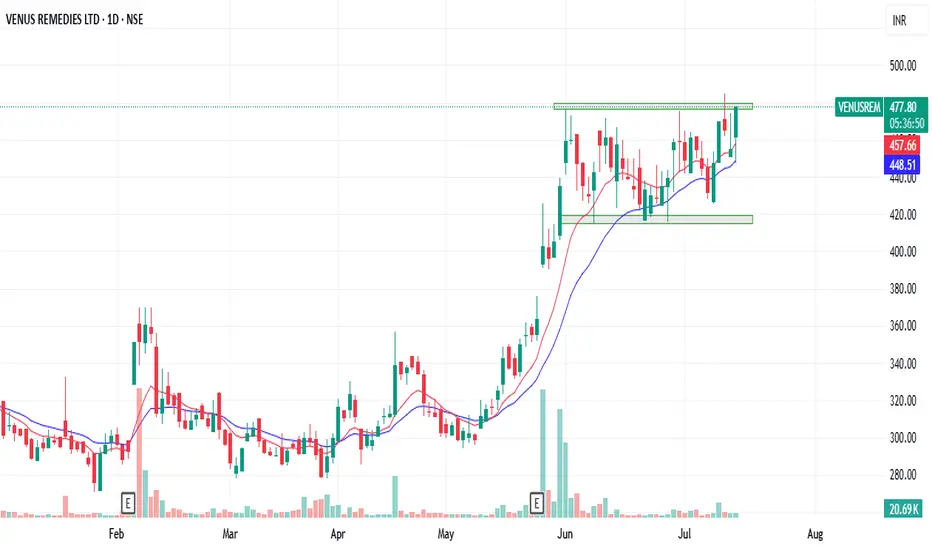
NAVINFLOUR BROKEN ATHNavin flour has broken ATH and looks like a rounding bottom
with very minimum risk with stop of close below 4800 one can go long with target of 6800
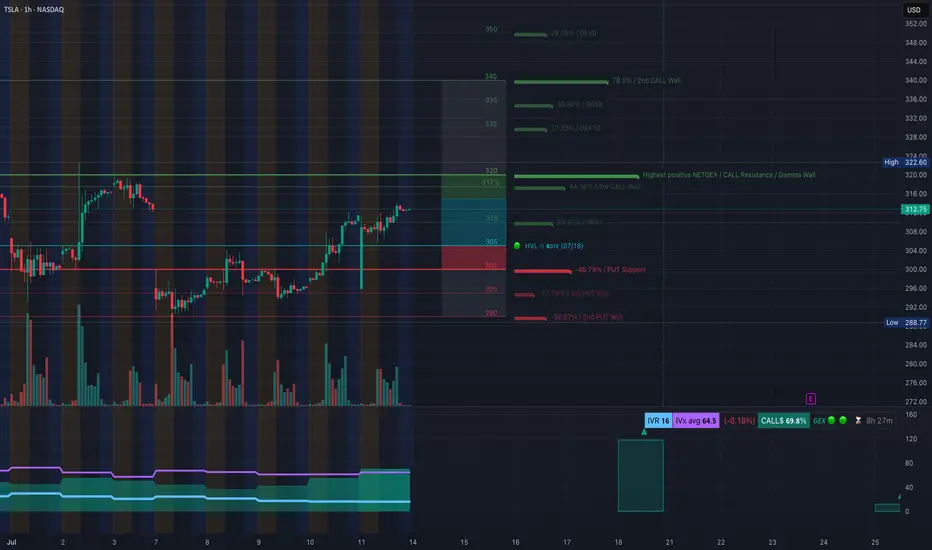
TSLA TA – Call Side Dominance Nearing Resistance-July 14TSLA GEX Analysis – “Call Side Dominance Nearing Critical Resistance 💥”
GEX Snapshot:
* Highest Positive GEX / Resistance: $320 – This is where call positioning is heaviest and likely where dealer hedging could resist further upside.
* Call Walls:
* $317.5 (44.18%)
* $320 (High NetGEX)
* $335–$340 (Intermediate resistance, weaker positioning beyond)
* Put Walls:
* $300 (48.79% support)
* $295 / $290 (3rd/2nd tier walls)
Options Oscillator:
* IV Rank (IVR): 16 (Low)
* IVx avg: 64.5
* Call Positioning: 69.8% (very bullish skew)
* GEX: 🔰 Bullish
🎯 Options Trade Setup:
Direction: Cautiously Bullish – but close to key resistance!
⚡ Aggressive Bullish Setup:
* Entry: Near $312.75 (current price)
* Strike: Buy $317.5C or $320C expiring this week
* Target: $320+
* Stop: Close below $308
* Note: Watch dealer hedging around $320. If TSLA breaks $320 with strength, gamma squeeze toward $335 is possible.
🛡️ Bearish Reversal Setup (if rejected at $320):
* Strike: Buy $310P or $305P (next week expiry)
* Trigger: Rejection at $320 + breakdown below $311
* Target: $304–$300
* Stop: Above $321
📉 TSLA 1-Hour Chart Analysis – “Breakout Zone or Fakeout Trap? Watch These Levels 🎯”
Structure:
* TSLA broke above the CHoCH and BOS zones between $308–$310. Price is consolidating under the $317.5–$320 resistance (also seen on GEX).
* There’s a clean ascending wedge/channel forming – upper boundary is near $320, and the lower trendline is near $304.
Key Zones:
* Supply Zone (Purple): $317.5–$320 (watch for rejection or breakout)
* Support: $309.8 (BOS zone), then $304 (trendline + demand overlap)
* Demand Zone: $293.5–$296 (origin of last rally)
🛠️ Trade Scenarios:
🔼 Bullish Continuation:
* Entry: Break and hold above $320
* TP1: $325
* TP2: $335
* SL: Below $311
🔽 Bearish Pullback:
* Entry: Rejection at $317.5–$320 zone and break below $309
* TP1: $304
* TP2: $296
* SL: Above $320
✅ Summary:
* GEX favors calls but $320 is a critical gamma wall – if broken, it opens room toward $335+.
* On the chart, watch the rising channel and upper resistance at $320.
* Bullish momentum is still intact unless $309 fails.
* Stay nimble: scalp calls on breakout, or prepare for a reversal put if there's rejection and structure break.
Disclaimer: This analysis is for educational purposes only and not financial advice. Trade at your own risk with proper risk management.
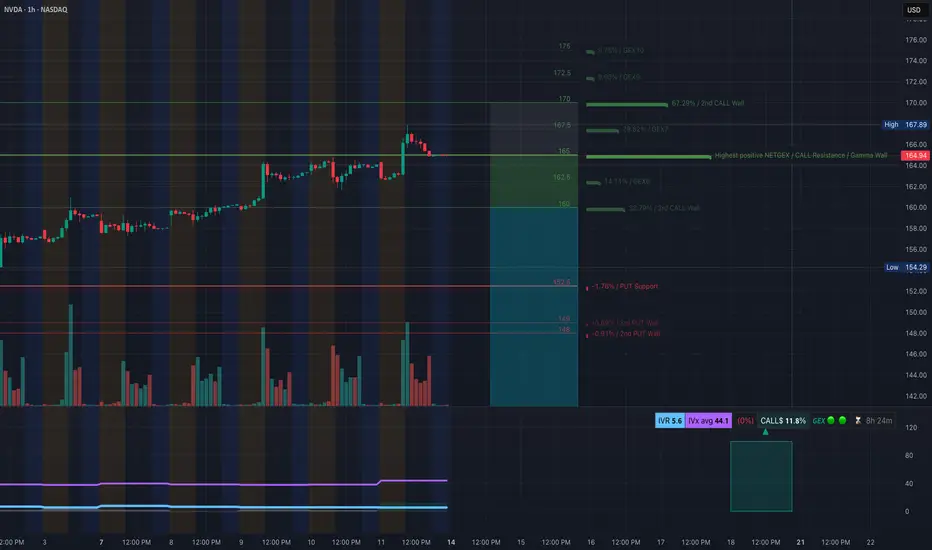
NVDA GEX Options Sentiment Analysis for July 14🧠 GEX Breakdown
* Key Gamma Resistance (Call Wall):
* $164.94 → Highest NET positive GEX (Gamma Wall) – Major resistance where market makers start hedging against further upside.
* $167.89 (local high) → aligns with 1st rejection wick.
* $170 → 2nd CALL Wall (67.29%) – max squeeze potential if $165 breaks with volume.
* Call Side Build-up:
* $167 – 20.62%
* $170 – 67.29%
Stacked CALL walls above = gamma trap if breached, but tough resistance ahead.
* Put Support Walls:
* $152.50 – Strongest downside gamma support
* $148–149 – Layered 2nd/3rd PUT Wall zone
📊 Options Flow Insights
* IVR: 5.6 (very low) → cheap premiums, low expected move
* IVX avg: 44.1
* Call/Put Bias:
* Calls: 11.8% dominance
* GEX Sentiment: ⚠️ Bearish Reversal Risk (high call saturation at resistance)
✅ Suggested Option Plays (Based on GEX Only)
🔸Bearish Rejection Play
* If NVDA rejects $164.94–$165.20 zone (Gamma + Supply confluence):
* Buy puts targeting $160 or $158
* Trade idea:
* Buy: NVDA 160p (Jul 19 expiry or same week)
* Entry: If price stalls/rejects $164.90–$165.20
* Target: $161 → $158
* Stop: Close above $166.00
🔸Bullish Gamma Squeeze (Only if $165 Breaks Cleanly)
* If price breaks and holds above $165.50 with strength
* Buy calls targeting $170 (2nd CALL Wall)
* Trade idea:
* Buy: NVDA 170c (Jul 19 or 26 expiry)
* Entry: $165.60+ breakout + strong volume
* Target: $169–$170
* Stop: Below $163.80
🕯 1-Hour Chart – Price Action Analysis
Market Structure
* CHoCH → BOS → BOS → creating a clear bullish leg, but current supply box at $165 is rejecting price short term.
* Trendline support: Still holding from July 8 lows
* Liquidity zone: $160.96–$161.10 (first demand zone)
Current Setup
* Price is hovering under supply zone + GEX wall → indicating indecision or potential short-term top
* MACD weakening + volume declining = possible pause or reversal
* Clean higher-low structure still intact for now
🎯 Trade Plan Based on 1H Chart
🟢 Bullish Intraday Plan
* Entry: $161.00–$160.50 demand block
* Confirmation: Bullish engulfing or rejection wick
* Target: $164.94 then $167
* Stop-loss: Below $159.80
🔴 Bearish Intraday Plan
* Entry: $164.90–$165.20 inside supply
* Confirmation: Weakening candle (doji or long wick) + no breakout
* Target: $161.00 then $158.80
* Stop-loss: Above $166.10
✍️ My Thoughts
NVDA is coiling just under a heavy GEX resistance wall. If $165 can't break, downside correction to $161–$158 is probable. GEX suggests sellers may be in control unless bulls force a gamma squeeze over $165. Stay patient — let the levels react.
This breakdown is for educational purposes only and not financial advice. Always manage your risk.
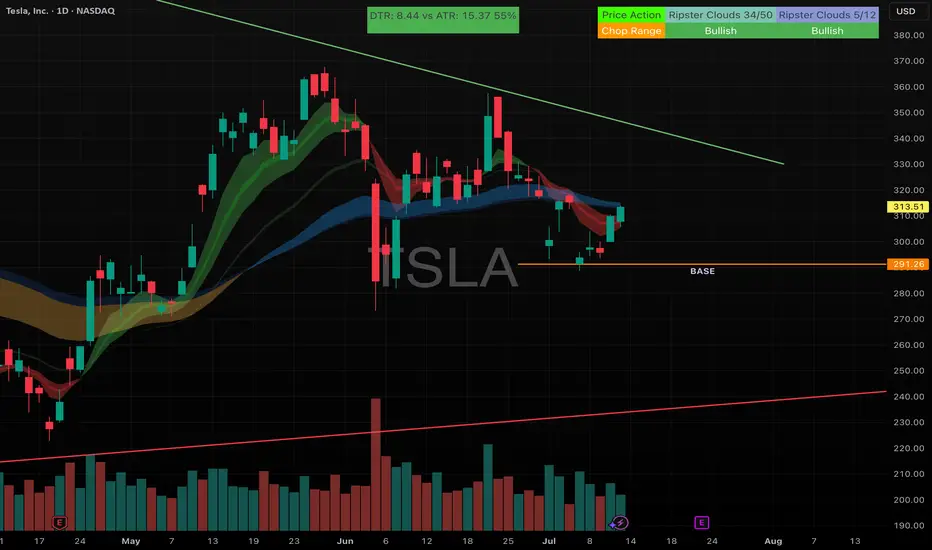
TSLA / Earning seasonNASDAQ:TSLA showing nice price action bounce off the base last week. With earnings season here, watch the $315 level — a breakout could send it toward $320 and $326 next 🚀📈 #TSLA
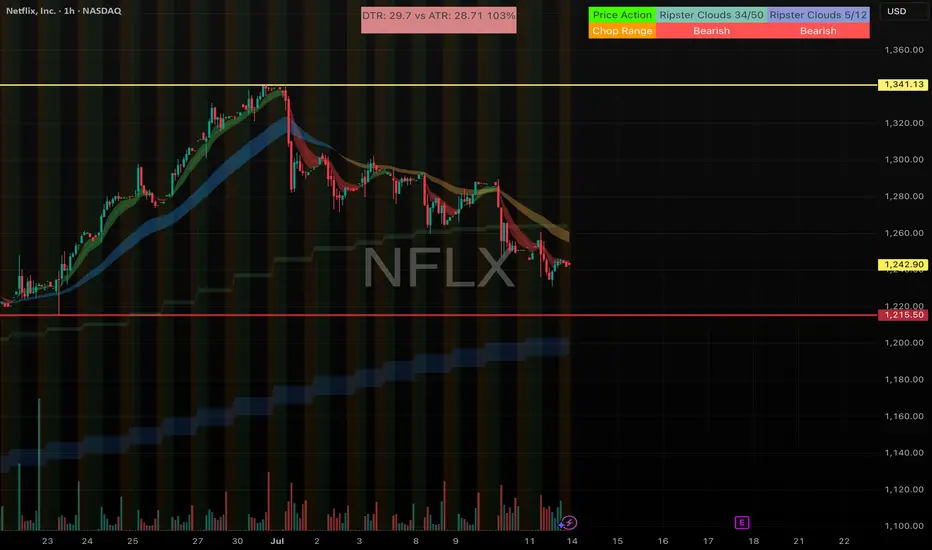
NFLX Price ActionNASDAQ:NFLX showing strong bearish momentum on the 1H. If it breaks below the key $1230 level, next support sits near $1215 — watch for continuation flush 👀🔥
MMM eyes on $140: Key Support that bulls MUST hold for next leg MMM trying to recover and last Earnings were good.
Currently testing a proven zone at $140.06-140.37
Bounce here would Target zone at $147.90-148.35

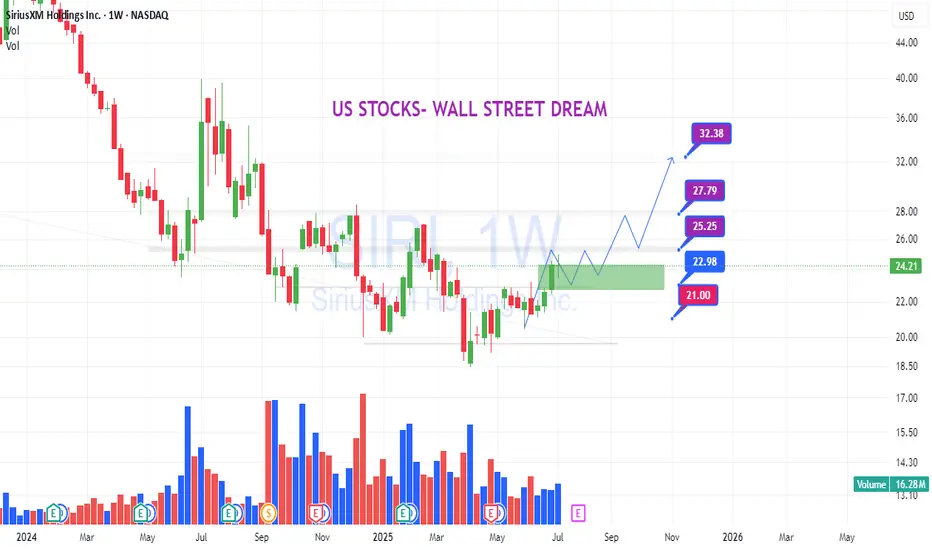
SIRI: Will you swim with Warrent Buffet?SIRI:
When Mr. Warren Buffett announced his purchase of SIRI, the stock price dipped as the crowd chased after it. Meanwhile, he quietly accumulated shares at the bottom. Once the crowd lost interest, the opportunity for SIRI to rebound emerged.
Are you swimming with Mr. Buffett?
.
US STOCKS- WALL STREET DREAM- LET'S THE MARKET SPEAK!
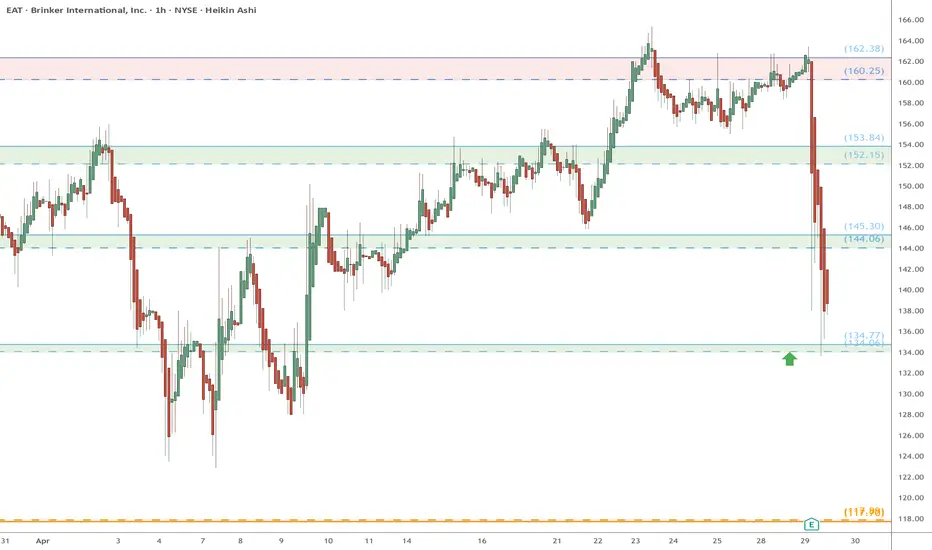
EAT eyes on $134: Earnings Dump fell into a key support to buy?EAT earnings report was apparently pretty bad.
Fell through several supports but trying to hold.
Watch critical and proven zone at $134.06-134.77
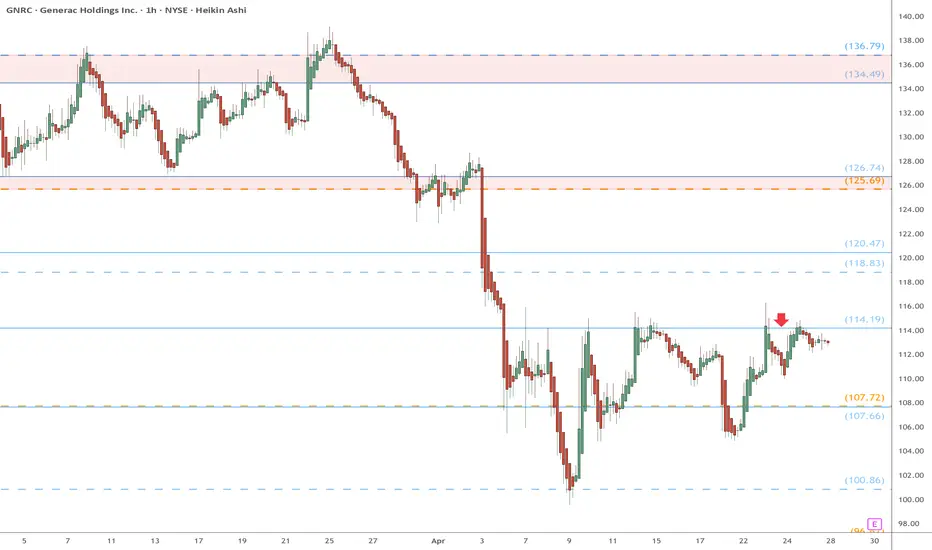
GNRC watch $114.19: Minor but Key fib to end Perpetual DowntrendGNRC has been trying to paint a bottom for the last month.
Now watching the Genesis fib at $114.19 for Break or Reject.
If it rejects then we will watch double fibs at $107.66-107.72
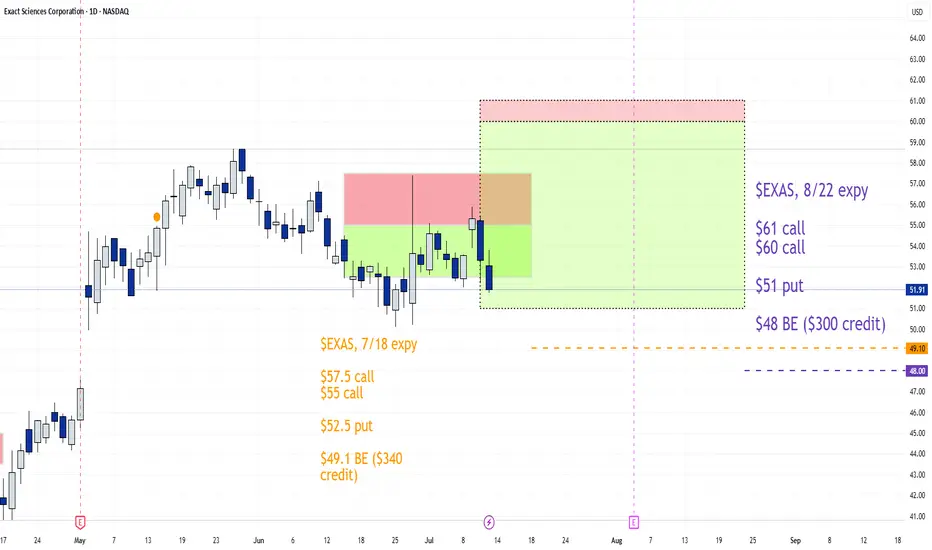
Double-Fistin' Jade-Lizards on $EXASFIRST ONE:
7/18 EXPIRATION
+1 $57.5 call
-1 $55 call
-1 $52.5 put
$49.1 BE ($340 credit)
SECOND ONE:
8/22 EXPIRATION
+1 $61 call
-1 $60 call
-$ 51 put
$48 BE ($300 credit)
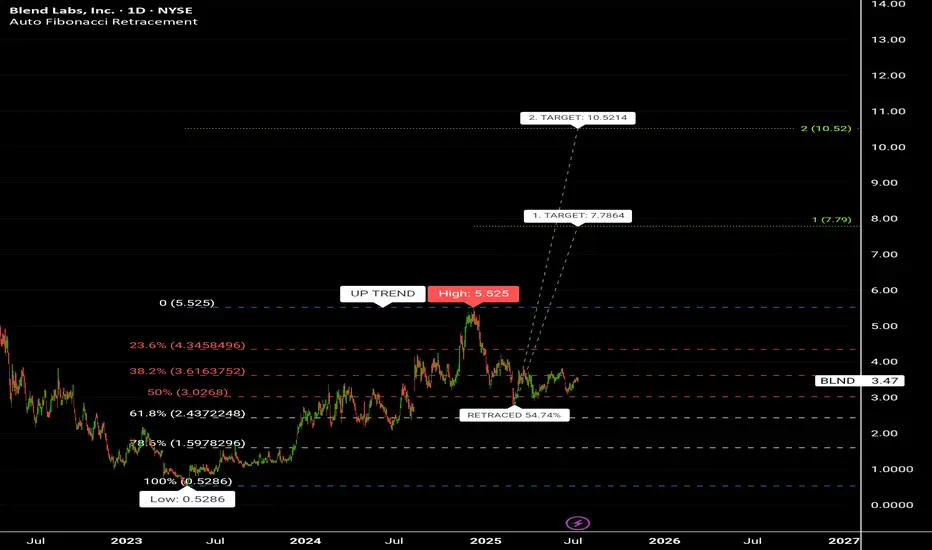
Blend Labs inc (BLND).ABCD Strategic retracment had been implementing on the chart .
Two Target prices are shown on chart , 1st Target price = 7.79 $ , and 2nd Target price = 10.52$ and this match the same Target price of the Cup and Handle pattern that almost formed by crossing nick line at 5.53$ .
It seems to me: A Positive Massive news will be appear to the public soon, and that will reach the Stock price to 10.52$ near future.
💣💣💣💣💣 Highly recommended for Buying 🔥🔥🔥🔥🔥🔥
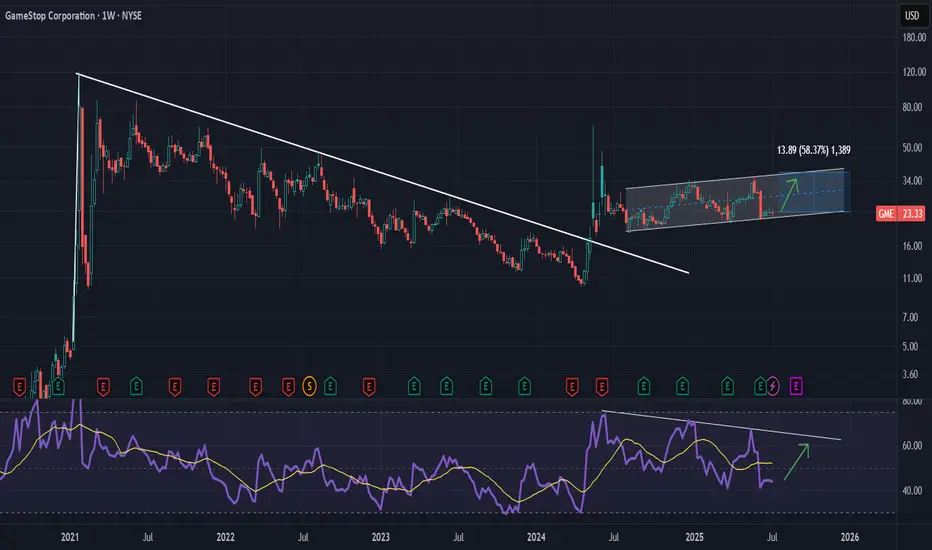
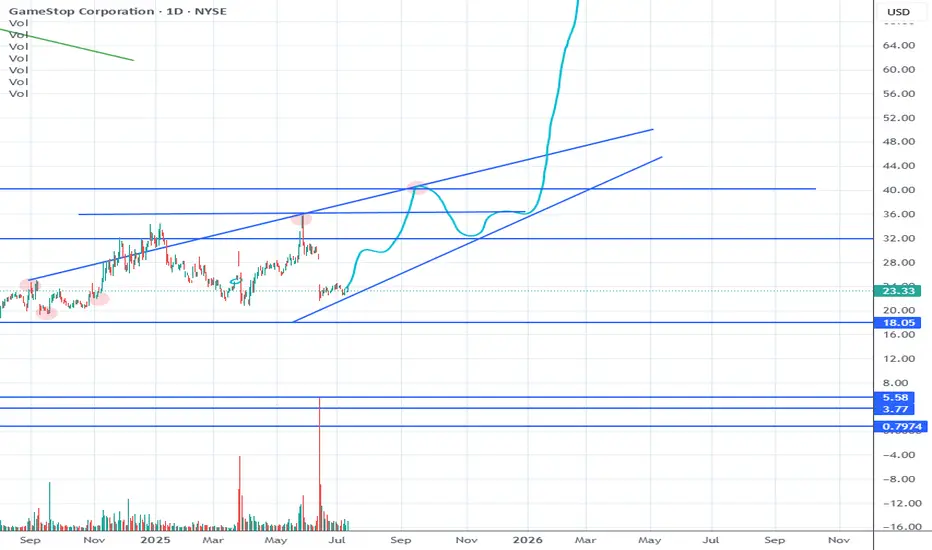
Correlation between 2021 squeeze and 2024-2025 price actionRefer to my 2021 squeeze post idea, you can see a very similar pattern, I predict 30s mid august followed by another dip. MOASS? Probably not but maybe assuming crime has run out of tricks
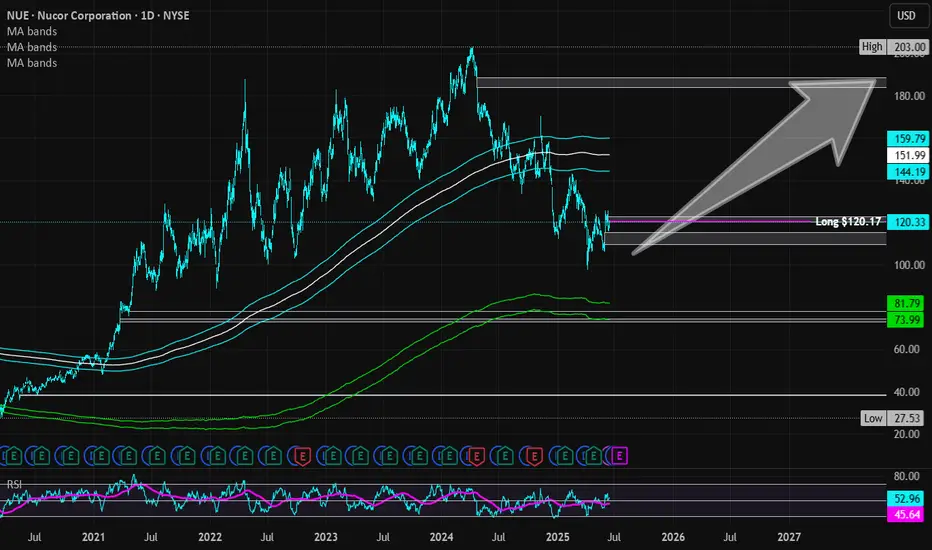
Nucor | NUE | Long at $120.17Nucor NYSE:NUE , a US manufacture of steel and steel products, will likely capitalize on reduced foreign competition as tariffs become reality. The CEO also recently stated that the steelmaker's order backlog is the largest in its history and is increasing prices. So, while there is a potential for short-term downside as tariff "unknowns" are negotiated, the longer-term upside may be there for those who are patient... but time will tell.
Basic Fundamentals:
Current P/E: 21x
Forward P/E: 15-16x
Earnings are forecast to grow 29.6% per year
Projected Revenue in 2025: $32.3 billion
[*} Projected Revenue in 2028: $39.4 billion
Debt-to-Equity: 0.4x (healthy)
Dividend Yield: 1.8%
Technical Analysis:
Riding below the historical simple moving average and there is risk the daily price gap near $109 will close before moving higher. If there is a "crash" in price, $70s is absolutely possible which will be a "steel" if fundamentals do not change.
Targets in 2027:
$142.00 (+18.2%)
$187.00 (+55.6%)
Tesla could make a move here... (July 13, 2025)Tesla's 2 Day chart looks bullish here with the RSI, let's talk about it!

GME Potential UpsideGME looks attractive from a risk to reward perspective. I am not interested in the short squeeze speculation but the technicals and recent acquisition of BTC in their balance sheet has caught my attention as they have been sitting on capital for quite some time now.
Theres a clear gap around 28.50 and of course looming tarrifs are something to look out for. Id keep my eye on this one.