MSTR -- Cup & Handle Breakout // Long & Short SetupsHello Traders!
There is a beautiful cup and handle pattern that has formed on MSTR (Microstrategy).
This pattern offers us a wonderful long setup, as well as a potential short at the all time high.
Pattern Failure: If price both breaks and confirms below the C&P neckline the pattern is void.
Price will likely temporarily pull back from the all time high, giving us our short setup. However you'll want to be in and out quick considering price will likely continue to new highs after pulling back.
I will be swing trading the long setup and likely day trading the short setup.
Have fun and best of luck to everyone on their trading journey!

Cup and handleAfter many months, we now have a cup and handle formation. Regardless of Michael Saylor's constant buying, we have a bull flag in play that takes us to $491 USD.

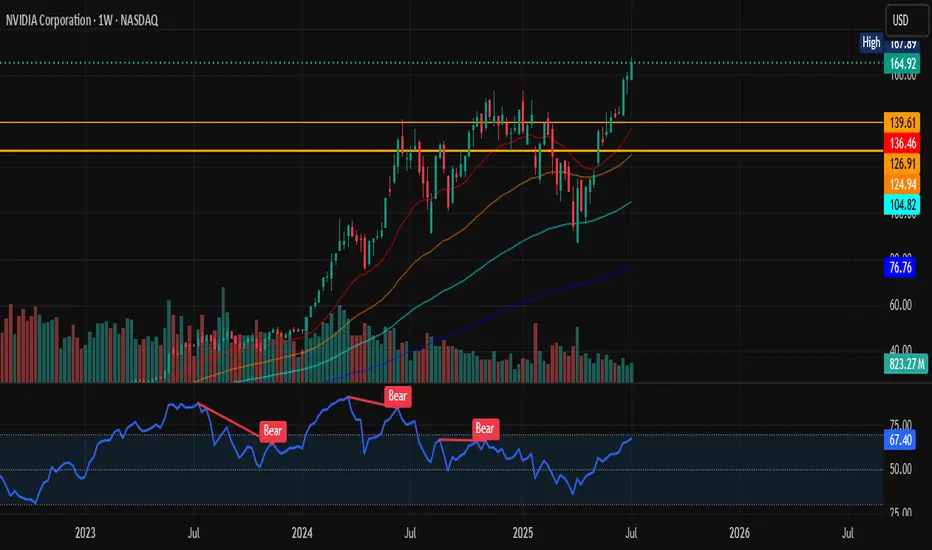
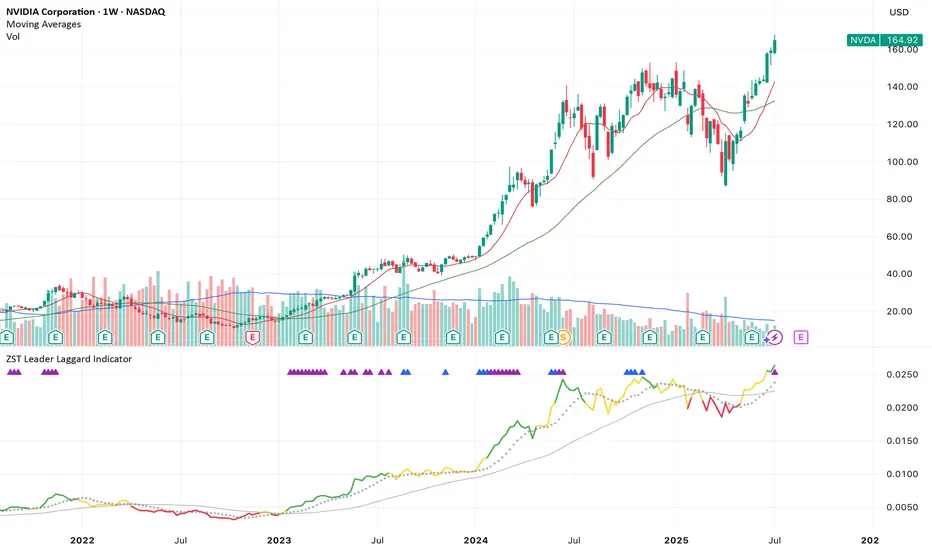
NVIDIA Technical Breakdown NASDAQ:NVDA has broken above the previous congestion/resistance zone (~$139–$145). This zone was tested multiple times and now acts as a support base.
Volume on the breakout week is strong and supporting the move.
Weekly RSI is 67.40, approaching overbought but NOT YET overheated (no bearish divergence). RSI broke past prior Bear zones, signaling renewed strength. Only time will tell.
All-time high territory so proceed with caution. Always due YOUR OWN research.
Bullish long-term trend intact as price is above all EMAs (not too shabby).
I wouldn't be surprised for a pull back soon; maybe 145ish.
Happy Sunday ya'll!
**As always: this isn't financial advice. Please seek professionals on any investments.
While You Were Watching NVIDIA, Oracle Quietly Ate the BackendEveryone's chasing the AI hype but Oracle is one of the only companies selling the picks and shovels behind the scenes.
While headlines focus on NVIDIA, Meta, and ChatGPT, Oracle has been building the back-end massive AI-ready data infrastructure, hyper scale cloud partnerships, and GPU clusters feeding OpenAI and Nvidia workloads directly.
This isn’t some pivot or marketing gimmick Oracle Cloud Infrastructure (OCI) is quietly powering the largest LLMs in the world. And Wall Street is only beginning to price that in.
Why Oracle’s Move Is Just Getting Started
1. AI Cloud Infrastructure – Not Just Software
Oracle Cloud Infrastructure (OCI) is integrated directly into OpenAI, NVIDIA, Microsoft, and Cohere LLM workflows. Ellison confirmed that AI demand on Oracle’s cloud is now booked out for years, including custom GPU clusters. OCI outperforms AWS in specific AI workloads at a lower cost. That’s a disruptor narrative in itself.
2. Earnings Momentum + Smart Money Rotation
Oracle just printed double-digit YoY cloud growth, increased margins, and committed billions in CapEx classic early-growth behaviour. It’s now a value + AI hybrid, attracting funds rotating into defensible, profitable AI infrastructure plays.
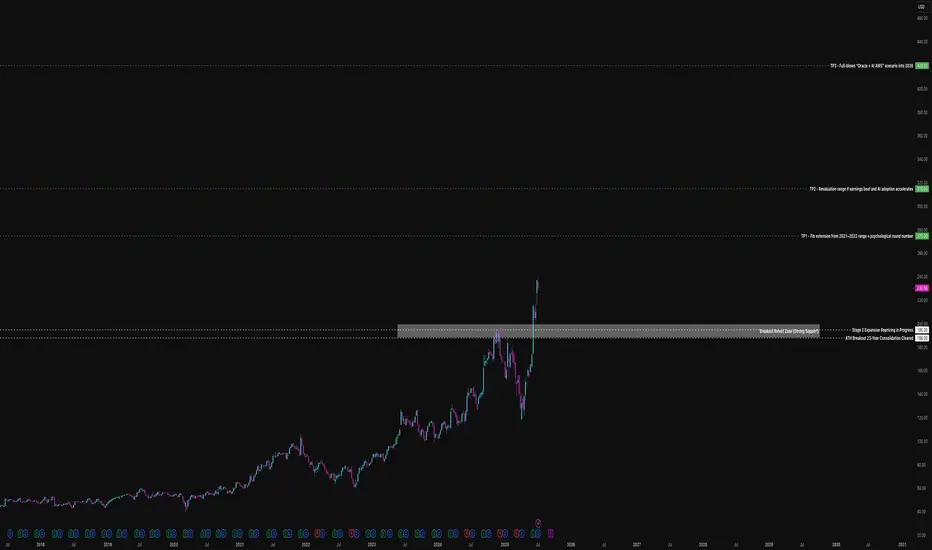
3. Stage 2 Breakout – Repricing in Motion
ORCL broke above its 2021 all-time high ($188) with conviction. Stage 2 began around $195–200, with high volume + range expansion. This is a textbook Stage 2 expansion phase not a short squeeze, not a blow-off top. Monthly structure confirms 23+ years of consolidation is complete.
Technical Markup Summary
- Stage 2 Breakout Level - $195–200
- Support Zone (Prior ATH) - $185–190
- Volume Confirmation - Highest range + volume since Dotcom era
- Current Price Action - Early parabolic expansion = healthy trend
Projected Price Targets
- TP1 $275 Fib 1.618 + round number magnet
- TP2 $310–320 Revaluation zone if earnings accelerate
- TP3 $420+ AI AWS narrative fully priced in
Why This Isn’t a Late Entry
Most traders wait for headlines and miss the Stage 2 phase, which is where real money is made. Oracle is now being repriced for the role it’s actually playing in AI not just as a legacy tech name, but as a global infrastructure layer. This breakout isn’t the end it’s the beginning.
Oracle is no longer just “that enterprise database company.” It’s becoming a core infrastructure provider for the AI era, with multi-year demand, sticky revenue, and strong technical structure.
If you missed NVIDIA’s early breakout this may be your redemption arc.
Defined support at $190
Open runway to $275+
This is a swing-to-position hold for high-conviction players. What's your thoughts?
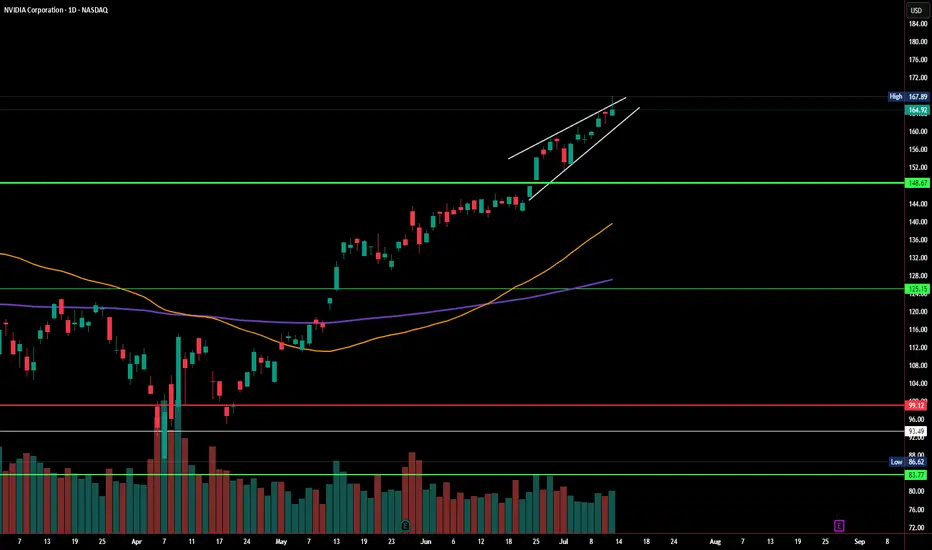
NVDA Daily Chart – Rising Wedge Alert!Just analyzed this NVDA setup. We’re seeing a clear rising wedge forming near the top of a strong run-up — typically a bearish reversal pattern. Price tagged $167.89 and pulled back slightly, closing at $164.92.
If this breaks down, watch the $148.67 - 151.31 area, and below that $125 as a key level. Bulls want to see a strong hold and breakout above $168 to invalidate the wedge.
#NVDA #NVIDIA
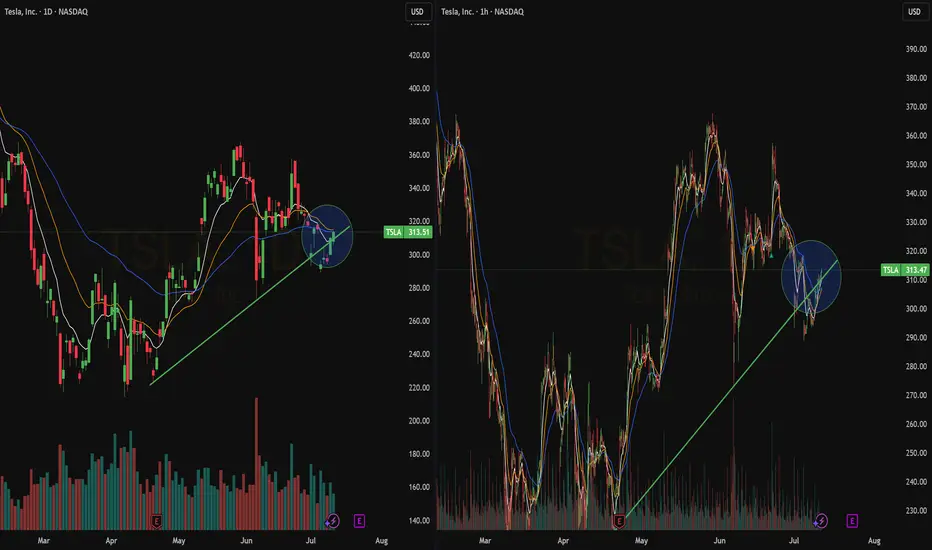
Quick Update : TSLABullish Crossover on the hourly chart at the bottom of the channel.
The action of the last hours is weak as can be seen by the lack f volume.
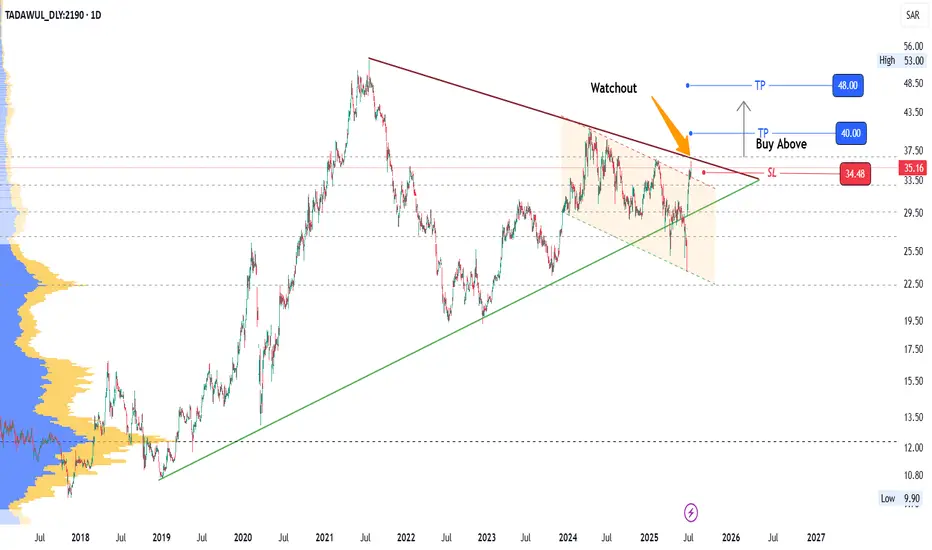
2190: Watch for Breakout2190 has reached Triangle Top (Trendline resistance) breaching a descending parallel channel resistance recently.
Watchout for the breakout of resistance.
Levels are marked.
Manage your risk with proper SL.
Enjoy the ride!
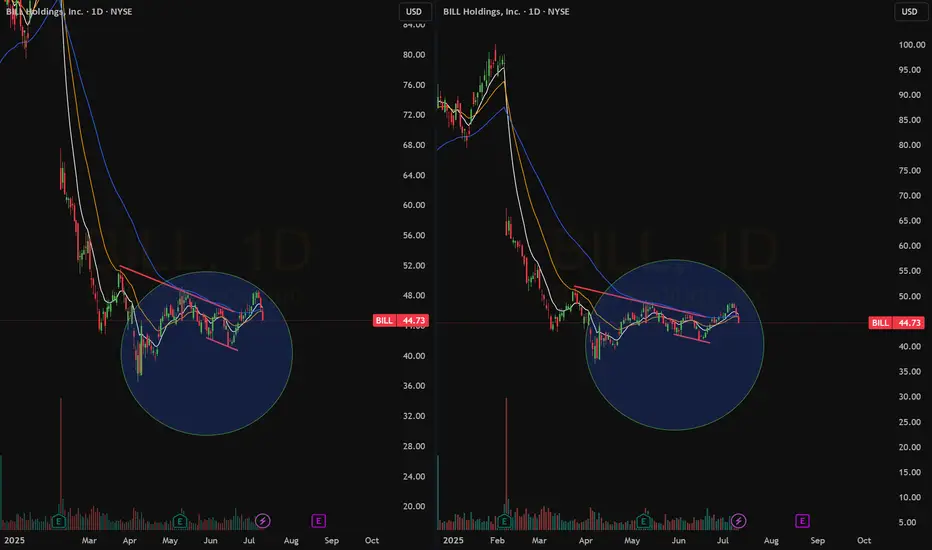
QuickView : $BILLThe stock is actually shaking among $50 and $40. I already have a short seutp. This time I see even a long setup after the small crossover on the daily Chart. Always ready to take both directions with much care to fake breakouts.
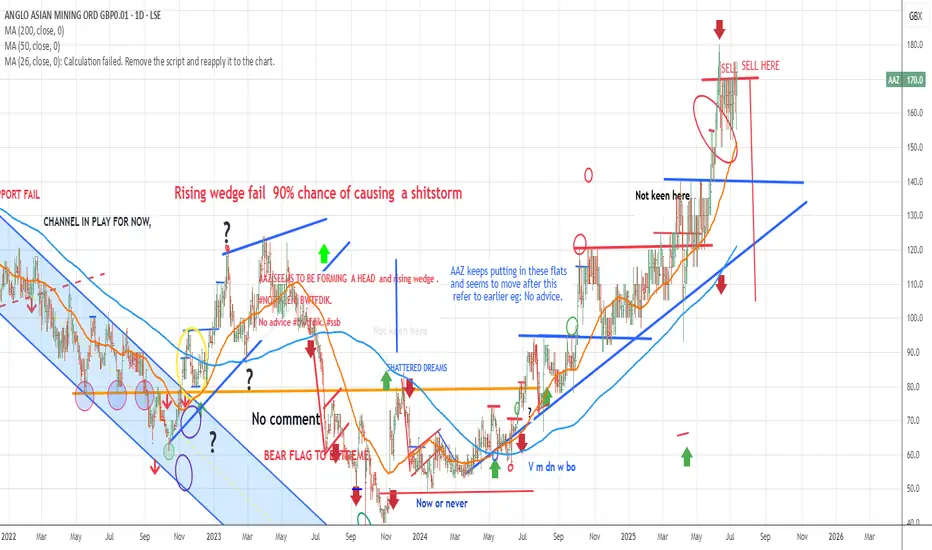
"AAZ" SHORT AAZ have really won on the no liquid play.
Chart is very top heavy and the location worries my investors.
BWTFDIK
SSB
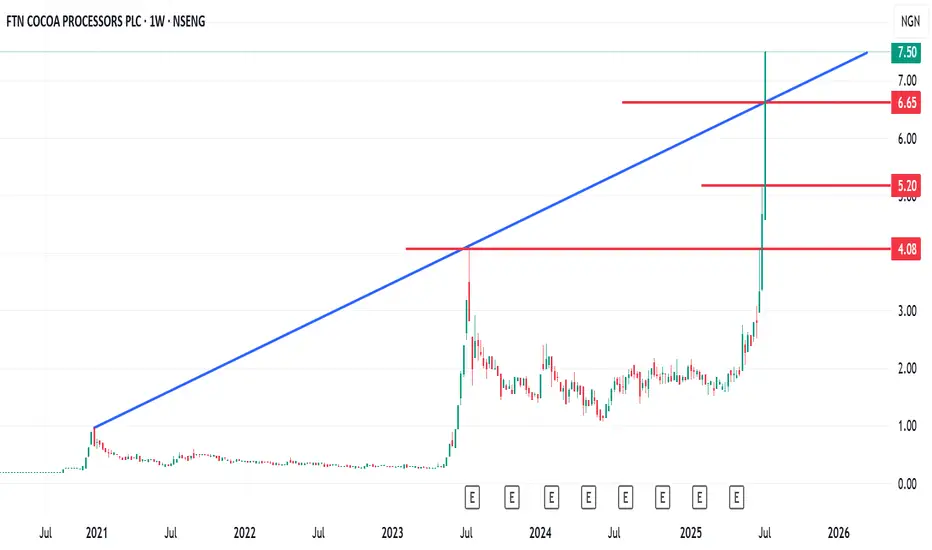
FTN Cocoa has more than doubled price in 3 weeksFTN Cocoa has more than doubled its price in 3 weeks.
The questions are
1. Is this sustainable
2. What is the catalyst for this accelerated rise
However, my thought is clear on the chart. A fall below those levels may push it lower. But if the momentum continues, we may see a continuous positive run.
Tradew ith care
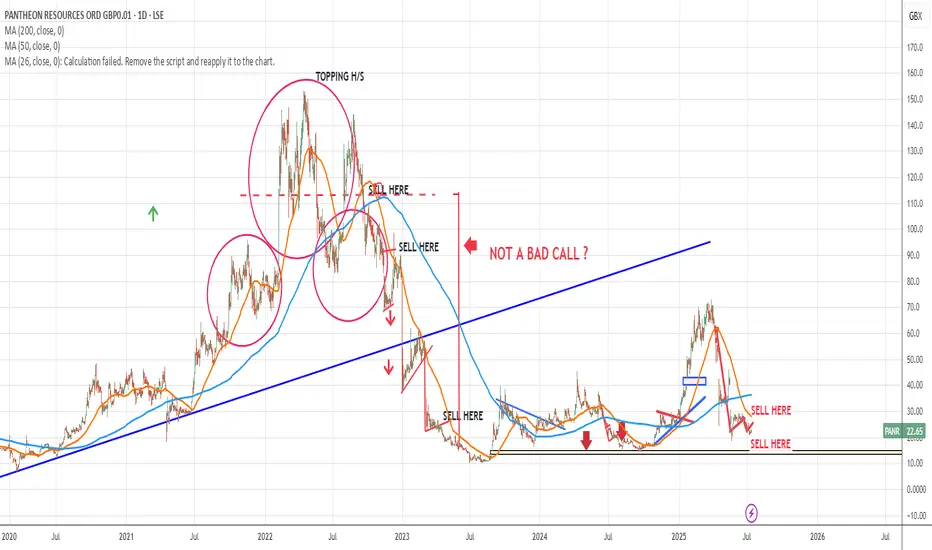
"PANR" shortI gave a sell signal around November 2022.
Look back..
No way this is a real share,,
BWTFDIK
SSB
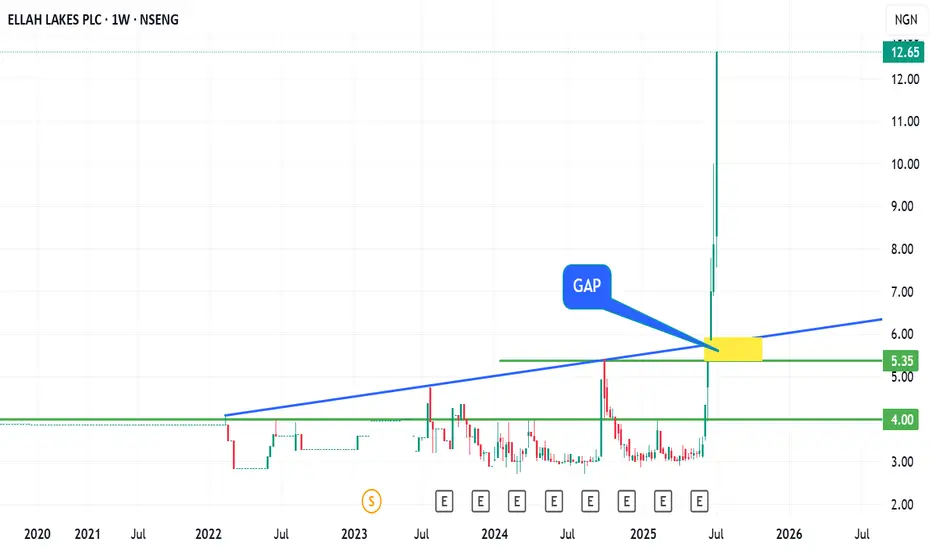
From Fish Farming to Agribusiness Giant: Ellah Lakes’ 304% Rise Ellah Lakes Plc is a Nigeria‑based agribusiness firm, once focused on fish farming but now primarily engaged in oil palm, cassava, maize, soya, and rice production and processing, operating plantations across Edo, Ondo, Enugu, Ekiti (Nigeria) and Ghana.
This asset has made roughly 304% gain since 2nd of June of this year.
The questions are:
1. Is this vertical growth sustainable?
2. Will price action be respected technically as shown on the chart?
3. Will Ellah Lake drop back to close the yellow gap? (N5.3 - N6 zone)
My final view:
After a 304% gain since June, I am now questioning the sustainability of this vertical move, key technical zones, and whether a price correction to the ₦5.3–₦6 gap is on the horizon
Trade with care
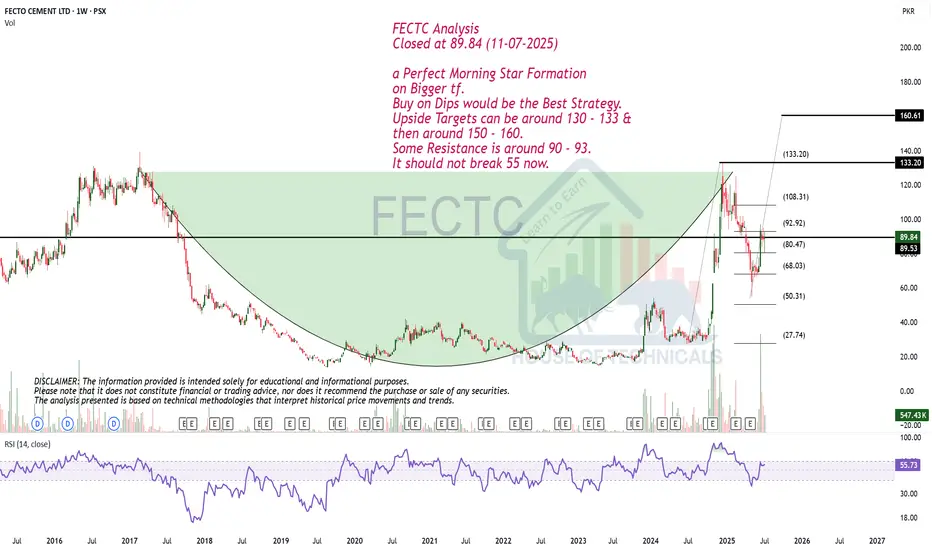
a Perfect Morning Star Formation on Bigger tf.FECTC Analysis
Closed at 89.84 (11-07-2025)
a Perfect Morning Star Formation
on Bigger tf.
Buy on Dips would be the Best Strategy.
Upside Targets can be around 130 - 133 &
then around 150 - 160.
Some Resistance is around 90 - 93.
It should not break 55 now.
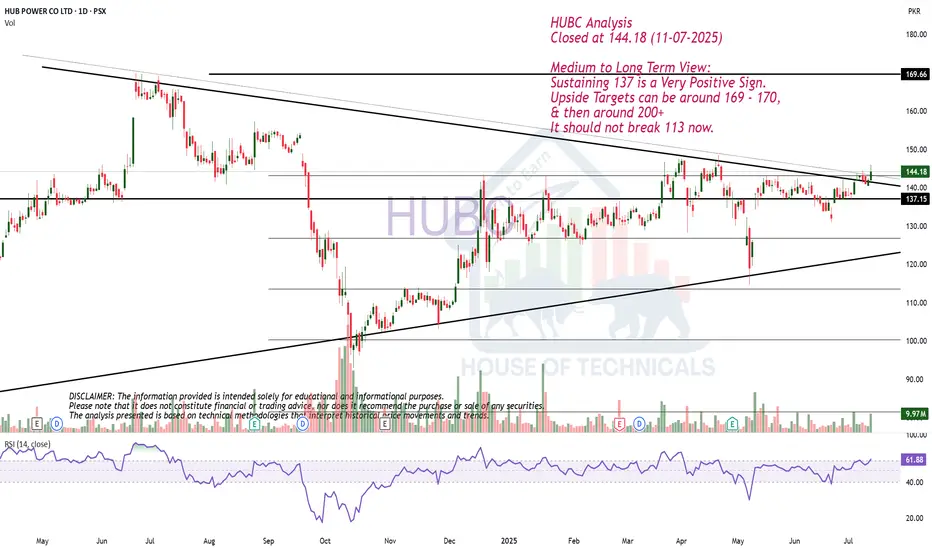
Medium to Long Term View.HUBC Analysis
Closed at 144.18 (11-07-2025)
Medium to Long Term View:
Sustaining 137 is a Very Positive Sign.
Upside Targets can be around 169 - 170,
& then around 200+
It should not break 113 now.