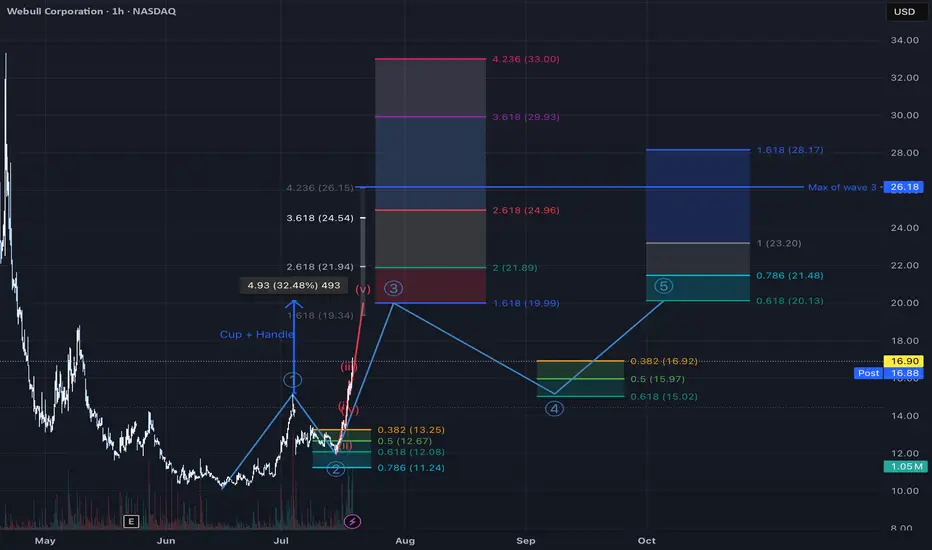
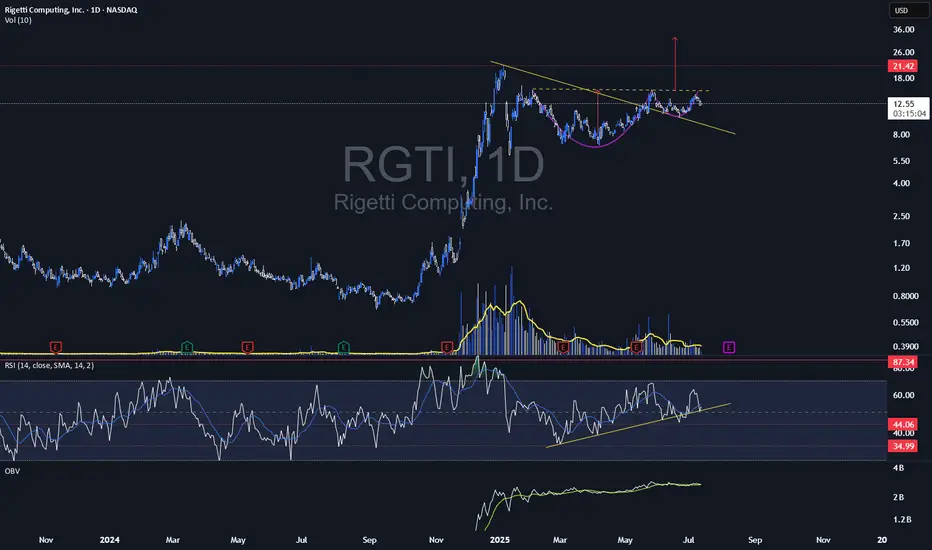
Conservative target zone estimationNASDAQ:BULL my first target zone estimation using elliot wave theory. Obviously, I tried to focus on the most conservative alternative.
Due to the additional cup and handle pattern i am pretty confident that wave 3 reaches at least $20 within the next few days.
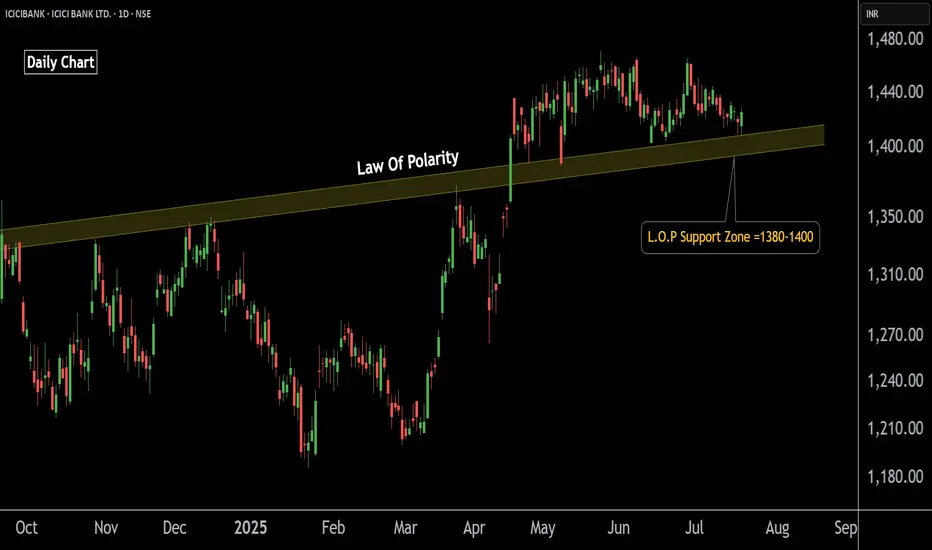
ICICI Bank Poised for Upside – Buy OpportunityThis is the daily chart of ICICIBANK.
ICICIBANK having a good law of polarity at 1380-1400 level .
If this level is sustain then we may see higher prices in ICICIBANK.
Thank You !!
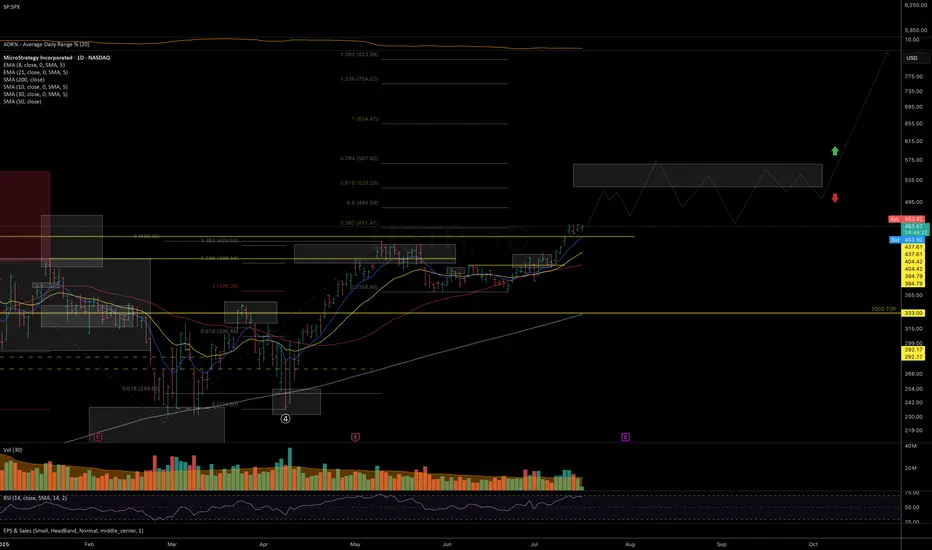
MSTR – On the Path to New ATHI was initially skeptical about the recovery structure unfolding since the April lows — it looked like a possible macro lower-high before deeper correction (as outlined in my previous idea).
However, given the strength in underlying #BTC price action (covered in my recent video-idea on crypto trend structure) and clear signs of constructive consolidation and accumulation during the July breakout, Isee strong odds for follow-through toward the 520–570 resistance zone in the coming weeks.
This move may align with CRYPTOCAP:BTC testing its macro resistance near 130K (see my macro BTC analysis on the idea section).
If NASDAQ:MSTR can break above 570 and sustain a close above it, it opens the door to a potential immediate follow-through toward the 650–755 macro resistance zone. But a scenario for more prolonged consolidation around 570 would in fact serve as a solid base for more stable and prolonged next long-term leg higher.
Palantir Is Up 600%+ Since August. What Do Its Charts Say?National-security software firm Palantir Technologies NASDAQ:PLTR hit a new all-time high this week and has gained more than 600% since hitting a 52-week low last August. What does technical and fundamental analysis say could happen next?
Let's look:
Palantir's Fundamental Analysis
PLTR has been on a tear of late, hitting a $153.91 intraday record high on Thursday. (Full disclosure: I own the stock.)
Shares have been rising in part because NATO member nations recently agreed to increase defense and defense-related infrastructure spending to 5% of each country's gross domestic product -- news that could play right into the company's hands.
Only Spain opted out from among the 32 Western nations that belong to the military alliance, although Canada went along only somewhat reluctantly.
The move surprised many NATO observers. Just some eight years ago, President Trump couldn't get a majority of these nations during his first term to pay what he called their "fair share" -- which was then mandated at only 2% of GDP.
But having a hostile Russian Army in Ukraine knocking at NATO's front door has changed global perceptions of what's fiscally necessary and what's not. Spain and Canada are far away from the Russia-Ukraine war, but some NATO members physically closer to the fighting have far more enthusiastically embraced the new 5% spending target.
What becomes of these promises to boost military spending?
There will, no doubt, still be costly purchases of expensive military hardware like tanks, artillery, aircraft and naval vessels. But intelligence provided by the kind of data-based, AI-assisted analysis that Palantir sells seems likely to only grow in significance.
Purchasing such intelligence (or the high-tech, modern systems to gather it) looks to be far more cost-effective than simply throwing money at things like submarines and fighter aircraft.
That's what nations need these days for national security, as well as what many large businesses need just to compete. All of that sounds like music to Palantir's ears.
The company will report Q2 earnings after the closing bell on Aug. 4, with analysts looking for the firm to post $0.14 in adjusted earnings per share on $939.3 million of revenue.
That would represent a 55.6% increase from the $0.09 in adjusted EPS and 38.5% improvement on the $678.1 million in revenues that PLTR reported for the same period last year.
Of the 19 sell-side analysts I found that cover Palantir, 12 have revised their earnings estimates higher since the current quarter began, while three have lowered their forecasts.
Palantir's Technical Analysis
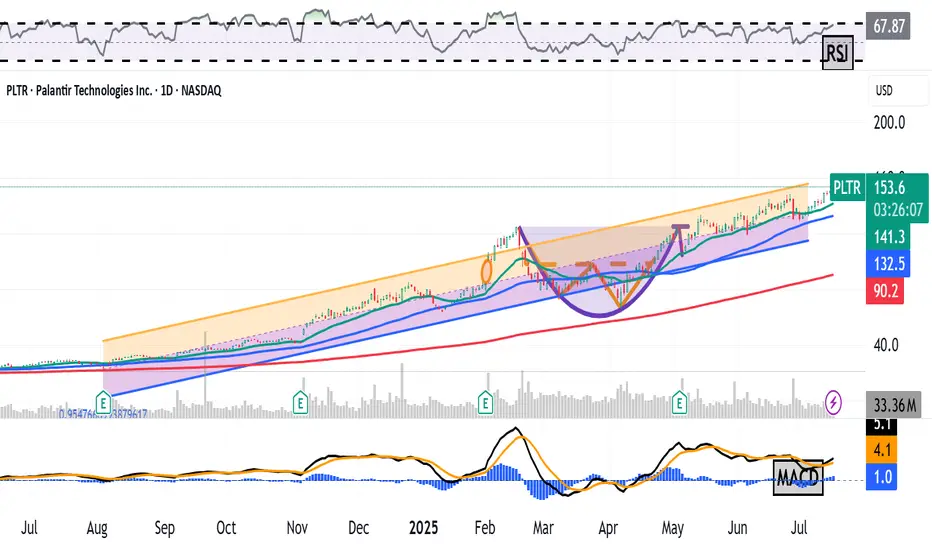
Now let's take a look at PLTR's charts, beginning with this one that runs from January through Tuesday afternoon:
Readers will first note that Palantir continues to break out from the bullish "cup-with-handle" pattern that became visible this spring (shaded purple in the chart above).
The stock's Relative Strength Index (the gray line at the chart's top) also remains quite robust, but is not yet technically overbought.
Similarly, Palantir's daily Moving Average Convergence Divergence indicator (or "MACD," marked with gold and black lines and blue bars at the chart's bottom) is postured bullishly as well.
Within that MACD, the histogram of the stock's 9-day Exponential Moving Average (or "EMA," denoted with blue bars) is above zero. That's often seen technically as short-term bullish.
Meanwhile, Palantir's 12-day EMA (the black line) is back above its 26-day EMA (the gold line), with both in positive territory. That's also a historically bullish signal.
Now let's look at PLTR's chart going back 12 months:
Taking a longer look back, we can take a Raff Regression model (the orange and purple field above) and place it over the stock's price action to better illustrate the trend that's in place.
This view shows PLTR riding its 21-day EMA (the green line above) since mid-April.
Palantir's current pivot is the upper trendline of the model -- about $156 in the chart above vs. the $153.43 that PLTR was trading at on Thursday afternoon.
The stock's 50-day SMA (the blue line at $131.40 in the chart above) represents PLTR's downside pivot, with the Raff Regression model's lower trendline not too far below that for potential support.
(Moomoo Technologies Inc. Markets Commentator Stephen “Sarge” Guilfoyle was long PLTR at the time of writing this column.)
This article discusses technical analysis, other approaches, including fundamental analysis, may offer very different views. The examples provided are for illustrative purposes only and are not intended to be reflective of the results you can expect to achieve. Specific security charts used are for illustrative purposes only and are not a recommendation, offer to sell, or a solicitation of an offer to buy any security. Past investment performance does not indicate or guarantee future success. Returns will vary, and all investments carry risks, including loss of principal. This content is also not a research report and is not intended to serve as the basis for any investment decision. The information contained in this article does not purport to be a complete description of the securities, markets, or developments referred to in this material. Moomoo and its affiliates make no representation or warranty as to the article's adequacy, completeness, accuracy or timeliness for any particular purpose of the above content. Furthermore, there is no guarantee that any statements, estimates, price targets, opinions or forecasts provided herein will prove to be correct.
Moomoo is a financial information and trading app offered by Moomoo Technologies Inc. In the U.S., investment products and services on Moomoo are offered by Moomoo Financial Inc., Member FINRA/SIPC.
TradingView is an independent third party not affiliated with Moomoo Financial Inc., Moomoo Technologies Inc., or its affiliates. Moomoo Financial Inc. and its affiliates do not endorse, represent or warrant the completeness and accuracy of the data and information available on the TradingView platform and are not responsible for any services provided by the third-party platform.
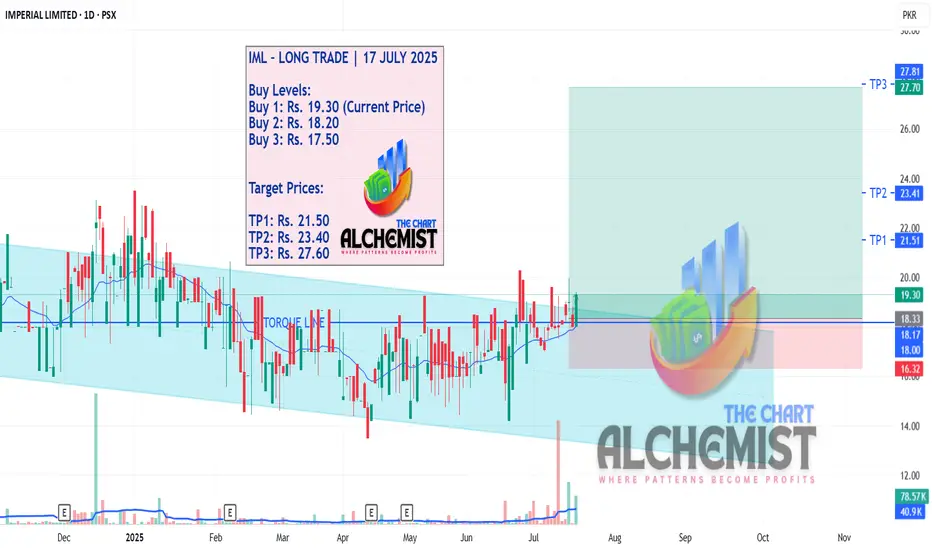
IML – LONG TRADE | 17 JULY 2025 IML – LONG TRADE | 17 JULY 2025
IML broke out of a bull flag formation (marked in light blue channel) following a correction, signaling renewed upward momentum. This breakout suggests the start of a fresh leg up, supported by structural strength and volume confirmation. The setup offers a solid entry with multiple upside targets.
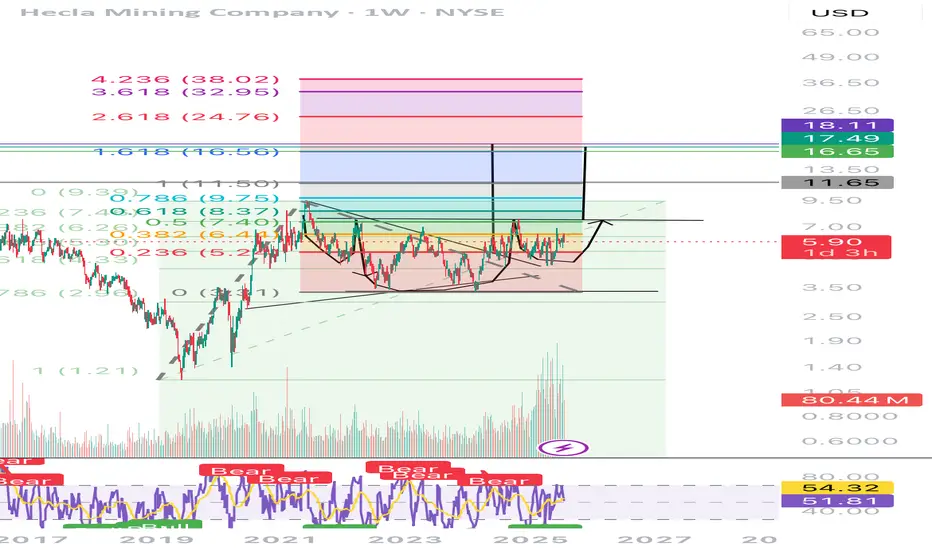
HL-Insane Confluence HereChart speaks for itself.
Confluence on many indicators suggests a hard bottom here
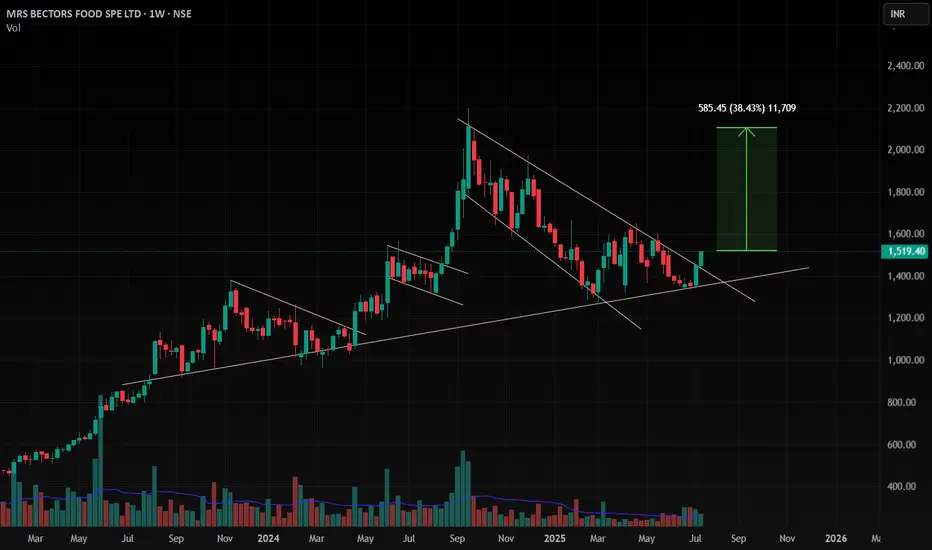
BECTORFOOD , 1W , Bullish As the trendline is giving support at below and formed a good pattern and given breakout with good close in weekly and daily .
This stock is ready to enter into this
Follow for more Ideas like this
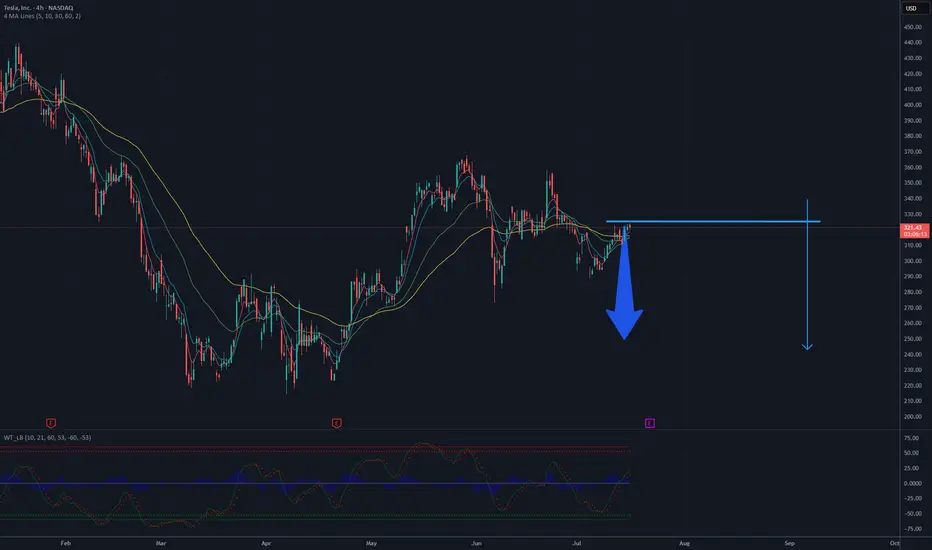
UPTADE TESLA -- 250 USD still potentialTesla is consolidating in a tight range, showing bearish pressure near the lower boundary of the formation. Moving averages (MA 5/10/30/60) are flattening, indicating a loss of bullish momentum, while the Wavetrend oscillator has issued a sell signal (bearish crossover below the zero line). A downside breakout from this range projects a potential move toward the $250 level, as illustrated by the measured move. This bearish scenario gains validity if price breaks below the $315 support level.
Potential TP still 250 USD
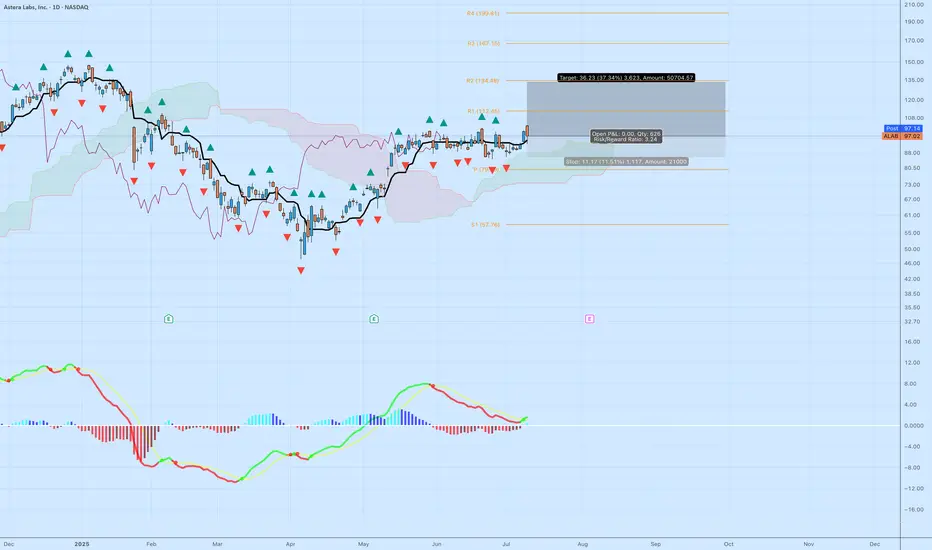
ALAB: High-Quality Breakout With Strong Structure and 3.2 R/RAstera Labs ( NASDAQ:ALAB ) just delivered a clean technical breakout above multi-week resistance, paired with bullish confirmation from momentum and Ichimoku structure. This isn’t a hype trade — this is what a textbook continuation breakout looks like.
📊 Key Technical Breakdown
Base Breakout
After weeks of tight consolidation, NASDAQ:ALAB just broke above horizontal resistance at ~$95. The breakout candle is strong, with above-average range and a decisive close.
Ichimoku Cloud
Price is well above the cloud — this confirms bullish trend.
The Kijun (black line) is sloping upward, and the cloud is thick and rising.
Pullbacks toward $88–90 could act as support if the breakout retests.
MACD Reversal
The MACD has flipped green, signaling a momentum shift.
Histogram is expanding upward again, showing renewed buying pressure.
This is happening as price reclaims the top of the recent range — a great alignment.
🎯 Trade Specs
Entry: $97.02
Target: $133.25 (+37.34%)
Stop: $85.32 (–11.51%)
Risk/Reward: 3.24 — solid skew for a growth name
Context: Strong prior trend, healthy consolidation, and now continuation. This isn’t a bottom-pick — it’s trend-following at a breakout moment.
🧠 Why This Trade Works
Structure: You’re not chasing green candles. This breakout comes after a long base and clears prior congestion.
Asymmetry: A 3.2+ R/R setup means you can be wrong more than half the time and still come out ahead — if you stick to your stops.
Momentum Alignment: Momentum and price are moving together — never fade a breakout with confirmation from both price action and indicators.
📌 Tip for Readers:
If you’re new to swing trading, study how this base formed and what conditions led to the breakout. The goal isn’t prediction — it’s positioning at the right moments with risk defined.
#RGTI This pattern is still consolidating within the handle, and a breakout above the resistance could signal the beginning of a new bullish wave.
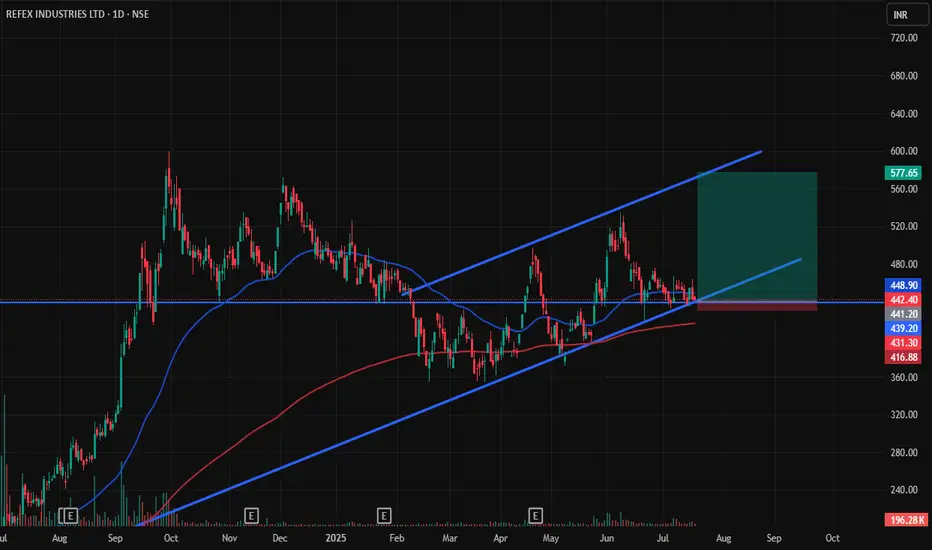
REFEX INDUSTRIES Good for Long PositionIndustry Average PE : 65
Refex PE : 30
FII's and DII's had increased their stake
Technicals are looking good
Target : 575
Stoploss : 430
If it breaks out 600 level with huge volumes, then further upside is potential
3M - LTF Successful RetestWe have seen a liquidity zone form for the past year and finally we are looking at a successful retest. Given this holds as a new buying zone then our next target would be $170-$174 followed by the ATH around $216.
If price fails to hold this liquidity zone as new support and price closes back below $154 then this would be a failed breakout.

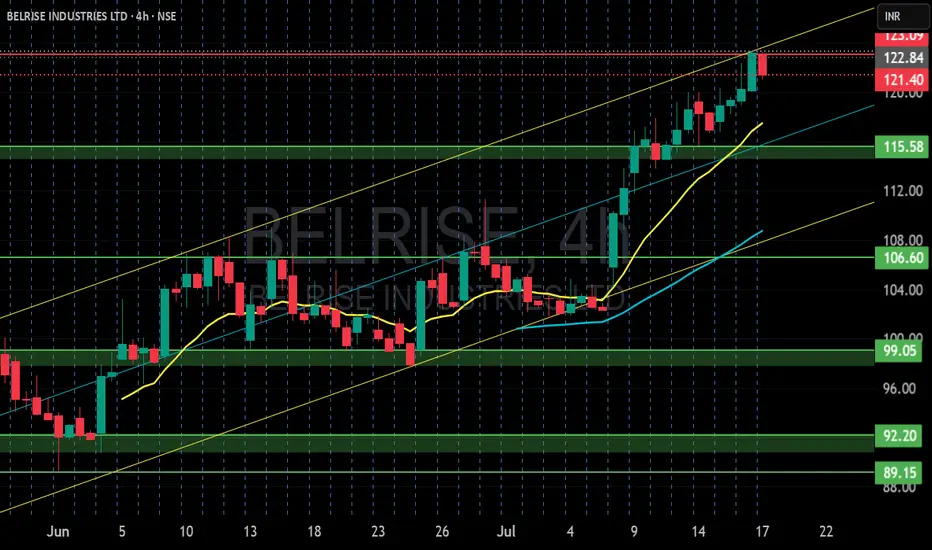
BELRISE INDUSTRIES LTD S/RSupport and Resistance Levels:
Support Levels: These are price points (green line/shade) where a downward trend may be halted due to a concentration of buying interest. Imagine them as a safety net where buyers step in, preventing further decline.
Resistance Levels: Conversely, resistance levels (red line/shade) are where upward trends might stall due to increased selling interest. They act like a ceiling where sellers come in to push prices down.
Breakouts:
Bullish Breakout: When the price moves above resistance, it often indicates strong buying interest and the potential for a continued uptrend. Traders may view this as a signal to buy or hold.
Bearish Breakout: When the price falls below support, it can signal strong selling interest and the potential for a continued downtrend. Traders might see this as a cue to sell or avoid buying.
MA Ribbon (EMA 20, EMA 50, EMA 100, EMA 200) :
Above EMA: If the stock price is above the EMA, it suggests a potential uptrend or bullish momentum.
Below EMA: If the stock price is below the EMA, it indicates a potential downtrend or bearish momentum.
Trendline: A trendline is a straight line drawn on a chart to represent the general direction of a data point set.
Uptrend Line: Drawn by connecting the lows in an upward trend. Indicates that the price is moving higher over time. Acts as a support level, where prices tend to bounce upward.
Downtrend Line: Drawn by connecting the highs in a downward trend. Indicates that the price is moving lower over time. It acts as a resistance level, where prices tend to drop.
Disclaimer:
I am not a SEBI registered. The information provided here is for learning purposes only and should not be interpreted as financial advice. Consider the broader market context and consult with a qualified financial advisor before making investment decisions.
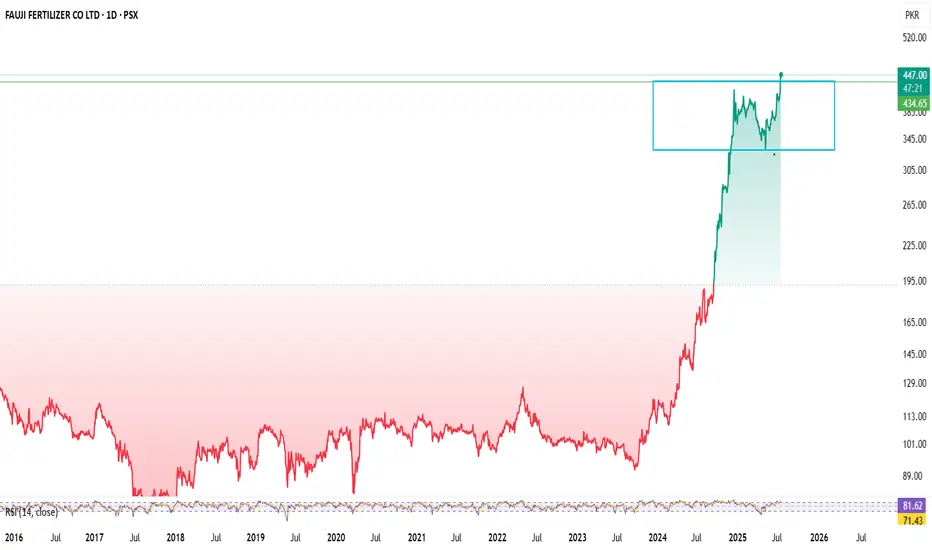
FFCFFC PSX STOCKs breakout Day Level Buy Call
Fundamental Strengths
Robust earnings growth:
FY 2024 net profit ~PKR 64.7 B vs ~PKR 29.7 B (2023) – EPS nearly doubled to PKR 45.49
Pakistan Stock Exchange
+15
StockAnalysis
+15
.
Q1 2025 EPS ~PKR 9.33 (Sep‑Nov on TTM ~PKR 66.6)
Pakistan Stock Exchange
.
Attractive valuation:
TTM P/E ~9.6× (TradingView shows ~6.6×—likely consolidated vs standalone) .
High dividend yield:
~8.7–9.9% yield in 2024, with a ~60% payout ratio
TradingView
.
Diversified portfolio:
Operations across fertiliser, power, food, banking (via Askari Bank), wind generation, phosphate JV – mitigating sector risk
TradingView
+1
+1
Strong ownership:
Backed by Fauji Foundation (~43% owner) – adds stability and governance credibility
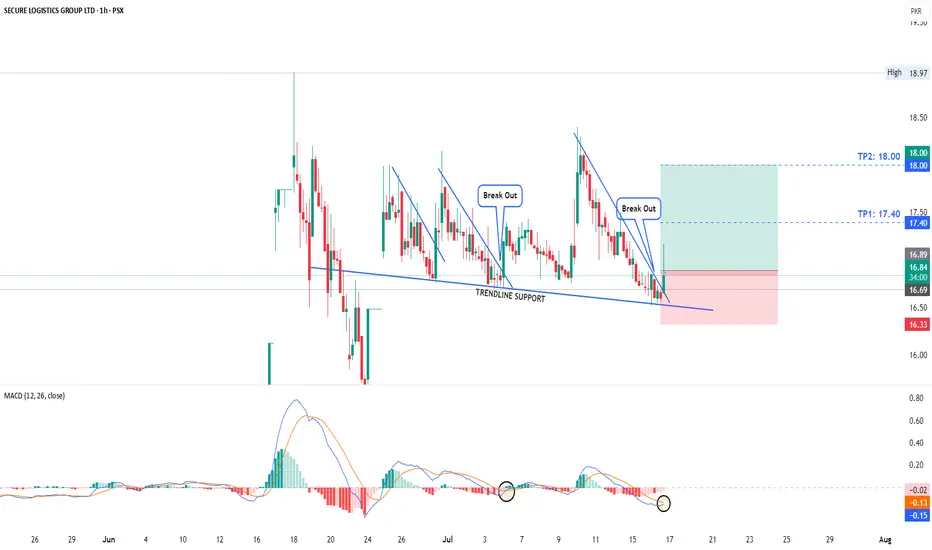
SLGL | Break Out Confirmed- Respecting trend line support
- Break out of trend line confirmed
- MACD bullish cross over going to play
- Entry at CMP or dip
- Targets 17.40-18
- Stop Loss level 16.33
- Risk to reward 1 : 2
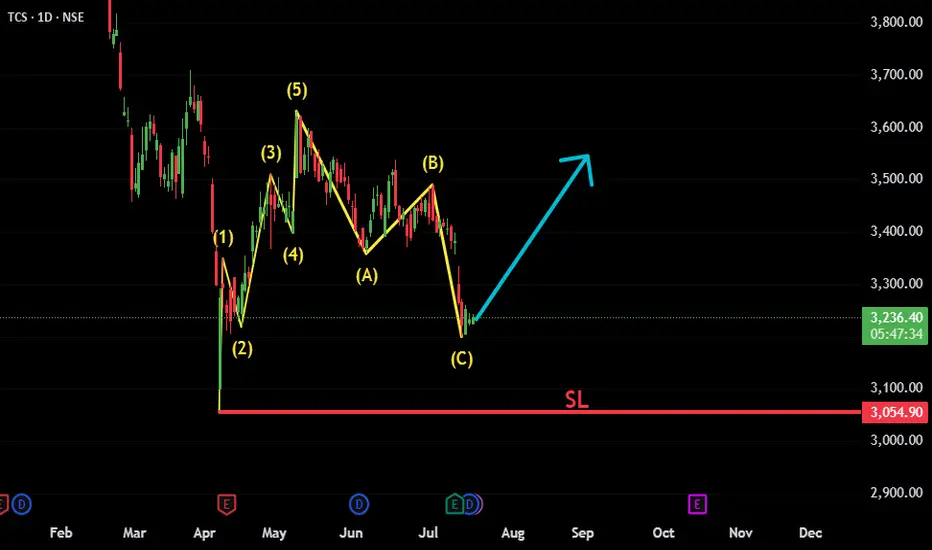
TCS: ABC Correction Complete – New Impulse Wave in FocusTCS appears to have completed a classic Elliott Wave structure, consisting of an initial 5-wave impulsive move followed by an A-B-C corrective phase. The recent price action suggests the correction has likely ended, and a new bullish impulsive move is beginning.
Fundamental trigger:
Interestingly, just a few days ago, TCS announced strong quarterly results — reporting solid profits and declaring a dividend. Despite the positive news, the stock reacted negatively and moved lower. This could have been a classic case of "good news, bad reaction" — possibly a stop-loss hunt or smart money absorbing liquidity before the next leg up.
Key technical points:
✅ Wave 1-2-3-4-5 clearly visible, forming the initial impulse.
✅ A-B-C correction appears complete with price reversing from a key support zone.
📈 Bullish structure forming; watching for confirmation with a break above recent highs.
🔍 Technicals and sentiment suggest renewed upside potential, despite short-term shakeouts.
Invalidation below recent swing low (Beginning of 1st Impulsive).
This setup offers a potential long opportunity with a favorable risk-reward
#TCS #NSE:TCS #ElliottWave #WaveAnalysis #TechnicalAnalysis #ABCCorrection #ImpulsiveWave #LongSetup #ChartAnalysis #NSEStocks #IndianStocks #Dividend #Earnings #PostEarningsMove #TrendReversal #SwingTrading #PriceAction #SmartMoney
How Earnings Reporting Could Impact Netflix (NFLX) Share PriceHow Earnings Reporting Could Impact Netflix (NFLX) Share Price
Earnings season is gaining momentum. Today, after the close of the main trading session, Netflix (NFLX) is set to release its quarterly financial results.
Analysts are optimistic, forecasting earnings per share (EPS) of $7.08, up from $4.88 a year earlier, and revenue growth to $11.1 billion.
The upbeat sentiment is driven by:
→ the fact that Netflix’s business model is relatively resilient to tariff-related pressures;
→ the company’s success in curbing password sharing and promoting a more affordable ad-supported subscription tier.
Netflix has reported revenue growth for six consecutive quarters, outperforming competitors such as Disney, Amazon, and Apple. Its market share has climbed to 8.3%, with YouTube remaining its only serious rival—YouTube's share increased from 9.9% a year ago to 12.8% in June, according to Nielsen. If current trends hold, this reporting quarter could mark another strong performance for Netflix.
However, is the outlook truly that bullish?
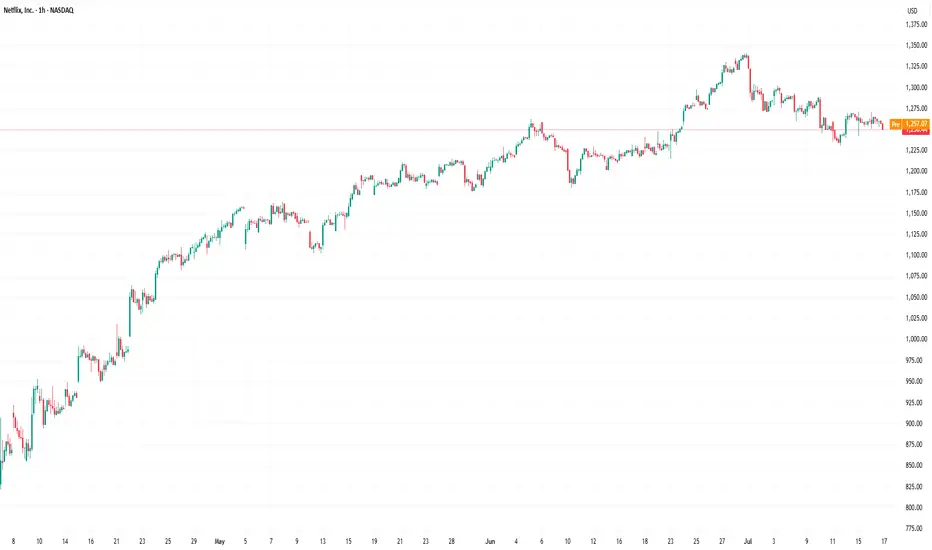
Technical analysis of NFLX stock chart
The NFLX stock price is currently moving within an ascending channel (marked in blue), and it is now testing the lower boundary of this formation. Of concern is the recent pronounced bearish movement (B), which has dragged the stock from the channel’s upper boundary to its lower edge—erasing the bullish momentum (A) that followed the breakout above the $1,250 resistance level.
What’s next?
→ On the one hand, bulls may attempt to resume the upward trend within the channel.
→ On the other hand, bears could build on their recent momentum (highlighted in red) and break the ascending trend that has been in place since May.
It appears the fate of the current uptrend hinges on the market’s reaction to today’s earnings release.
This article represents the opinion of the Companies operating under the FXOpen brand only. It is not to be construed as an offer, solicitation, or recommendation with respect to products and services provided by the Companies operating under the FXOpen brand, nor is it to be considered financial advice.
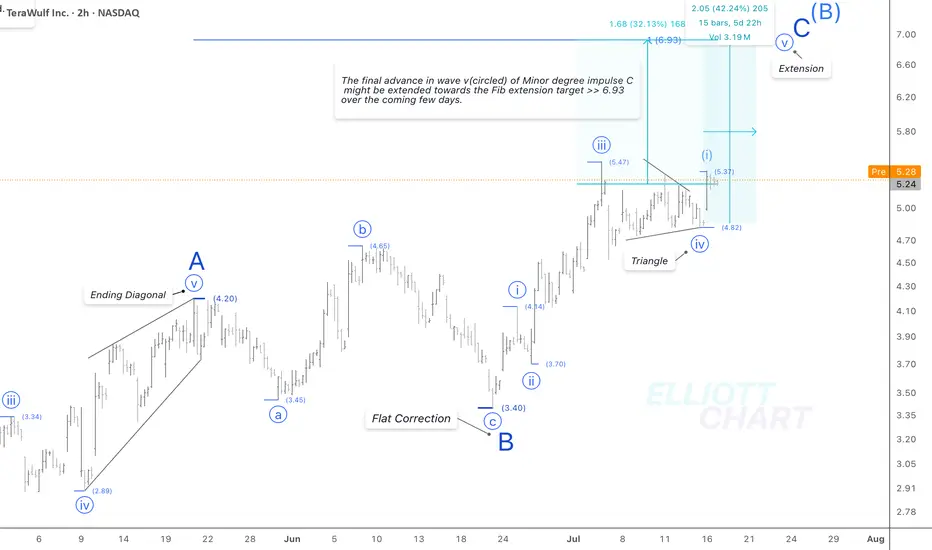
WULF / 2hAs depicted in the 2h-frame above, NASDAQ:WULF might extend its final advance in an impulsive extension of wave v(circled) of the ongoing Minor degree wave C. Hence, the target would adjust to the Fib extension target at 6.93.
Wave Analysis >> The triangle correction in wave iv(circled) worked well, followed by an initial swift advance of the same degree wave v(circled), which would likely extend towards the Fib extension target >> 6.93. So, an advance of 32% lies ahead to conclude the Minor degree wave C of the entire correction in an A-B-C zigzag as a countertrend advance in Intermediate degree wave (B).
Trend Analysis >> After completion of the Minor degree wave C, the countertrend advance of Intermediate degree wave (B), which has developed since April 9, will probably change to decline in the same degree wave (C) in the coming few days!
And it'll likely last until the end of the year!!
NASDAQ:WULF CRYPTOCAP:BTC MARKETSCOM:BITCOIN
#CryptoStocks #WULF #BTCMining #Bitcoin #BTC
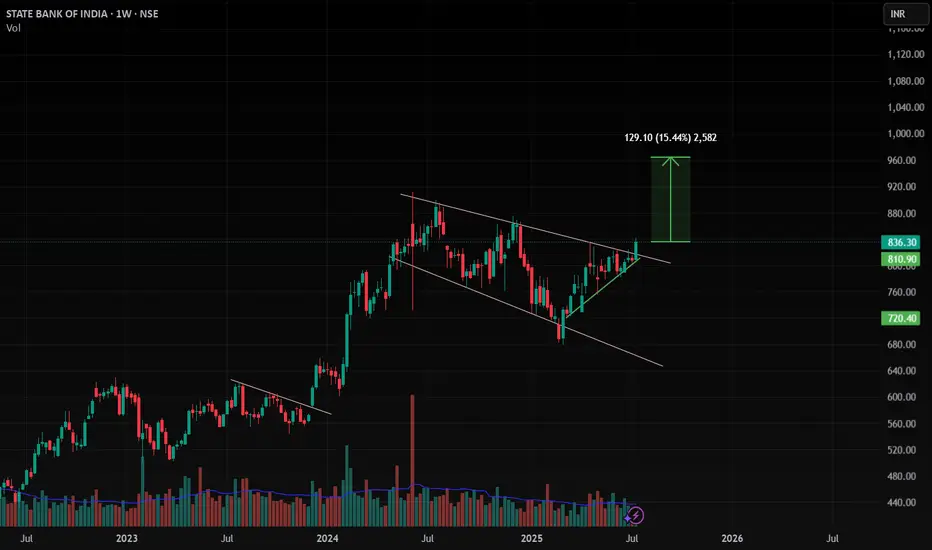
SBIN , 1W , Bullish As the Pattern is Formed and given Breakout , enter after strong candle close in weekly Timeframe and put SL below Swing low . follow proper risk management
follow for more swing ideas like this
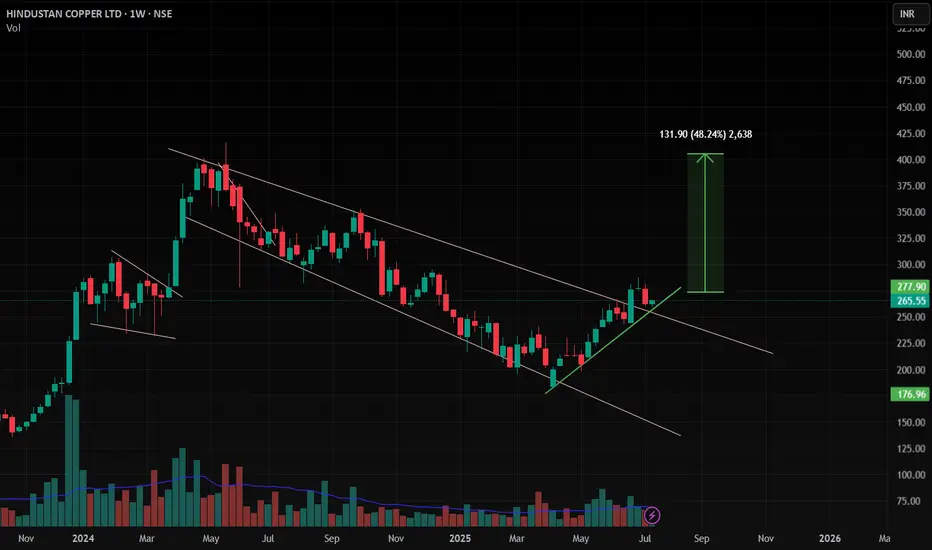
HINDCOPPER , 1W , Bullishthe Pattern is already broken out and now it is at Retest point wait patiently for strong close in weekly . then enter with proper risk management , keep SL below its Swing Low
Follow for more Swing ideas like this
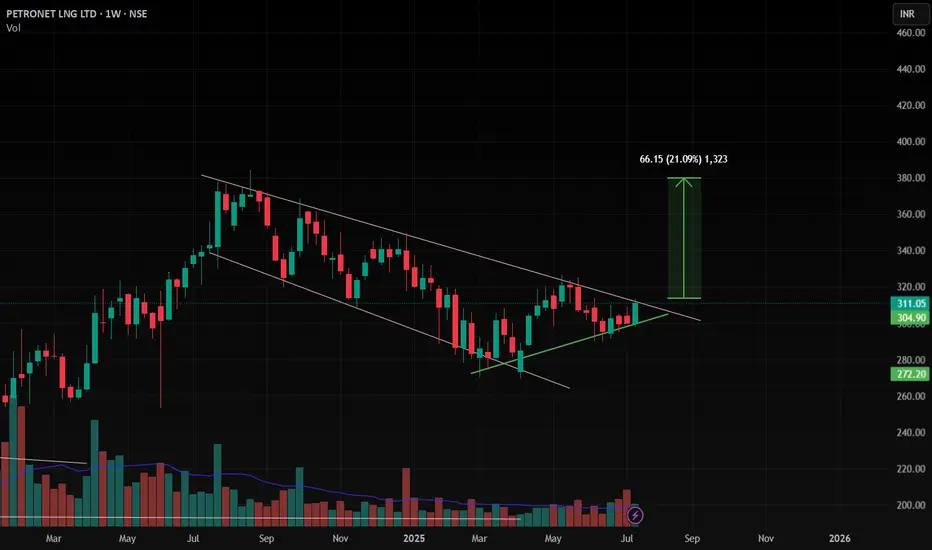
Petronet , 1W , BullishAs the Pattern is Formed and Ready for Breakout , enter after strong candle close in weekly Timeframe and put SL below Swing low . follow proper risk management
follow for more swing ideas like this