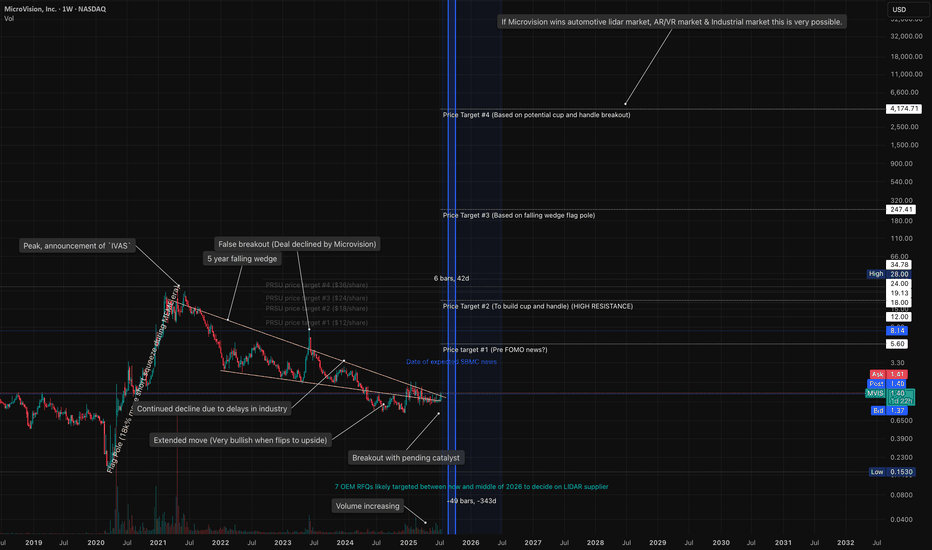
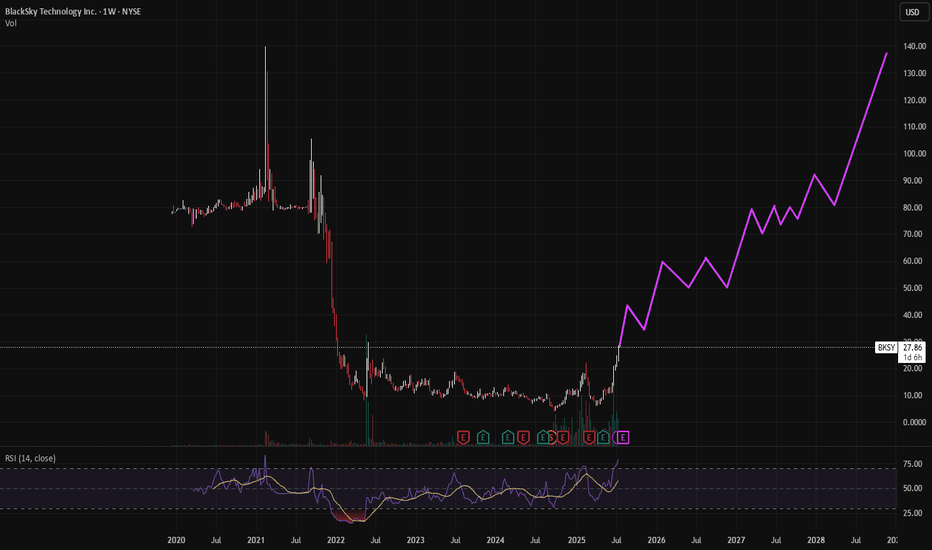
Markets Converging MVIS market changing potentialMicrovision is weeks away from hitting an intense inflection point.
Pending news for SBMC (decision date August 29th )
Microvision is partnered with NVDA for their driving lidar and software -- and have a plug and play system better than any competitor. (an update was made to MVIS website while not yet on the NVDA website. Possibly indicating pending news related)
Industrial contracts are positioned to come in by September of this year.
Potentially in the month of August/September MVIS could announce news of wins in 3 different verticals absolutely flipping the bear base upside down. causing an insane short squeeze. (to TRUE/FAIR market evaluations)
The 5 year chart I have shown indicate moves and price targets as well as time frames for news. The consolidating 5 year wedge can also be seen as wyckoff accumulation. There are multiple indicators implying bullish divergences on the 5 year time frame. People WANT MVIS.
These markets MVIS are entering are HUGE and going to grow astronomically. The potential upside if MVIS is established as the key player could be INSANE.
Lidar competitors have typically 1 vertical. Microvision has 5.
I believe the catalyst to all of this is news related to SBMC. industrial and automotive OEMs are conservative and want a company that will survive to fulfill their needs. an SBMC would guarantee survivability and military approval.
I believe multiple OEMs are waiting for this exact moment. if MVIS is selected by the DoD, then a domino effect will happen in all 3 markets.
META, GOOGLE, APPL will also then see the AR tech validated & may proceed with trying to buy them out or purchase licenses.
This stock, could be THE stock of a lifetime.
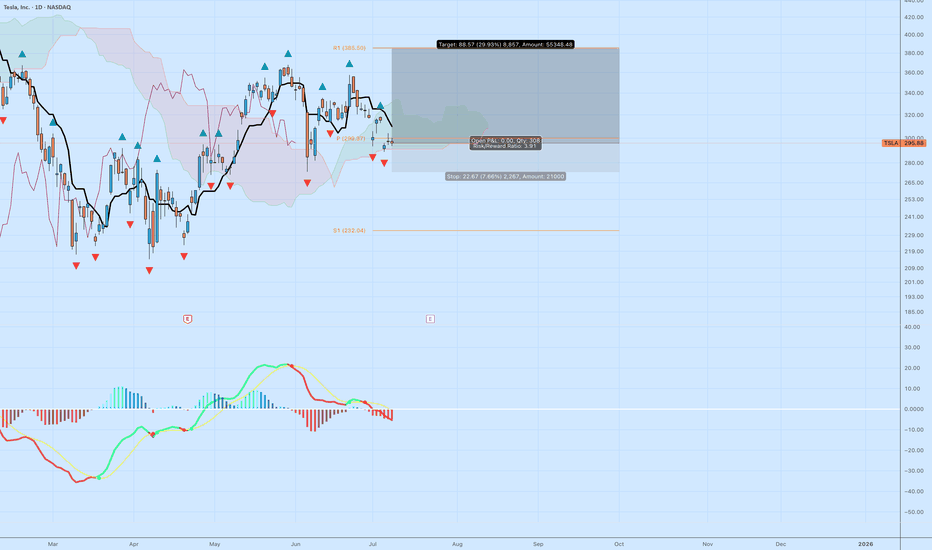
TSLA: High R/R Bounce Play Off the Cloud EdgeTesla NASDAQ:TSLA is sitting at a decision point — testing the edge of the Ichimoku cloud while momentum resets. The setup isn’t confirmed, but the risk/reward is compelling for those watching structure.
🔍 Technical Breakdown
Cloud Support: Price is holding right at the top of the cloud. A breakdown would signal trend weakness, but for now, it's a potential bounce zone.
MACD: Momentum has cooled off, but no bullish crossover yet. Early signs of a flattening histogram could suggest a pivot.
Structure: Horizontal support near $292–295 has held multiple times. If this zone holds again, the upside target opens up quickly.
🎯 Trade Specs
Entry: $296.88
Target: $385.50 (+29.93%)
Stop: $274.21 (–7.66%)
Risk/Reward: 3.91 — solid asymmetry
💡 Trading Insight:
This isn’t about calling bottoms — it’s about defining risk. When price compresses at known support, and you’ve got a 3.9 R/R profile, you don’t need to be right often to be profitable.
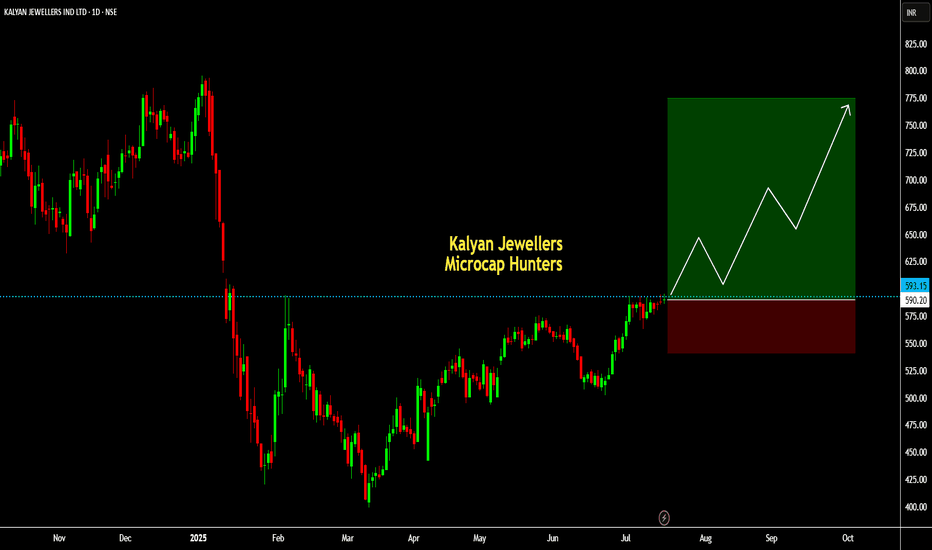
Kalyan Jewellers (Swing):Kalyan Jewellers (Swing):
Kalyan is getting ready to break the past crucial supply zone.
Signs of remarkable consolidation and a strong base formation is quite convincing.
Trade offers a RR of more than 1:3.
Check out my earlier views for a better understanding.
Note: Do your own due diligence before taking any action.
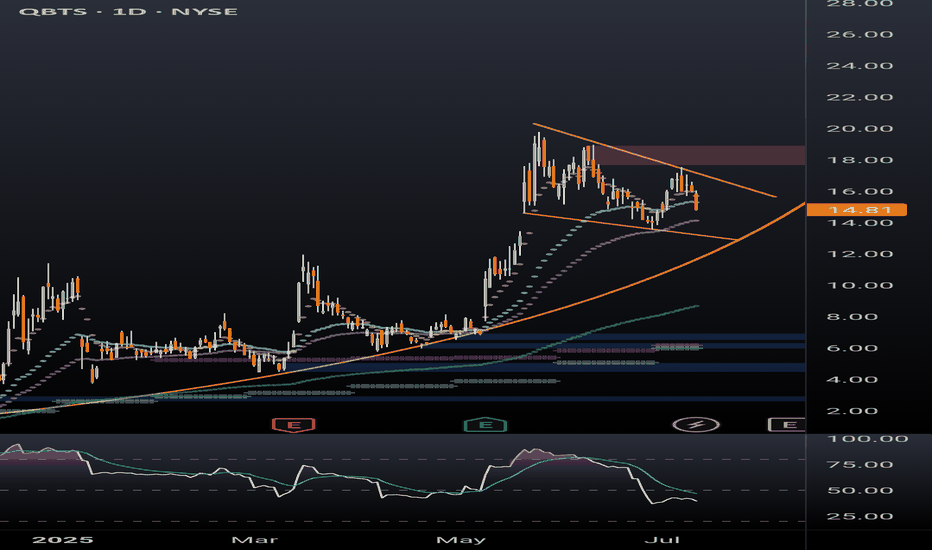
QBTS bull flag dailyBetter look at quantum computing ticker QBTS bull flag on the daily timeframe. Previous post looked at the weekly timeframe to highlight the bullish momentum. Lots of retail money piled into this one in the last few months, a breakout of this bull flag will likely be followed by a parabolic move.
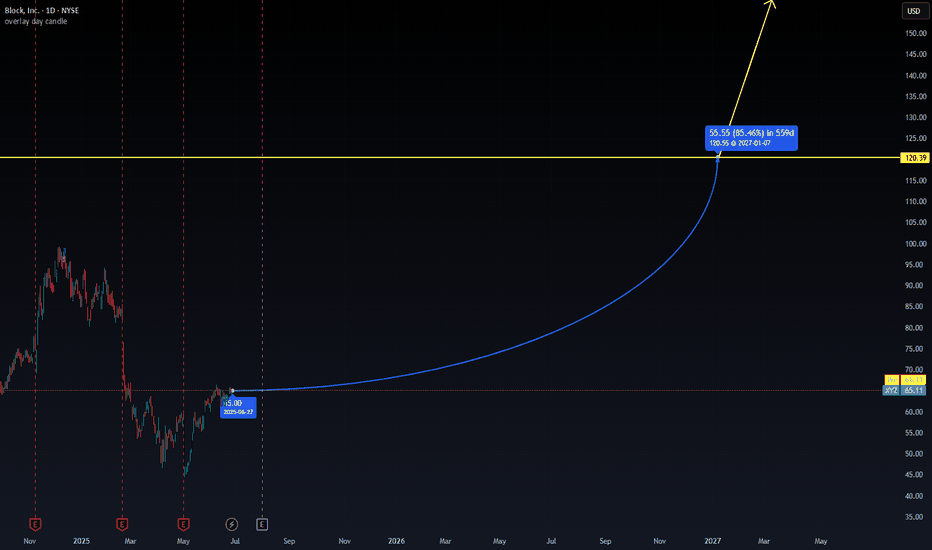
A BNPL Bubble Is Actually Why I'm Bullish, For NowBNPL is growing and inflating at an increasing rate. From concert tickets to burritos, everyone is using buy now pay later. The global market is projected to hit 560 billion dollars in 2025, up from around 492 billion in 2024, and climb to 912 billion by 2030 at a compounding growth rate of 10.2%. Just in the U.S. alone, demand is expected to reach 122 billion next year and scale to 184 billion by the end of the decade. The trajectory is steep, with the structural weaknesses already showing.
Block is positioned at the center of BNPL. In Q1 2025 they reported:
2.29 billion in gross profit, up 9 percent YoY
466 million in adjusted operating income, up 28%
10.3 billion in GMV through Afterpay, with 298 million in BNPL gross profit, up 23% YoY
The stock took a hit. It dropped 9 percent in February and another 21 percent after missing Q1 earnings, but this is seen as typical early bubble behavior. There is short term fear but continuing growth and acceleration. Klarna’s credit losses, IPO delays, and regulatory friction are not problems, they are actually signals that the sector is growing faster than the market, or quite frankly, anyone can control.
BNPL is becoming the default credit system for younger consumers. It is overused and expanding too fast. That is the formula for both upside and implosion. However with that, timing will be everything here, and knowing when to close will be crucial if BNPL can't stabilize.
Baseline expectation: SQ trades in the 80 to 90 range in the short term
Midterm upside: 120 by 2027
Long-term target: 180 to 220 if BNPL stabilizes and Block captures its runway
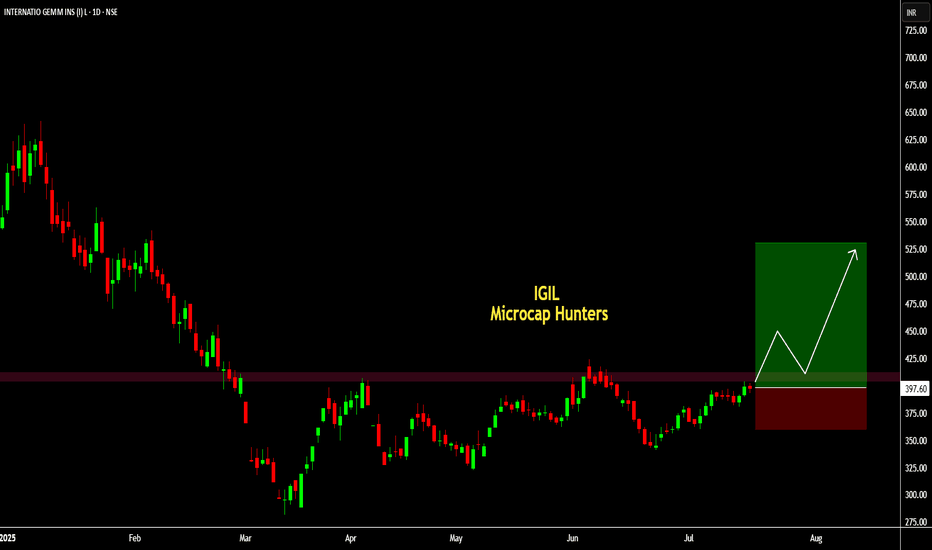
IGIL (Swing):IGIL (Swing): A great investment idea.
IGIL has formed a classic VCP pattern and is getting ready to pass through the crucial resistance.
ROC, ROCE, ROA and OPM >40.
Trade offers a RR of more than 1:3.5.
Check out my earlier views for a better understanding.
Note: Do your own due diligence before taking any action.
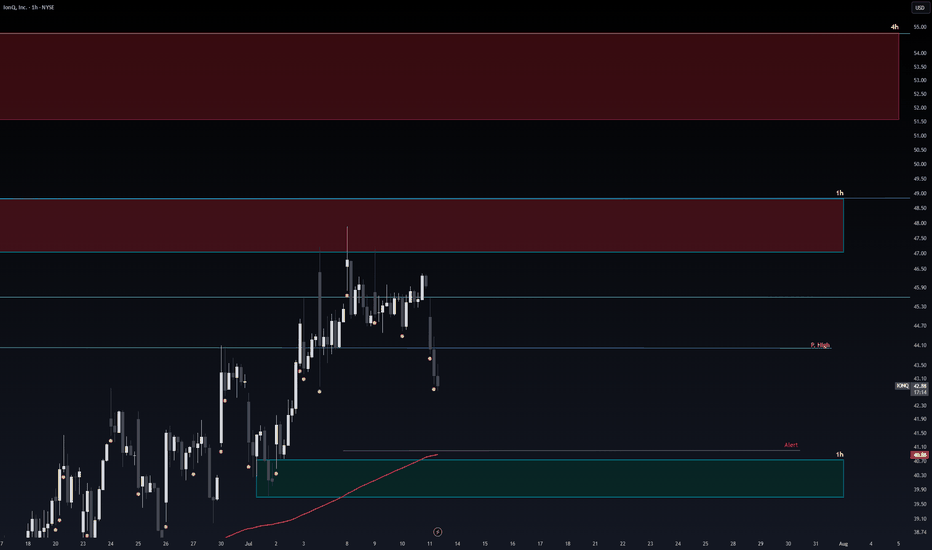
Safe Entry IONQGreen Zone is Safe Entry.
Stop loss below Green Zone (or blue line both are supports with 200MA below too).
Red Zone is Sell.
Note: each line(E.g. blue lines) acts as Strong Support/Resistance.
Note: 1- Potentional of Strong Buying Zone:
We have two scenarios must happen at The Mentioned Zone:
Scenarios One: strong buying volume with reversal Candle.
Scenarios Two: Fake Break-Out of The Buying Zone.
Both indicate buyers stepping in strongly. NEVER Join in unless one showed up.
2- How to Buy Stock (safe way):
On 1H TF when Marubozu/Doji Candle show up which indicate strong buyers stepping-in.
Buy on 0.5 Fibo Level of the Marubozu/Doji Candle, because price will always and always re-test the
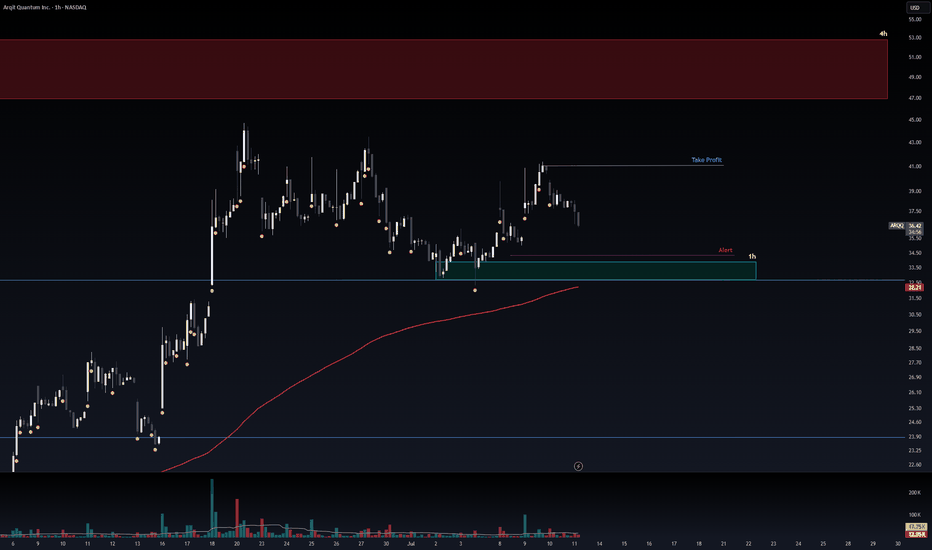
Safe Entry Zone ARQQGreen Zone is Safe Entry.
Stop loss below Green Zone (or blue line both are supports with 200MA below too).
Note: 1- Potentional of Strong Buying Zone:
We have two scenarios must happen at The Mentioned Zone:
Scenarios One: strong buying volume with reversal Candle.
Scenarios Two: Fake Break-Out of The Buying Zone.
Both indicate buyers stepping in strongly. NEVER Join in unless one showed up.
2- How to Buy Stock (safe way):
On 1H TF when Marubozu/Doji Candle show up which indicate strong buyers stepping-in.
Buy on 0.5 Fibo Level of the Marubozu/Doji Candle, because price will always and always re-test the
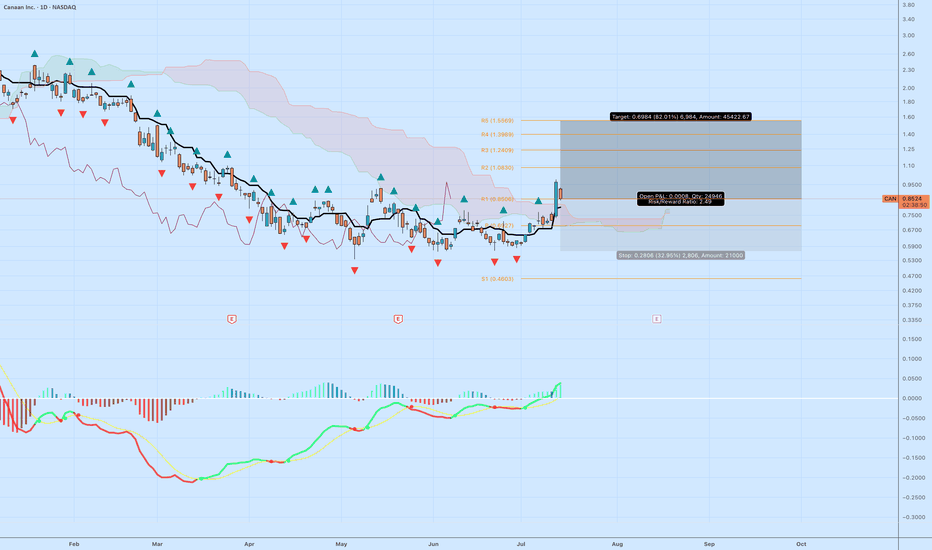
CAN Long: Bullish Reversal Setup with Upside Potential to 1.55Canaan Inc. ( NASDAQ:CAN ), a key player in Bitcoin mining hardware, has endured a steep downtrend throughout 2025, sliding from peaks near 3.50 down to recent troughs around 0.80 amid crypto sector headwinds. However, the chart is flashing signs of exhaustion and a potential bullish reversal, with price stabilizing and momentum indicators turning positive.
Technical Analysis:
Price Action and Structure: After a series of lower highs and lows, the stock has bounced from support near 0.80, with the latest close at 0.8503 showing buyer interest. Price is pushing against a descending trendline (red down-arrows) and exiting a consolidation cloud (likely Ichimoku Kumo, shaded purple), which could transition from resistance to support on a sustained breakout.
Key Levels:
Support: Immediate floor at recent lows (~0.80), with deeper support at S1 (0.4603) if selling resumes.
Resistances: Layered overhead including R1 (1.0666), R2 (1.0830), R3 (1.2409), R4 (1.3969), and R5 (1.5669). Targeting the higher end near 1.55 aligns with extension toward R5 for a stronger move.
Indicators:
The lower panel oscillator (resembling MACD with red/green bars and lines in red, green, yellow) displays a bullish crossover: green line above red, histogram shifting from red (bearish) to blue/green (bullish). This suggests momentum divergence and potential for upside continuation.
Volume spikes on recent upticks reinforce buying pressure.
Trade Setup:
Entry: Enter long at current levels around 0.85, or wait for a close above cloud resistance (~0.90) for confirmation.
Target: Take profit at 1.55 (near R5 confluence), offering approximately 82% upside from entry based on chart projections and historical patterns.
Stop Loss: Place below key support at 0.57 to account for volatility, providing room for minor pullbacks while protecting capital.
Risk/Reward Ratio: About 2.5:1 (reward of 0.70 vs. risk of 0.28 per share), a solid setup for the potential reversal in this high-volatility stock. Size positions to risk 1-2% of total capital max.
Invalidation: Exit if price breaks decisively below 0.57, signaling downtrend resumption toward lower supports.
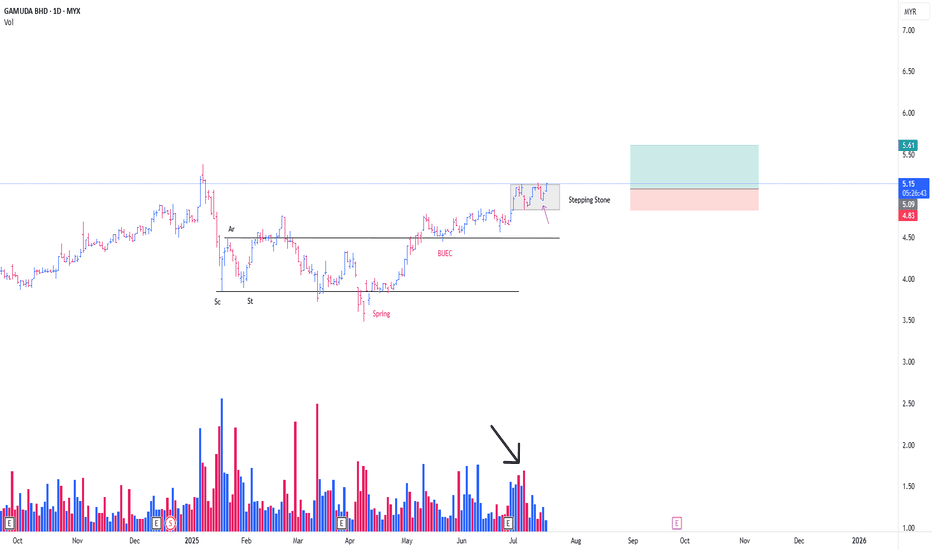
GAMUDA CONT MARKING UP PHASEThis is a continuation from my prev post
**Refer to the link below
This is a play coming from the Stepping Stone (SS)
-SS is a term, in wcykoff methode , particularly describing a momentarily 'pause' in between, consecutive mark up phase.
Absoprtion detected from the on going SS
*Black arrow
with the possibility of Trigger Bar today, in the background of SpringBoard Schematic #2 *Purple arrow
-Position initiated as attached
PureWyckoff
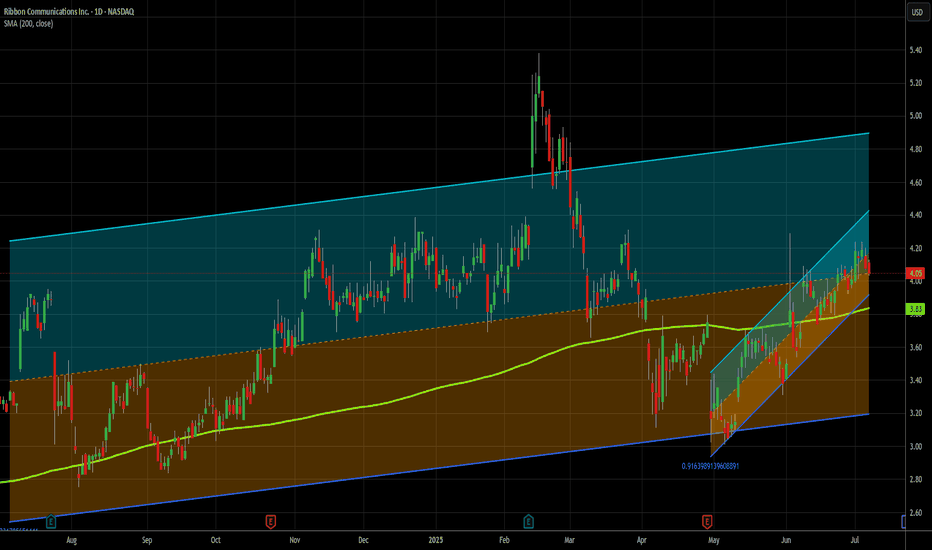
Small cap is the flavor of the day - Long at 4.05I decided to do a small cap stock today. I don't use too many of these as ideas, though I do trade them on my own. I don't usually publish about them because they are inherently more risky than large cap, established stocks. And to be fair, RBBN has a spotty history from a chart perspective.
Go ahead and zoom on out all the way. See that? That's what danger looks like. This stock has lost 80% of its value in the last 10 years, and 50% in the last 4. However, in its defense, it is profitable on a reported earnings basis over the last 12 months, and has held its own for several years now, and that's why I'm not AS nervous as I might otherwise be publishing this.
Additionally, it's solidly above its 200MA and in both a 1 year and 2 month uptrend, so its recent strength is good. I haven't dug down all the way back to its debut, but I suspect I'd have at the very least had a challenge making money on this one over its entire existence. But I am not trading its entire existence today. 75% of the trades in this stock in the last year would have closed in under 2 weeks, so the short term picture is what I'm mostly looking at here, and over the last month or so this has been a very solid stock. Could that change tomorrow? Yup. But I don't have that crystal ball. All I can do is rely on the system that has of late produced excellent results here.
In the last 12 months, there have been 27 buy signals here. 25 closed profitably and 2 are still open and down 18% and 9%, respectively. INCLUDING the losers, however, the median daily return on those trades has been .48% (>10x the market avg) and the average daily return is 1.02% (> 23x the avg daily market return).
Trading is about balancing risks and rewards. This stock is riskier than most, but the rewards are a lot better, too. I don't put all my money into any one trade - that's a TERRIBLE idea. The vast majority of my open trades are relatively safe, large cap stocks. But risky has its place in a portfolio. I made 15% in 2 days recently on QUBT (I posted that trade here) and made almost 18% on NUTX in the last 2 days - just closed that trade today. As a % of my portfolio of trades, ones like that can be small positions, but make a meaningful impact. That's my hope for RBBN here.
Of the 25 winning trades in the last year, over half produced a gain of 4% or more. And the average holding periods of the winners was only 8 days, with 15 of the 25 closing in a week or less. That rapid return also reduces the risk in a stock like this one. Wnen you only stick around for a few days most of the time, it's harder (not impossible) to get caught holding the bag during a drop.
My close will be signal based, and not a particular price target, but the trades I referred to above on RBBN give a good outline. However, the 2 losers have been open since February, so be forewarned that IF you follow me on this one, you might need to buckle your chinstrap. It could get bumpy.
As always - this is intended as "edutainment" and my perspective on what I am or would be doing and why, not a recommendation for you to buy or sell. Act accordingly and invest at your own risk. DYOR and only make investments that make good financial sense for you in your current situation.
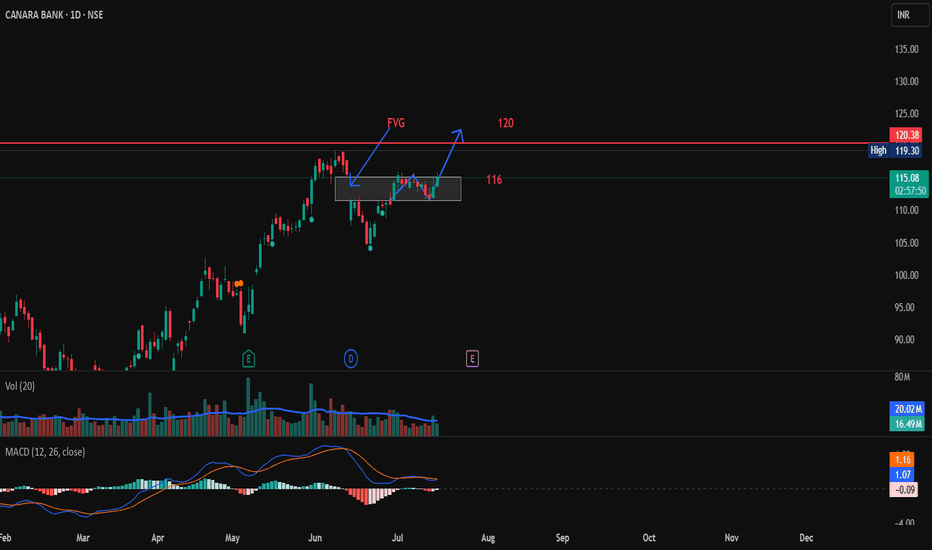
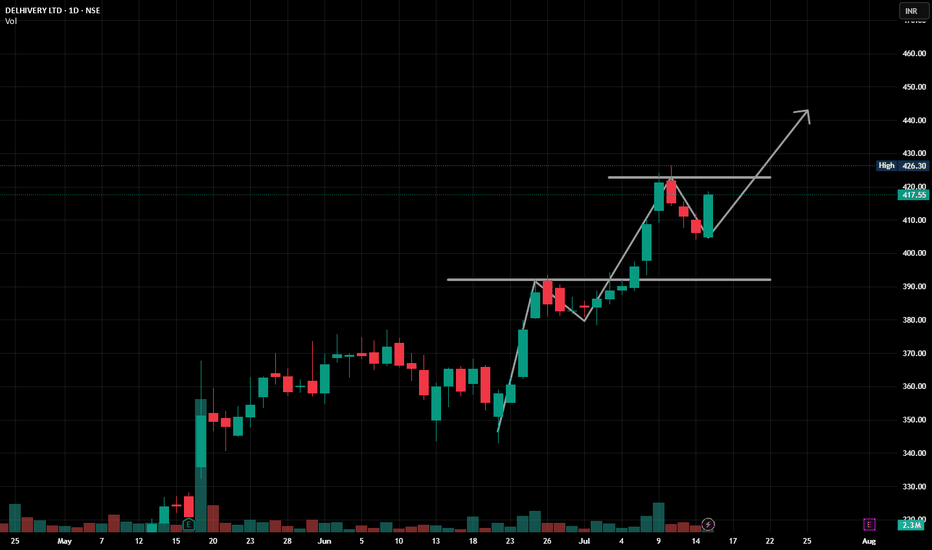
Bullish structure in play!NSE:DELHIVERY
Bullish structure in play!
Forming higher highs & higher lows
Strong bounce from ₹405 support
Eyes on breakout above ₹426.30
Volume confirms buying interest again
More importantly, during this time, NSE:DELHIVERY usually goes to ₹450 as shown here:
https: //www.
Next target? Possibly ₹440–450+ if momentum holds 💪
Let’s see if this delivery gets shipped 🚚📦
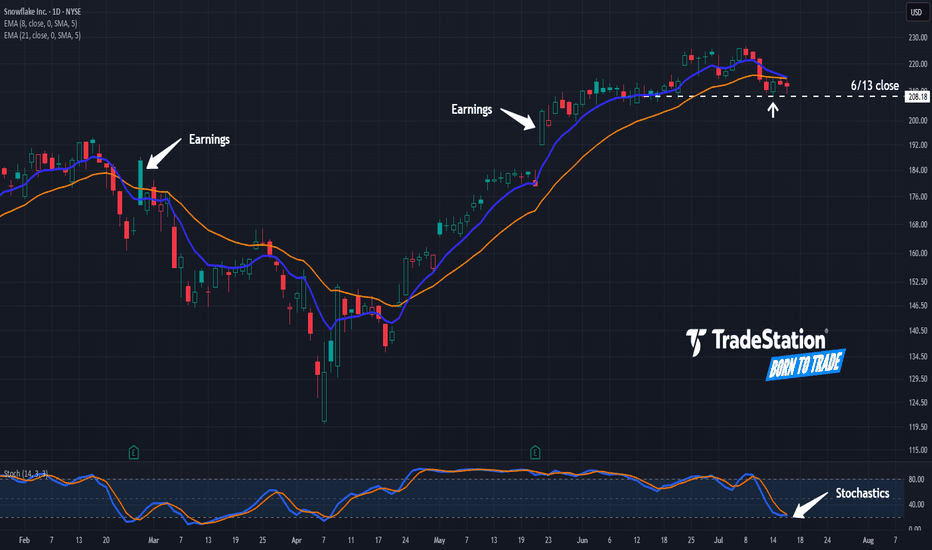
Snowflake Pulls BackSnowflake jumped to a new 52-week high last week, and now it’s pulled back.
The first pattern on today’s chart is the pair of price jumps after the last two quarterly reports. Those may reflect bullish sentiment in the software company.
Second is the June 13 weekly close of $208.18. SNOW appears to be stabilizing after revisiting that level, which may suggest support is in place.
Third, stochastics neared oversold territory and are now trying to turn higher.
TradeStation has, for decades, advanced the trading industry, providing access to stocks, options and futures. If you're born to trade, we could be for you. See our Overview for more.
Past performance, whether actual or indicated by historical tests of strategies, is no guarantee of future performance or success. There is a possibility that you may sustain a loss equal to or greater than your entire investment regardless of which asset class you trade (equities, options or futures); therefore, you should not invest or risk money that you cannot afford to lose. Online trading is not suitable for all investors. View the document titled Characteristics and Risks of Standardized Options at www.TradeStation.com . Before trading any asset class, customers must read the relevant risk disclosure statements on www.TradeStation.com . System access and trade placement and execution may be delayed or fail due to market volatility and volume, quote delays, system and software errors, Internet traffic, outages and other factors.
Securities and futures trading is offered to self-directed customers by TradeStation Securities, Inc., a broker-dealer registered with the Securities and Exchange Commission and a futures commission merchant licensed with the Commodity Futures Trading Commission). TradeStation Securities is a member of the Financial Industry Regulatory Authority, the National Futures Association, and a number of exchanges.
TradeStation Securities, Inc. and TradeStation Technologies, Inc. are each wholly owned subsidiaries of TradeStation Group, Inc., both operating, and providing products and services, under the TradeStation brand and trademark. When applying for, or purchasing, accounts, subscriptions, products and services, it is important that you know which company you will be dealing with. Visit www.TradeStation.com for further important information explaining what this means.
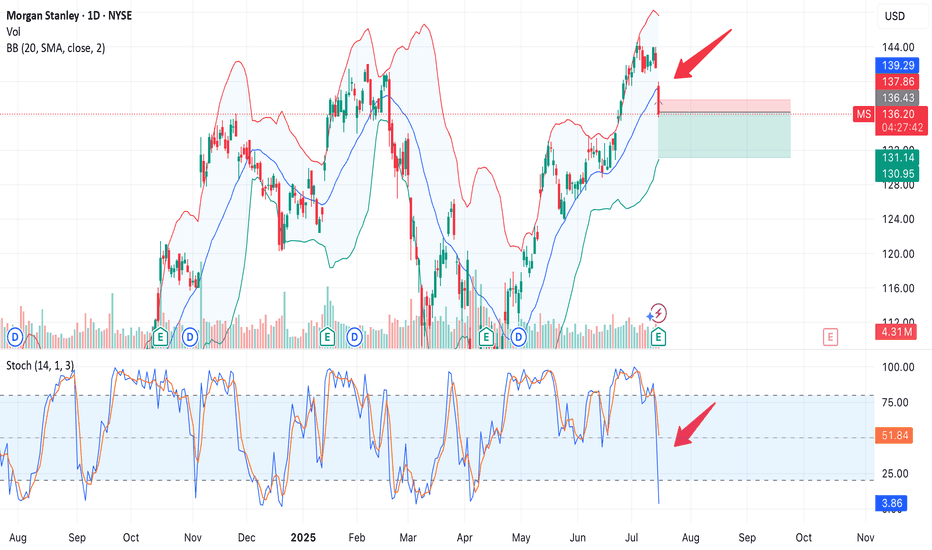
Morgan Stanley: Post-Earnings Reaction & Technical SetupToday, NYSE:MS released strong earnings:
🔹 $2.13 EPS vs. expected $1.98
🔹 Revenue: $16.8B, including:
— +23% in equity trading
— +9% in fixed income
— $59B inflows into Wealth Management
Despite the beat, the stock dropped nearly 4%, signaling possible profit-taking after a 30%+ rally year-to-date.
Technical View
The price broke below the middle line of the Bollinger Bands, heading toward the lower band.
The Stochastic RSI turned sharply lower, confirming downside momentum.
Volume on the decline is above average — a bearish sign.
🟦 Key support lies around $130–131, a zone to watch for a potential bounce.
🟥 A breakdown below it could open the way to $127–128.
The market may have priced in the strong results ahead of time, leading to a sell-the-news reaction.
We now see a potential correction toward the $131 area — where buyers might step in.
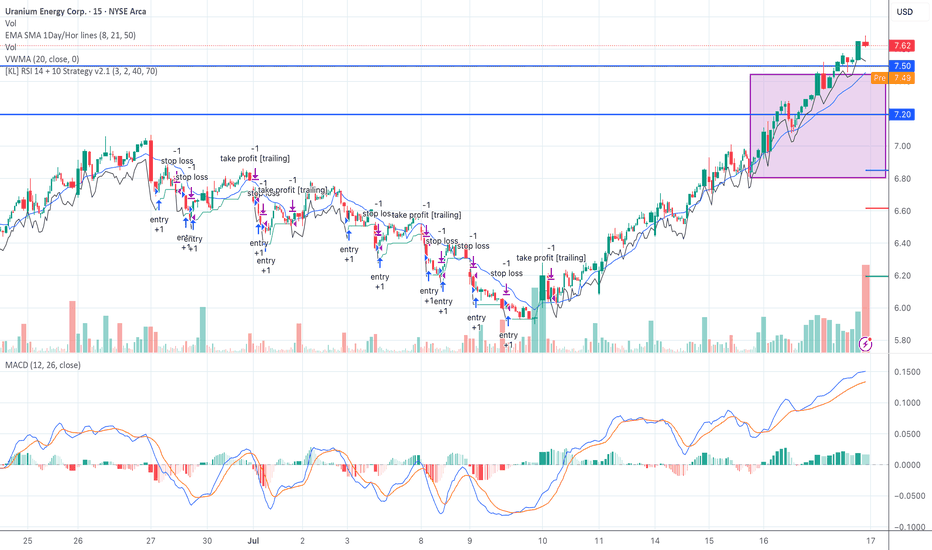
UEC Box Breakout Confirmed – Riding VWMA on VolumeUEC broke out of the $6.80–$7.45 box with volume and is holding strong. VWMA rising, MACD trending, and RSI strategy taking partials.
Watching $8.00 for target, $7.20 as trailing stop zone.
Classic Seed System box breakout — low risk, clean structure.
#UEC #SeedSystem #BreakoutTrade #VolumeConfirmation #UraniumStocks
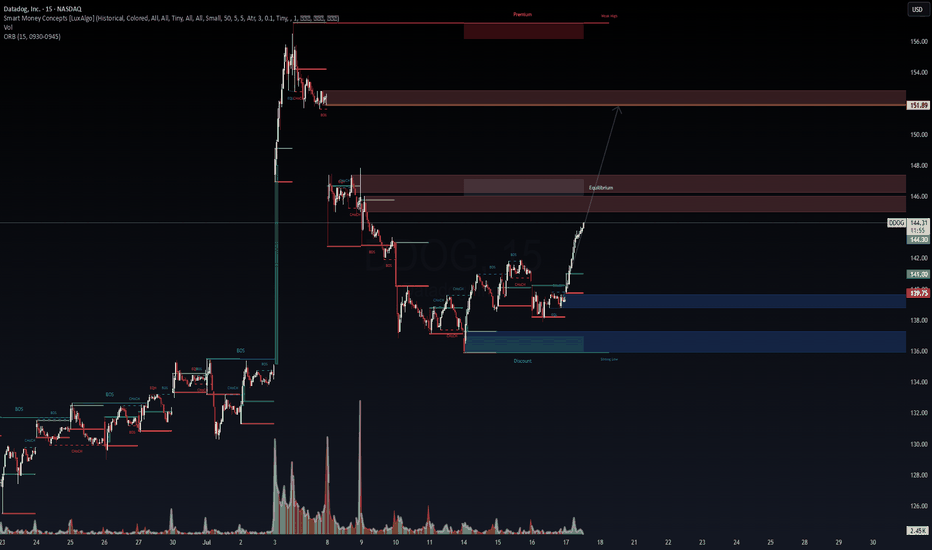
DDOG 15m – Discount Reversal Targeting $151.89 | VolanX Protocol📈 Datadog (DDOG) has completed a clean bullish structural shift off a deep discount zone, rejecting institutional demand around the $137–139 range. Now breaking above key internal CHoCH and BOS levels, price is accelerating into equilibrium, suggesting momentum is building toward premium inefficiencies.
🔍 Technical Breakdown:
Massive previous BOS on July 3rd led to an overextended move that’s now correcting.
Strong reclaim above $141 (ORB high and demand imbalance).
Price swept strong low and confirmed bullish intent via nested CHoCH → BOS → continuation.
Heading into low-resistance volume node up to $146 equilibrium, then targeting $151.89 premium supply.
📌 Critical Zones:
Demand (Support): $139.75 → $137.00 → $136.00 (discount + strong low zone)
Equilibrium Zone: $145.80–146.40 (short-term reaction likely)
Target Liquidity Zone: $151.89 (Premium + prior weak high)
📊 VolanX Protocol Read:
This setup aligns with a VolanX Reversal Protocol. The SMC framework suggests a fully developed market structure cycle (markdown → accumulation → markup). Price action is supported by consistent BOS levels and bullish reaccumulation signs.
🧠 Probabilistic Price Model:
70% → $145.8–146 (reaction near EQ + mitigation)
45% → $151.89 full premium sweep
15% → Breakdown below $139.75 invalidates bullish thesis
⚠️ VolanX Standard Disclosure:
This post is for strategic modeling and educational purposes only. It reflects WaverVanir's internal DSS logic, not financial advice. Always backtest and confirm your execution model.
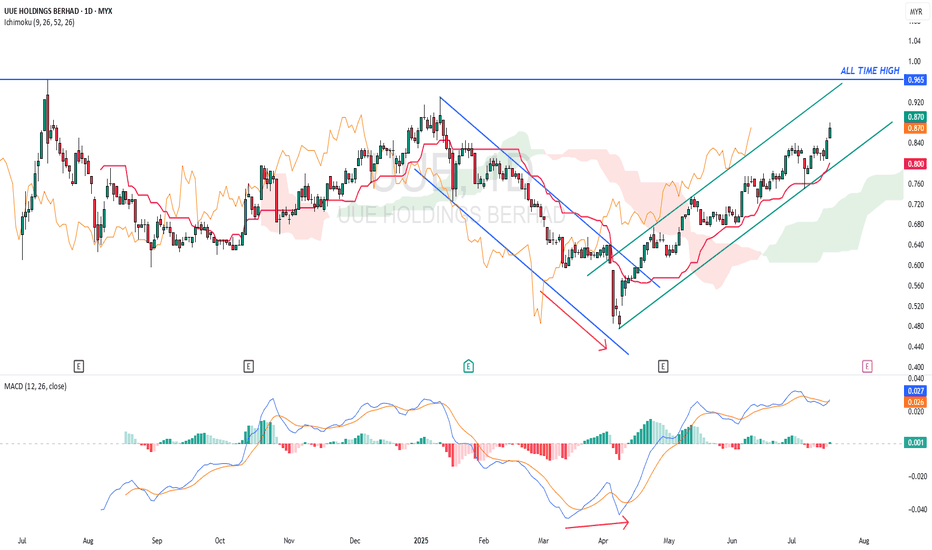
UUE - Potential hit All Time High ?UUE - CURRENT PRICE : RM0.870
The downtrend from January 2025 to April 2025 had changed to uptrend after the stock broke out the descending channel. Take note that there was a bullish divergence in MACD before the breakout of channel.
ICHIMOKU CLOUD traders may take note that the KIJUN SEN is rising steadily and CHIKOU SPAN also moving above candlesticks - indicating stock is uptrending. Today's closing price is higher than previous day's close suggesting a bullish breakout buy signal. A close below the KIJUN SEN may indicate a trend reversal (KIJUN SEN acts as support level).
ENTRY PRICE : RM0.865 - RM0.870
TARGET PRICE : RM0.930 , RM0.965 and RM1.03
SUPPORT : KIJUN SEN (cutloss if price close below KIJUN SEN)
