Picked Up More OKTATraders,
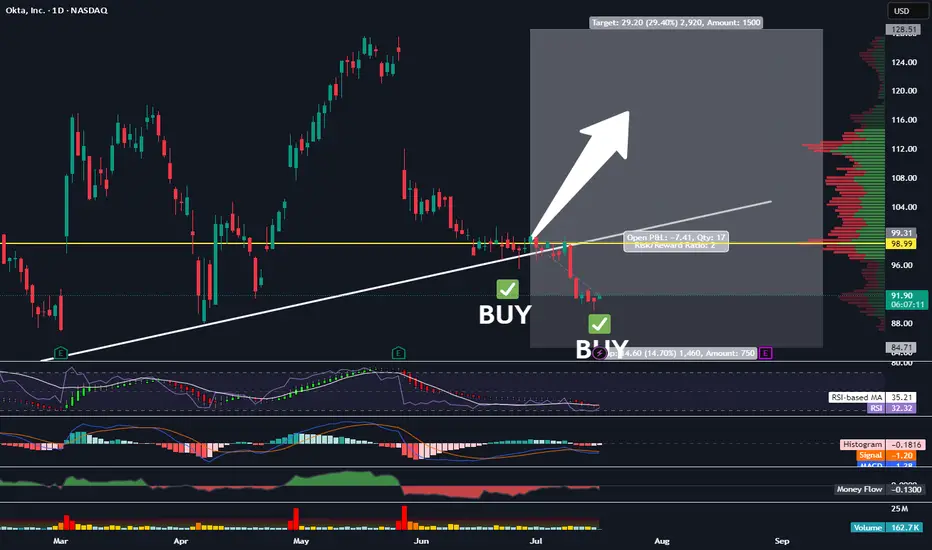
We’re nailing it in the stock division. Our portfolio has gained nearly 30% since the inception of our new indicator in Sept. of last year. And we’ve done that with 50% of our cash on the sidelines nearly the entire time, further reducing risk. It is amazing how I stumbled upon this new trade strategy purely by accident. Not by following anyone else on Youtube or TradingView or X. But simply by doing what I love to do and spotting trends and patterns. The combo of the indicators I have been utilizing is truly working, outbesting SPY hodl’ers by 3-to-1 since implementation.
At times, my indicator gives us more than one signal. This usually indicates that the move up will be stronger and more aggressive than previously indicated. Such is the case with our OKTA entry. We’ve got another BUY signal that has been given, and so, I am DCA’ing in. The target and SL will remain the same as our previous entry. All data can be found on the tracker.
Best,
Stew
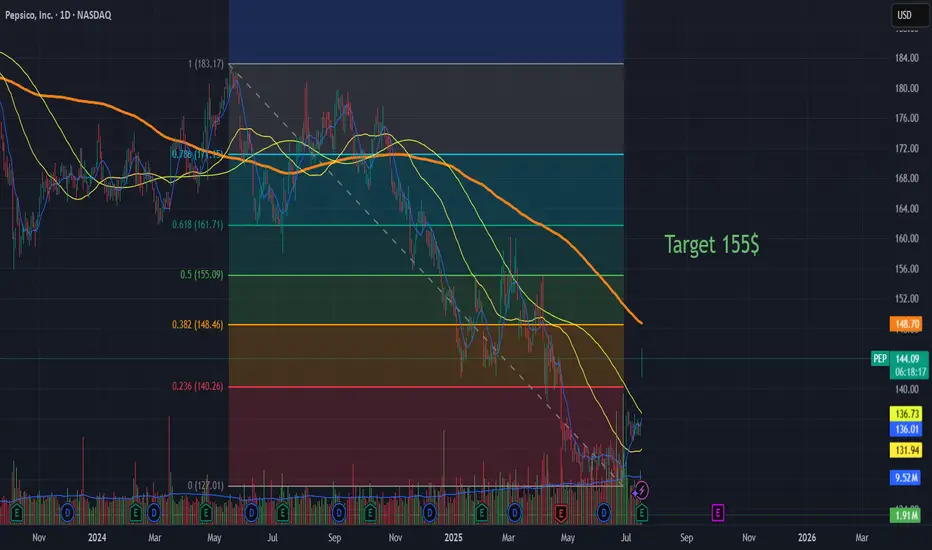
Pepsi can retrace to 155 in short termVery short post:
Pepsi NASDAQ:PEPS had a very good earnings call and based on fb retracement, this will retrace to 155 soon. It has potential to go abive that if the reversal is confirmed.
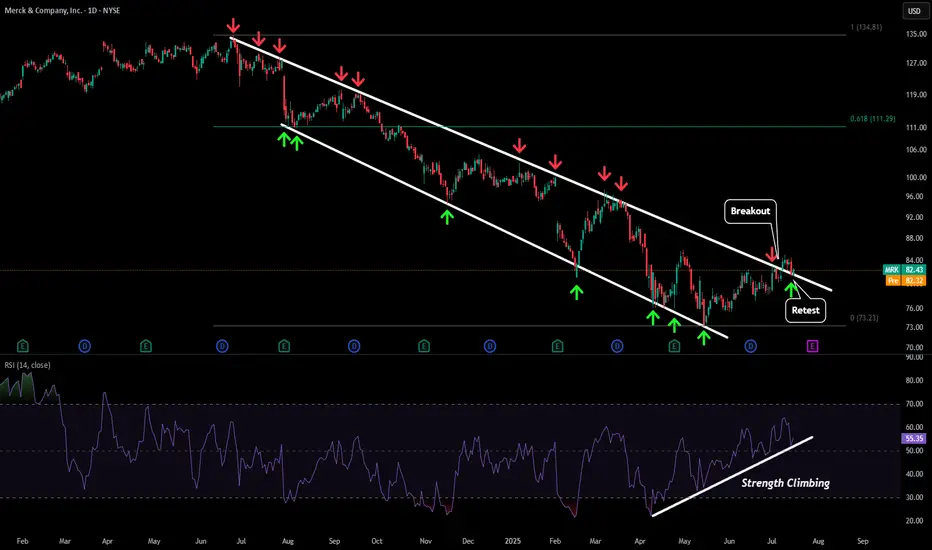
MRK - Retesting BreakoutAfter being in a downtrend for almost a year things finally look like they are starting to turn around for MRK.
Recently price broke the downwards sloping resistance and has retested that level as a new support level. We have also seen strength increasing on our daily RSI bringing some life back into this stock.
Our first price target to the upside would be out LTF target around $88 followed by our 0.618 target around $111.
If we see some serious strength and price climb above our previous ATH we could even see a move towards the $172 level.
MARA Is Waking Up And Looks Promising For The Crypto MarketMARA Is Waking Up And Looks Promising For The Crypto Market, as it can send the price even higher this year from a technical and Elliott wave perspective.
Marathon Digital Holdings with ticker MARA nicely and sharply recovered away from the strong support after a completed projected higher degree abc correction in wave B/2. So, similar as Crypto market, even MARA can be forming a bullish setup with waves »i« and »ii« that can soon extend the rally within wave »iii« of a five-wave bullish cycle within higher degree wave C or 3, especially if breaks above 21 first bullish evidence level. It could be easily supportive for the Crypto market if we consider a positive correlation.

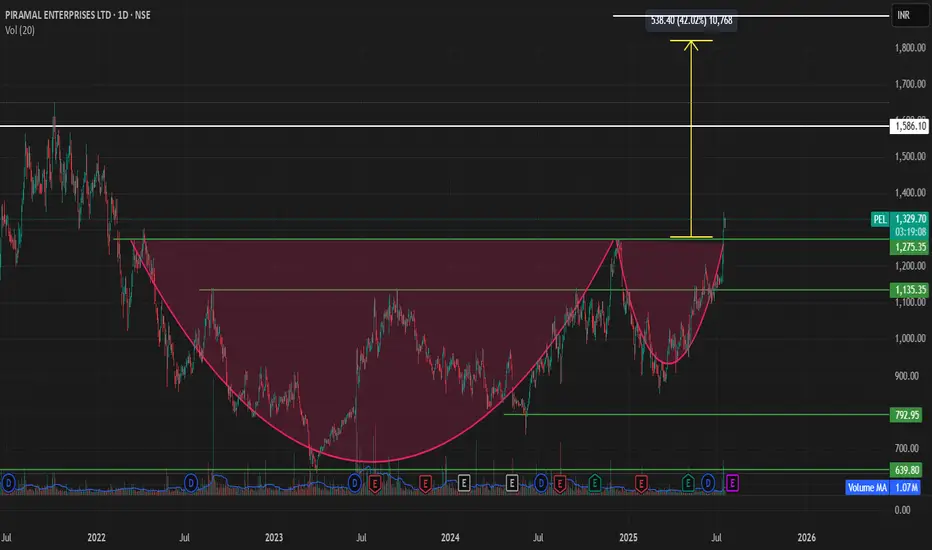
"PEL is having formed a Cup and Handle pattern
*Chart Pattern Identified**:
A **Cup with Handle** formation has been identified on the daily/weekly chart of **Piramal enterprise**, signaling a potential bullish breakout. This classic continuation pattern typically leads to strong upward moves once the handle breakout is confirmed.
🔍 **Breakout Levels and Price Targets**
1. **Primary Breakout Level – ₹1275**
* This marks the neckline of the **Cup with Handle** formation.
* A confirmed breakout at ₹1275 would validate the pattern.
(based on the measured move from the depth of the cup added to the breakout point)
* Acts as a **pre-breakout resistance** or consolidation level.
* A **daily or weekly close above ₹1,275** with strong volume would indicate early momentum and buyer interest.
* **Target after this level is breached**: ₹1275 (primary breakout zone), and if sustained, an extended target of **₹1820**.
### 📌 **Technical Outlook**
| Level | Significance | Action |
| ------ | ------------------------ | --------------------------------------------------- |
| ₹1275| Cup with handle breakout | Key confirmation zone; breakout of pattern |
| ₹1820 | Extended target | Projected move after full breakout confirmation |
---
### 📈 **Trade Strategy**
* **Entry Option 1**: Anticipatory buy near ₹1,275.
* **Entry Option 2**: Breakout confirmation buy above ₹1275 with higher risk-reward toward ₹1820.
* **Volume Confirmation**: Essential at 1275 levels.
* **Stop-loss**: Dynamic trailing stop-loss below handle lows or breakout support zones depending on entry.
---
### ⚠️ **Risk Management & Considerations**
* Ensure confirmation via **volume expansion** and **daily/weekly close** above key breakout zones.
* Be cautious of false breakouts, especially if moves happen on low volume or during broader market weakness.
* Monitor sectoral momentum (capital goods, engineering, or mining equipment) as it may influence breakout strength.
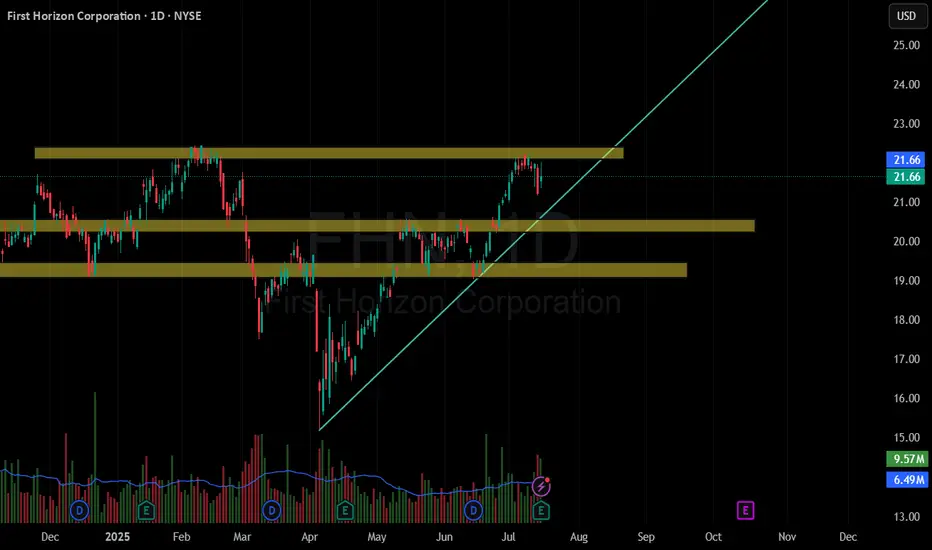
FHNthe last financial news came out good and this means that the fundamentals are good, the technicals are also good.
must buy
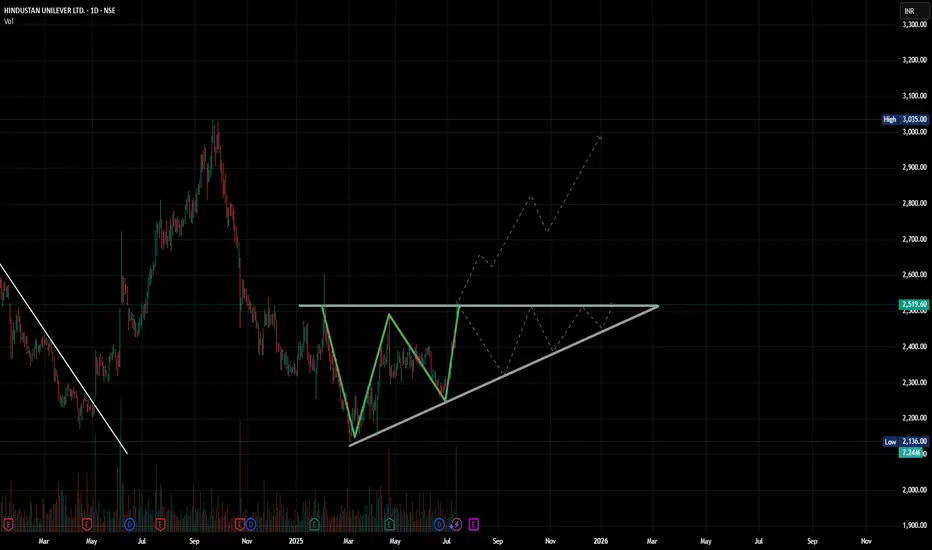
W For Win? HUL Pulls Up with a Perfect Double BottomPrice showing up to resistance like it forgot the last time it got slapped here. But this time it brought volume. Respect?
(Or the probable ascending triangle.. u know?)
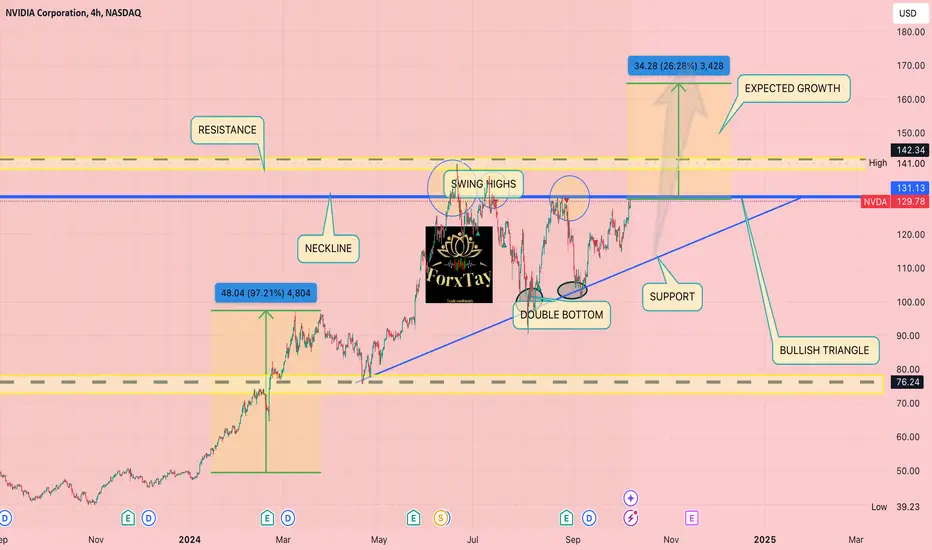
THRIVING IN CHAOSAs elections draws near, the result/outcome will definitely affect the financial market so WHY WILL NVIDIA GROW EVEN WITH THE WW3 LOOMING?
1.NVIDIA is the leaser in the artificial intelligence(AI) and data centre industries, largely due its cutting edge GPUS. These GPUs are essential for training large AI models like OpenAI's GBT series and other machine learning systems.
2.The company's AI- focused hardware, particularly the H100 GPUs ,is essential for training deep learning models ,autofocus vehicles and cloud based AI system
3.NVIDIA is branching into automotive AI and autofocus driving technology, partnering with companies like Mercedes and other automakers to provide the computing power needed for autonomous vehicles.
4.This company has has seen enormous growth in its data centre segment, which now contributes significantly to its revenue
6.The company has made strategic acquisitions, such as MELLANOX, which expanded its data centre and networking capabilities
AS TECHNOLOGY CONTINUE TO EVOLVE ,NVIDIA WILL BE THE CENTRE OF ATTENTION. LONG TERM BUY
There is a bullish structure that has been formed( w pattern) inside a bullish triangle showing a continuation bull movement/mometum coming . good luck on the longs
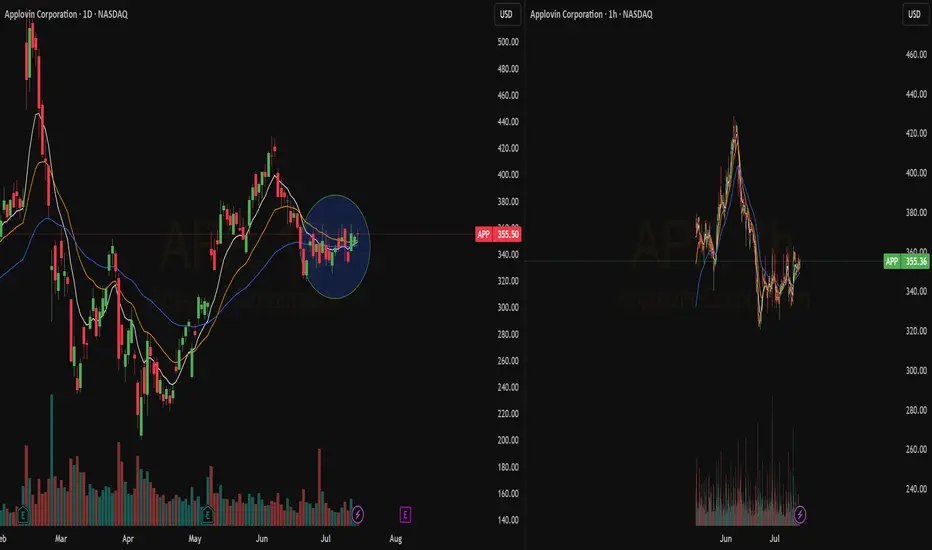
Quick View: $APPThe Daily Chart sees the price to hold the ema 50d while the ema 21d is getting closer and closer.
The action is not supported by volume, as happens in every classic pullback.
Ready to catch the action
JNJ watch $156.72-158.17: Double Golden Fib zone about to break?JNJ struggling against Double Goldens at $156.72-158.17
After many tests from underside, it looks ready to break.
Above this zone are only scattered clouds for some ways.

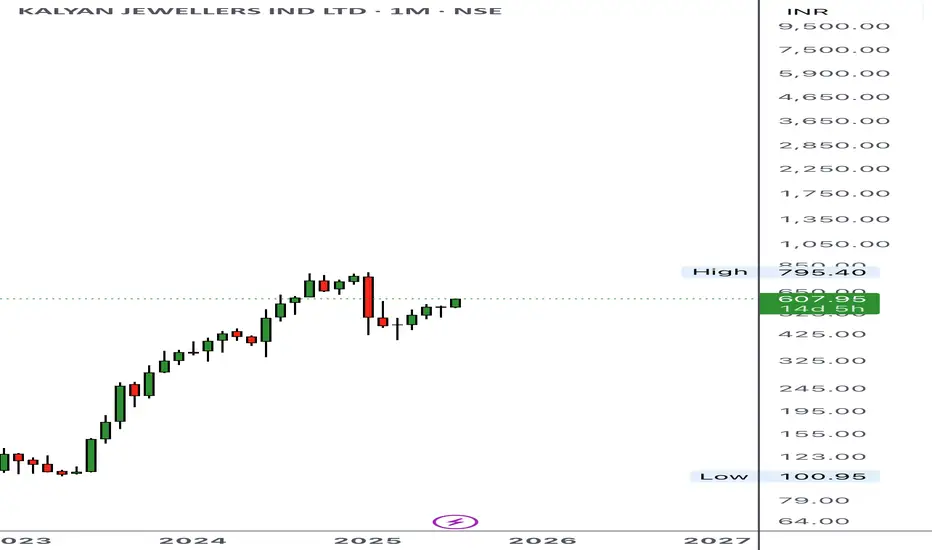
Kalyan jew💎 Kalyan Jewellers – Shining with Strength!
Strong structure building for positional momentum — glitter may just be gold here! ✨📈
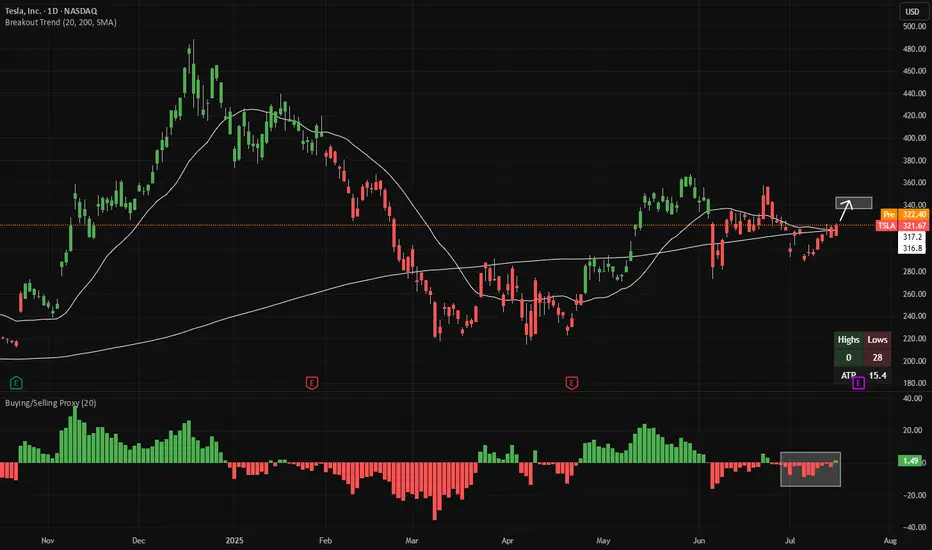
Long TSLA - buyers almost have controlThe buying/selling proxy (bottom panel) is showing signs of net-buying in TSLA. This makes 20-day highs (area indicated in the main chart) more likely to come next. That's around $349.
There is good risk/reward to buy TSLA here, with a stop-loss if the buying/selling proxy flips back to net-selling (red bars). If a 20-day high is made, the candles will change color from red to green.
Both indicators (Breakout Trend and Buying/Selling Proxy) are available for free on TradingView.
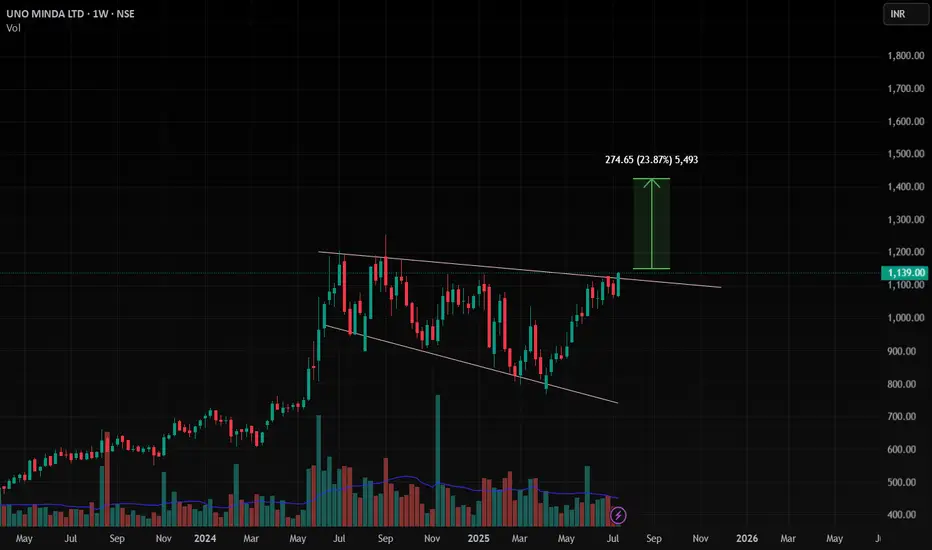
UNOMINDA , 1W , Bullish The pattern is channel , it is ready to Breakout , Enter after only clear confirmation in weekly strong close then enter , follow proper position sizing and risk management
follow for more swing Ideas like this
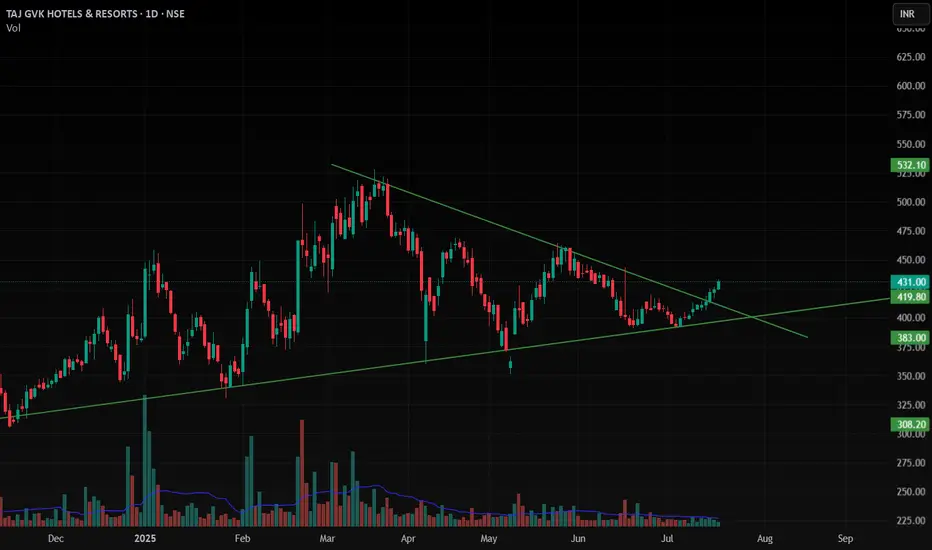
TAJGVK , 1D , Bullish as this stock given breakout from the Triangle Pattern with Good Volume , this stock is ready to Enter .
put SL below its swing low
follow more swing ideas like this .
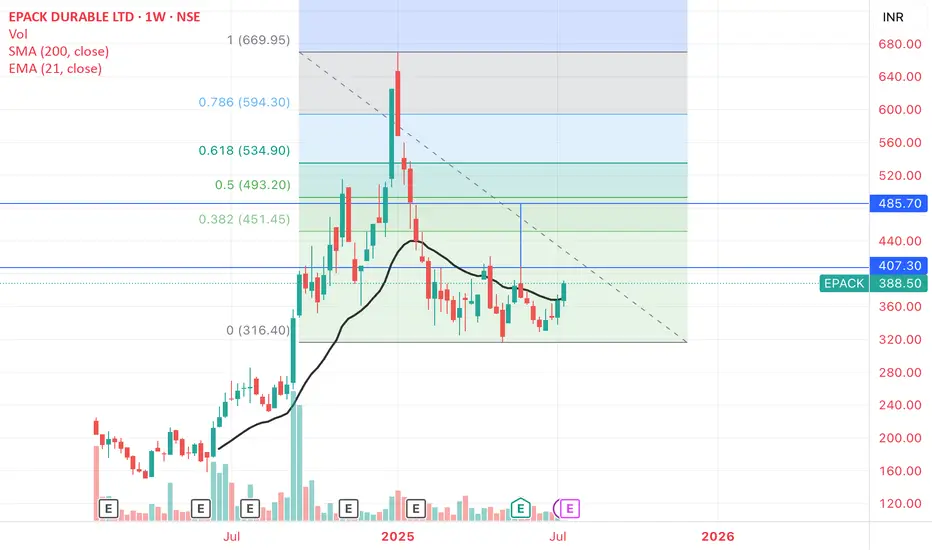
E-PACK_ Potential Double Bottom and TargetsE-PACK DURABLE: Potential Double Bottom with Resistance 407-410 zone.
Weekly close above it - Target 480-490 , that is also the 50% retrace Fib Level of the entire fall from the peak
Weekly close and support held at 407-410 matters
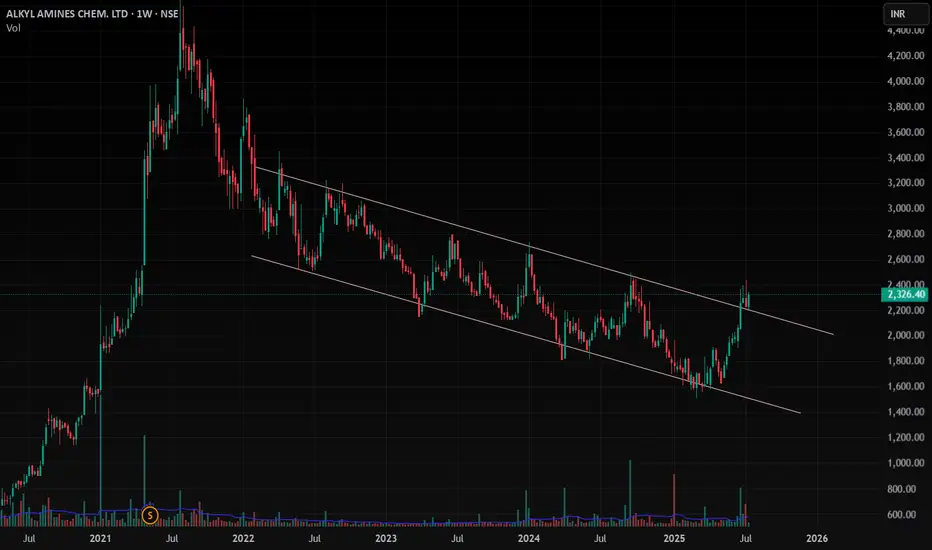
ALKYLAMINE , 1W , Bullishas this stock is given good breakout and now it is at Retest Point and You can enter with Good position Size with very minimal Risk
put the SL below the Swing Low . Take risk according to your position size
Follow for More Swing Ideas Like this
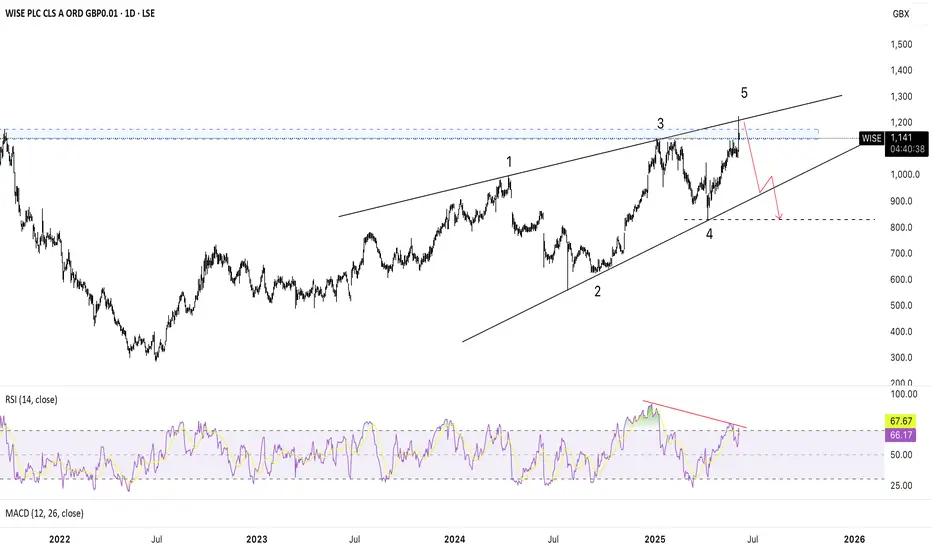
Short WISE as leading diagonal has been completedWISE can be shorted with the first target at the lower edge of the diagonal and then, at around 800 pence (start of wave 5), if move lower confirmed.
Clear RSI divergence shows trend reversal in the short-term at least (until touching lower band of the diagonal). So the lowest upside is around 14-16% here.
SL can be set to 1230 pence.
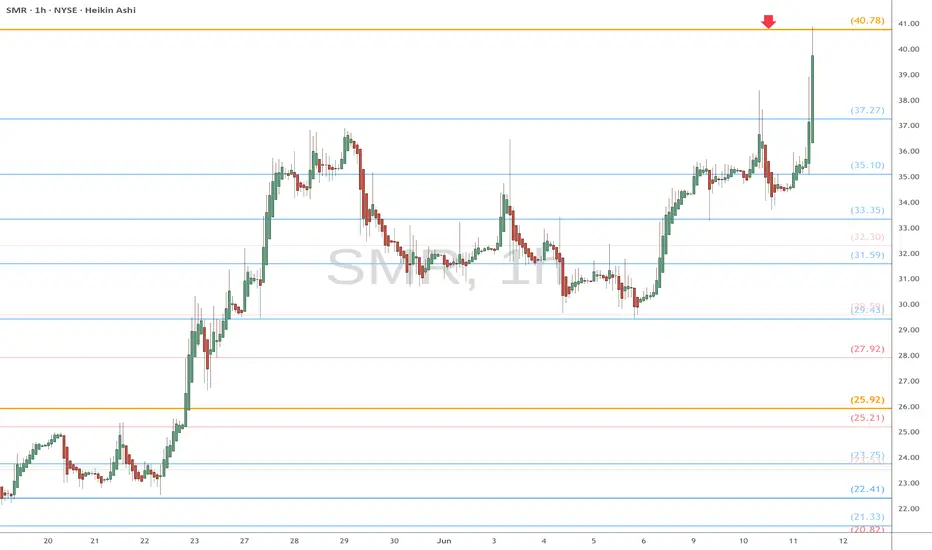
SMR heads up at $40.78: Golden Genesis fib may cause a DIPSMR got a strong spike with all nuclear stocks.
It has just hit a Golden Genesis fib at $40.78.
Look for a Dip-to-Fib or Break-n-Retest for longs.
.
See "Related Publications" for previous plots including this BOTTOM CALL:
===========================================
.
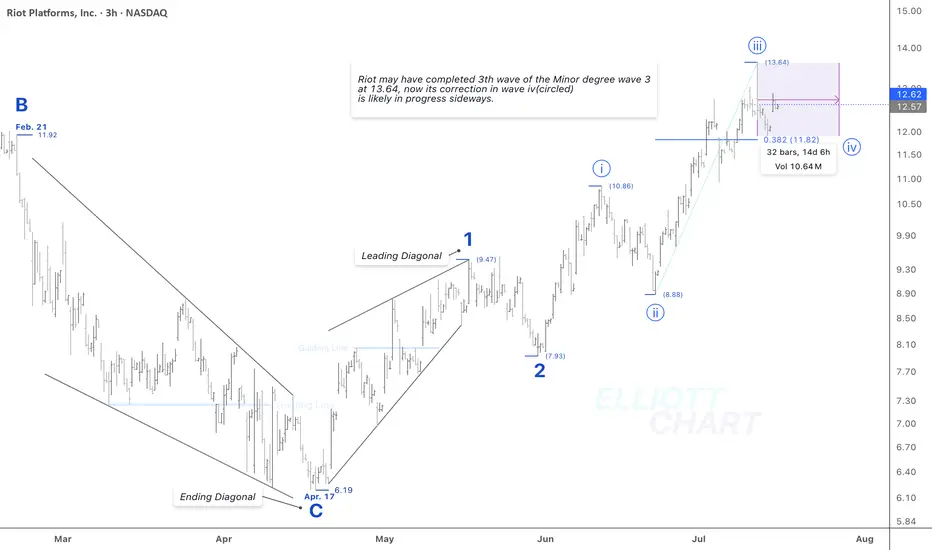
RIOT / 3hThere is no change in the NASDAQ:RIOT 's trend analysis.
Wave Analysis >> As illustrated in the 3h-frame above, NASDAQ:RIOT may have completed the 3rd wave of the ongoing Minor degree wave 3 at 13.64, its correction in wave iv (circled) is likely in progress sideways.
#CryptoStocks #RIOT #BTCMining #Bitcoin #BTC
NASDAQ:RIOT CRYPTOCAP:BTC MARKETSCOM:BITCOIN
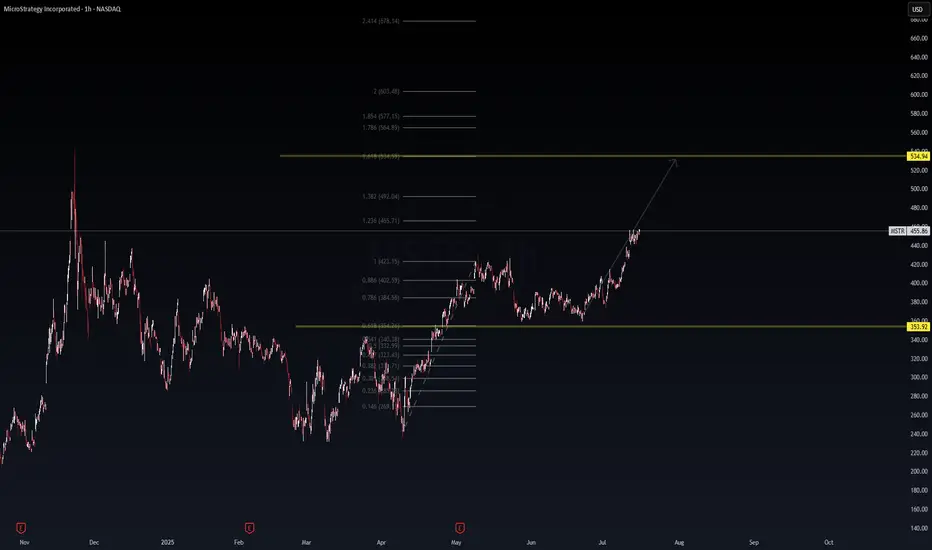
MSTR: Fibonacci Momentum Building Toward $534 🔺 MSTR: Fibonacci Momentum Building Toward $534 🚀
MicroStrategy (MSTR) continues its bullish ascent, following a clean Fibonacci extension pattern. After reclaiming key levels and holding above the 0.786–0.886 retracement zones, it now trades around $455 with strength.
📊 Technical Breakdown:
Breakout held above $423 (1.0 Fib)
1.236 Extension: $465.71 (short-term resistance)
1.618 Extension: $534.94 (main target)
Final leg: 2.0 Extension at $603 for full stretch
🟨 Support zone: $353.92
🟩 Trend: Higher highs and strong momentum
🧭 Bias: Bullish continuation unless price loses $402
💡 Macro Note: MSTR trades like a BTC-leveraged equity. Continued BTC strength could accelerate this move. Watch for potential catalysts like ETF flows, earnings, or Fed commentary.
📈 Thesis: As long as MSTR stays above $423, the bullish case toward $534 remains intact with high conviction.
🔔 Disclaimer: This analysis is for educational purposes only. Not financial advice. Always manage risk.
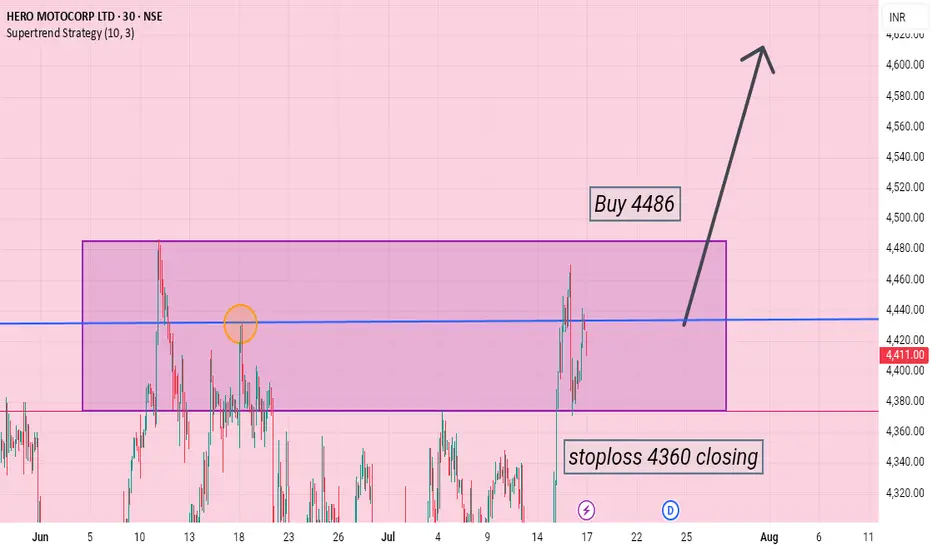
Target 5050 coming very sooneverything mention about in my chart
Current market price 4424
strong buy 4470 to 4480 above
I am not sebi register
is my own idea only
$ENVXGot strong support lower channel at 5.27
Forming higher lows in last 4 weeks
5.90 being ultra strong support since last three weeks (pre-earnings and post earnings).
Next support level is at 5.20.
If resistane at 7.1 is breached then technical targets would be 8.60, 9.80, 10.95 and 13.15
