PG Approaching Oversold Discount Zone Ahead of Q4 Earnings BTFD?📝 Procter & Gamble (NYSE: PG) is trading at $153.73 (-10.8% YTD), lagging the S&P 500’s +6.5% YTD gain. Despite recent weakness, a confluence of technical support, dividend resilience, and a looming catalyst could signal a tactical entry. Let’s break it down:
🔍 Fundamentals & Catalysts
Q4 Earnings Webcast (July 29):
P&G will webcast Q4 results at 8:30 AM ET, with focus on organic sales growth (guided at +2% FY25) and margin trajectory 14.
EPS Expectations: Q4 consensus at $1.43 (+2.1% YoY); FY25 core EPS guided at $6.72–6.82 (2–4% growth) 410.
Dividend Fortress:
Quarterly payout raised to $1.0568/share (ex-div: July 18), marking 69 consecutive years of increases and a 2.75% yield 612.
Payout ratio at 67% of earnings – sustainable for a consumer staple 6.
Cost Pressures & Mitigation:
Tariff Headwinds: $1B–$1.5B annual cost hit from U.S.-China tariffs 410.
Offsets: $2.4B dividend payouts + $1.4B buybacks in Q3; 280bps gross productivity savings 10.
🌍 Macro & Risk Factors
Consumer Softness: Q3 net sales fell -2% YoY; volume declines in Baby Care (-2%) and Fabric & Home Care (-1%) segments 10.
Pricing Power: Average +1% pricing in Q3 (led by Grooming/Health Care), though mix/elasticity risks persist 104.
Structural Shifts: Portfolio pruning (minor brand exits) and job cuts to offset tariff impacts 4.
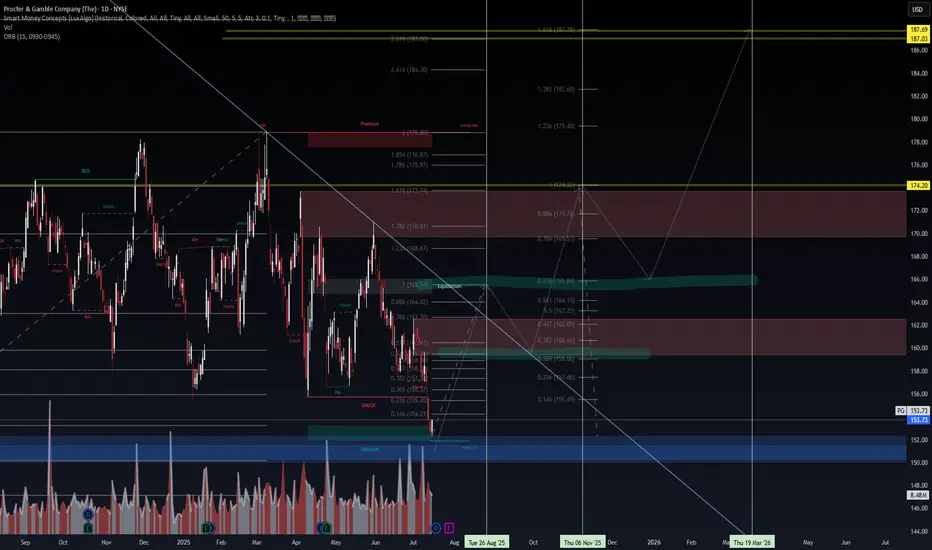
📉 Technical Setup: Oversold with Base-Building Potential
RSI 31.5 (Neutral but nearing oversold) 511.
Price vs. MAs: Below all key MAs (20-day: $159.17, 50-day: $161.59, 200-day: $165.56) – signaling bearish momentum but extreme discounts 5811.
Support Zone: $152–153 aligns with 52-week lows ($151.90) and the 2025 dividend-capture floor 212.
MACD -1.57: Suggests potential reversal if momentum shifts 5.
Technical Indicators Summary:
Indicator Value Signal
RSI (14) 31.45 Neutral
MACD (12,26) -1.57 Buy
Price vs. 200D SMA -7.1% Sell
Bollinger Bands (25) $157–161.94 Sell
🎯 Probabilistic Price Targets
Scenario Target Probability Rationale
Bounce to 20D MA $158–160 60% Mean reversion + dividend ex-date support
Reversion to 50D MA $162–164 45% Technical confluence + tariff resolution hopes
Rally to 200D MA + ATH $174 25% Bull case: Macro stabilization + guidance upgrade
📌 Trade Strategy
Entry: $152–154 (aligns with structural support) 28.
Stop Loss: $149.50 (1–2% below July 16 low of $152.27) 2.
Targets: Scale out at $160 → $164 → $174.
Catalysts: Q4 earnings (July 29) + clarity on tariff mitigation 14.
Position Size: Allocate 3–5% of portfolio; pair with long-volatility hedge.
⚠️ Key Risks
Guidance Miss: Sluggish volumes or tariff escalation could pressure FY26 EPS projections.
Technical Breakdown: Close below $151.90 invalidates support, inviting a slide to $145.
Macro Sensitivity: Consumer staples underperformance if inflation rebounds.
💎 Final Take
PG offers a rare combo: defensive yield (2.75%) + oversold technicals + imminent catalyst. While tariffs and consumer weakness justify caution, the $152–154 zone is a high-probability dip-buying opportunity. Earnings day vol could amplify moves – enter pre-event with tight stops.
#PG #ConsumerStaples #DividendKing #EarningsPlay #Tariffs
Disclaimer: This is not financial advice. Conduct your own due diligence.
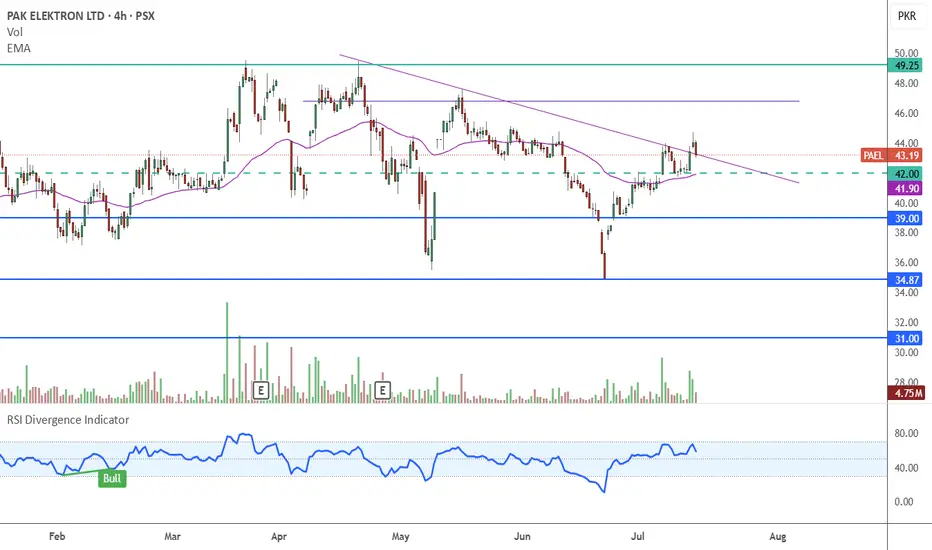
PAK ElECTRON LONG (PAEL)Technical:
Bullish breakout
Enter 43-42 PKR
Targets @ 46.80 & 49.25
Sentiment :
Positive Exports/Earnings Upgrades
Fundamentals :
Strong Growth/Attractive Valuations/ Manageable Debt
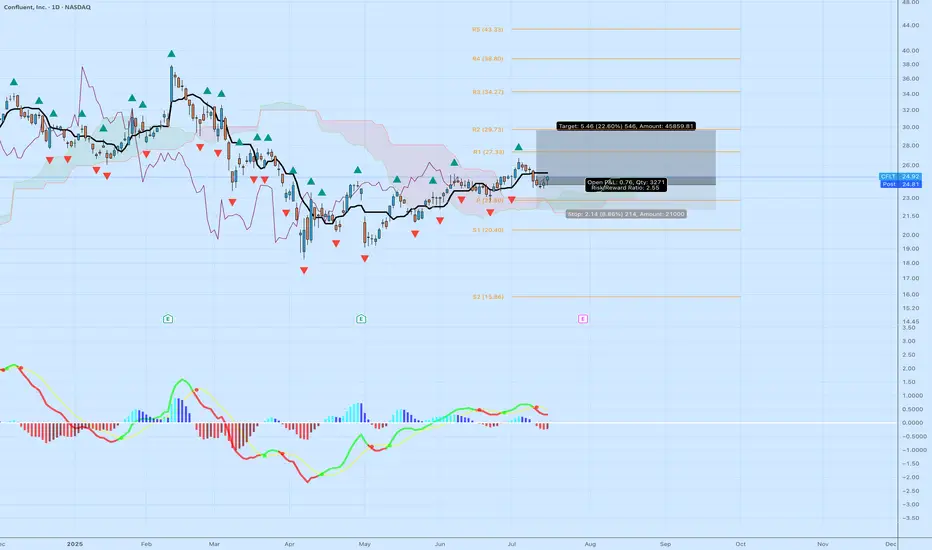
CFLT: Bullish Momentum Breakout Targeting $29.76 – Strong R/R Ticker: NASDAQ:CFLT (Confluent, Inc.)
Bias: Long
Timeframe: Daily (with momentum building from May lows)
Entry: Around $24.30 (near recent breakout above pivot at $22.80)
Stop Loss: $22.14 (below swing lows, ~8.86% risk)
Target: $29.76 (near R2 resistance, ~22.60% reward)
Risk/Reward Ratio: 2.35:1
Position Sizing Suggestion: Limit risk to 1-2% of capital (e.g., ~$21,000 total risk on 3,271 shares as shown)
Confluent (CFLT) is showing strong bullish momentum on the daily chart, breaking out from a multi-month consolidation base between $18–$23 since April 2025 lows. The price has formed higher highs and lows, supported by a bullish MACD crossover (green signal line above red, positive histogram bars), indicating accelerating upside potential. RSI is neutral around 54–60, leaving room to run without being overbought. Volume has ticked up on recent green candles, confirming buyer interest.
From a smart money perspective, institutional ownership stands at ~78%, with net buying in Q2 2025 (e.g., hedge funds adding ~7.1M shares). This aligns with Confluent's growth in real-time data streaming for AI and cloud applications, boosted by the July 2025 AWS Marketplace expansion for AI agents. Fundamentals support this: Q1 2025 beat expectations (EPS $0.08 vs. $0.07, revenue +26% YoY, Cloud segment +42%), though guidance was conservative amid macro IT spending slowdowns.
Pivot points guide the trade: Break above P ($22.80) targets R1 ($27.33) then R2 ($29.73, close to my $29.76). If momentum holds (e.g., breakout above $25.82), we could see extension to $31–$32 based on analyst averages (Moderate Buy consensus, target ~$31.50 from 30 analysts).
Risks to Watch: Upcoming Q2 earnings on July 30 could introduce volatility—consider trailing stops or exiting beforehand if holding through. Competition from hyperscalers (AWS, GCP) and broader tech sector dips (CFLT beta 1.71) could pressure if support fails. Not financial advice; always DYOR.
If you agree with this setup or have thoughts on CFLT, drop a comment below! Hit like if this helps, and follow for more ideas. Let's see how this plays out—I'll update as needed. 🚀
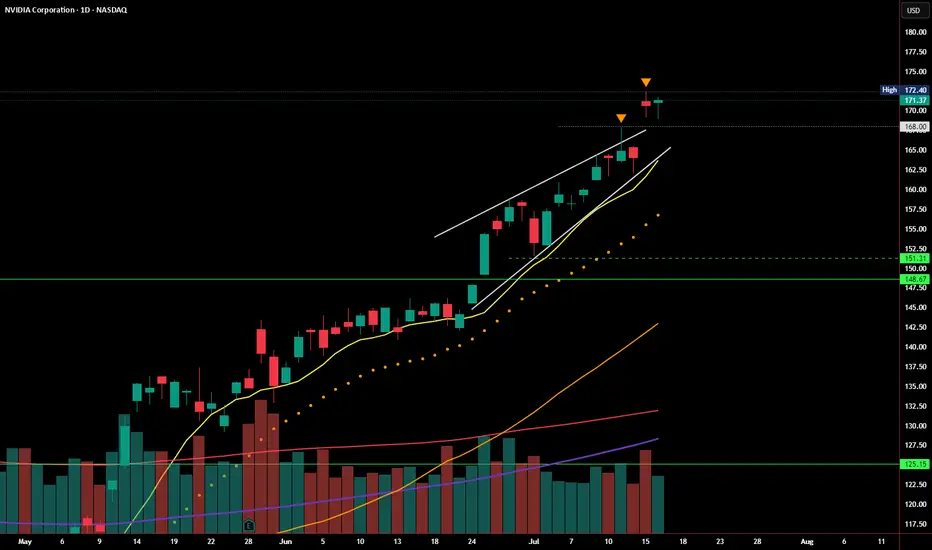
NVDA Follow-Up: Breakout Holding, But Still on Thin IceIn yesterday’s post, I highlighted the rising wedge pattern and noted that a breakout above $168 needed strong follow-through to confirm. Today, NVDA managed to hold above that level, closing at $171.37, just beneath the recent high of $172.40.
So far, the breakout attempt is intact — but not yet convincing.
🔹 Volume came in lighter, suggesting buyers aren’t fully committed
🔹 The candle printed a modest gain, but without expanding range or momentum
🔹 Price is still riding above the rising wedge, but hasn’t cleared resistance with authority
As long as NVDA stays above $168, bulls remain in control — but a daily close back below that level would re-enter the wedge and raise the risk of a false breakout, putting $151–148 back on the radar.
Until we see a strong breakout above $172.40 with volume, this remains a cautious breakout, not a confirmed one.
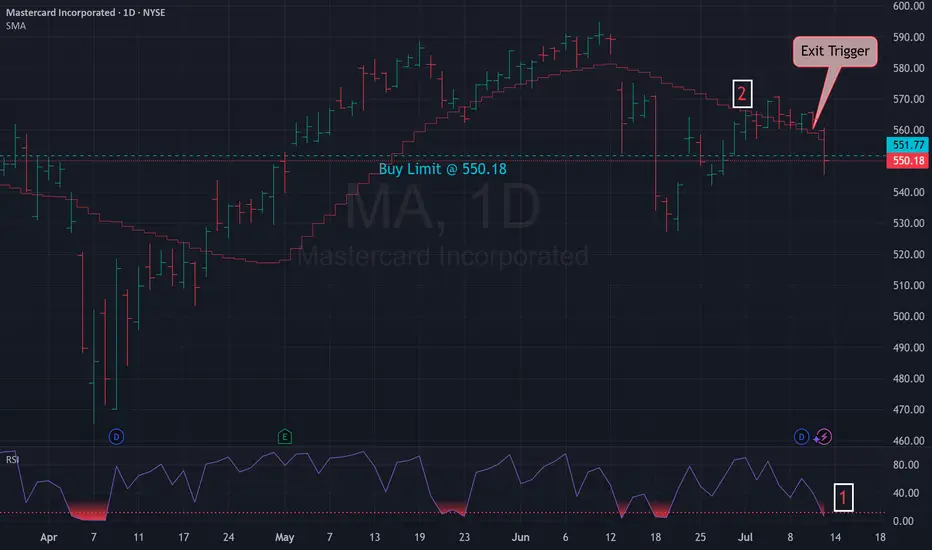
Mean Reversion Trade: MA1. RSI in oversold region
2. Price likely to rebound back the the mean
Trade Rules:
Entry Trigger - RSI has cross below oversold region, enter limit buy at close price
Exit Trigger - Close at market when close price cross above exit trigger (Red step line)
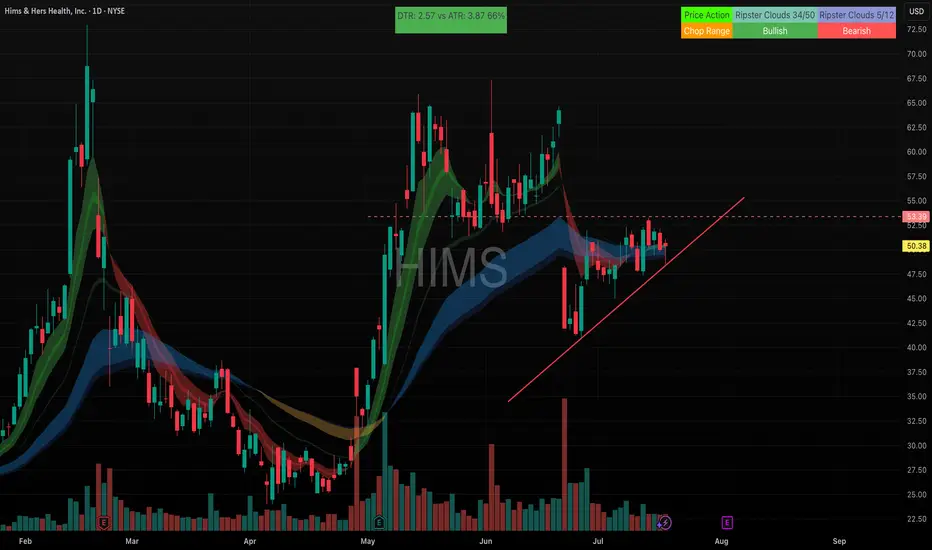
Him Daily chart NYSE:HIMS — daily chart shaping up nicely 👀
If it breaks above $53.39, next target could be $61.57 🚀
Clean setup with ascending support — let’s see if volume steps in!
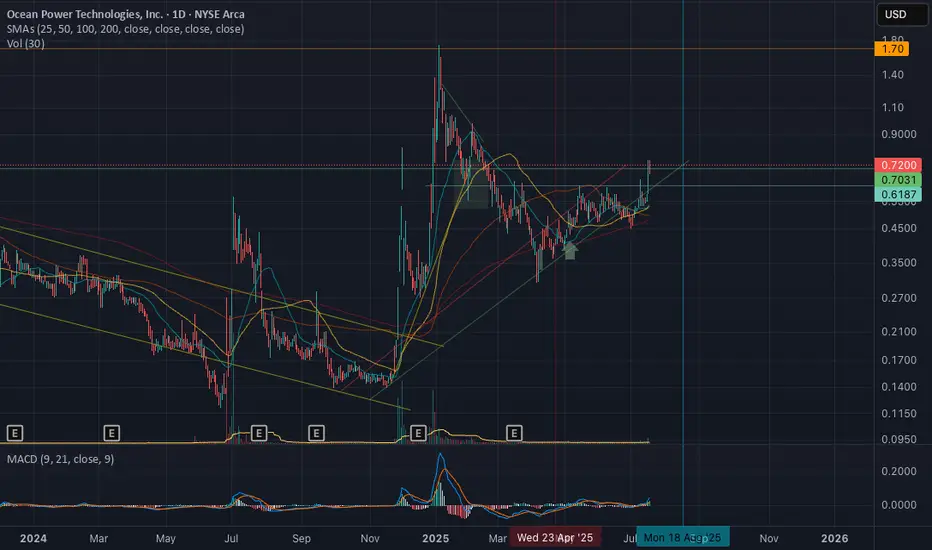
Nice Moves OPTTOPTT had a great accumulation the past 2 months and is picking up steam.
Entrance 50cent
Targets
1. 75cent
2. $1
3. Ride With 25% trailing stoploss
GodSpeed!
Time to Buy BAIDU -- July 18 BAIDU is getting ready for launch, buy on breaking the red trend line(crossing 95$). Robo taxi and the investments made in past few years will start yielding. Technically it had MACD crossover in longer timeframes.
should return 100% in next 1-2 years
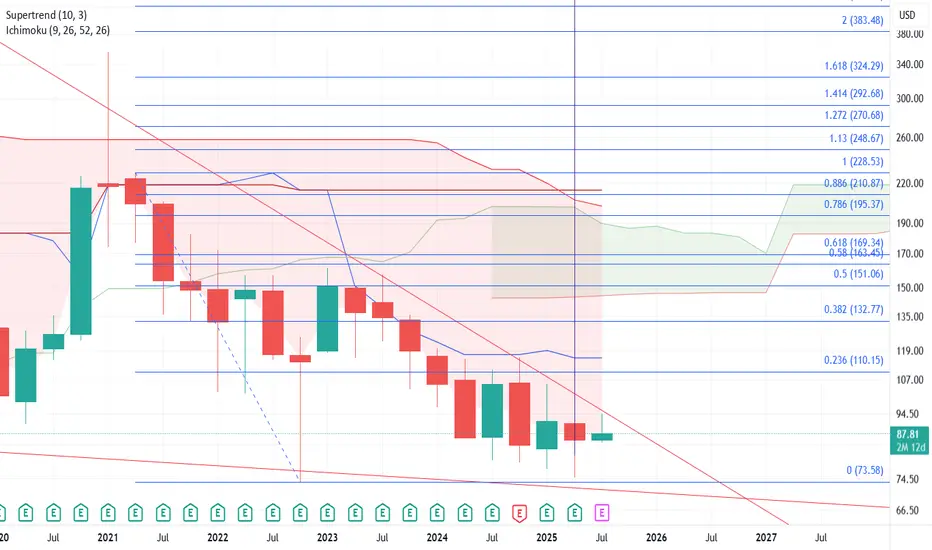
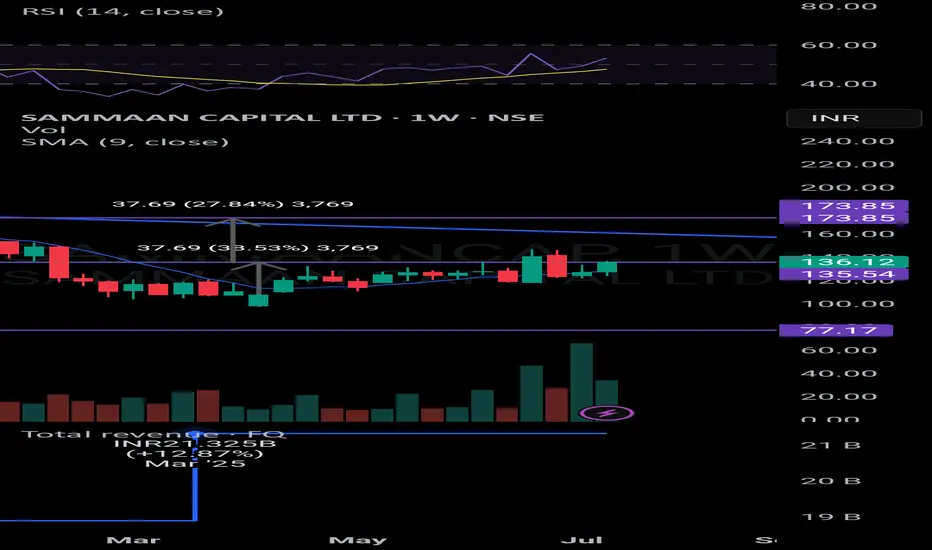
Sanmaan capital.....cup and handle pattern Cup and handle pattern
Target seems to be 170
30% upside chance
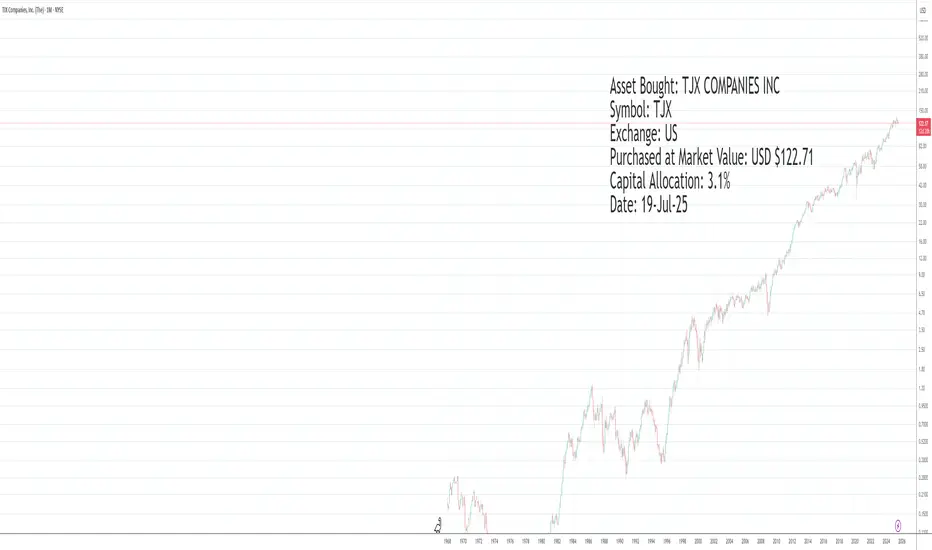
Asset Bought: TJX COMPANIES INCAsset Bought: TJX COMPANIES INC
Symbol: TJX
Exchange: US
Purchased at Market Value: USD $122.71
Capital Allocation: 3.1%
Date: 19-Jul-25
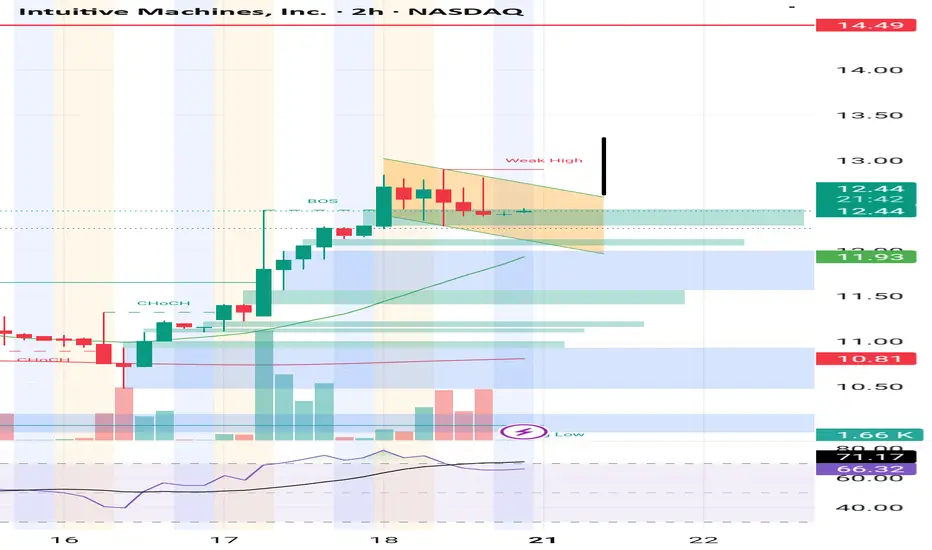
$LUNR bull flag forming?If this bull flag plays out expecting a push to $13.25+
Could also trigger a squeeze?
NASDAQ:LUNR
Bullish?Anyone have any thoughts? Im thinking 9/19 24C. Its looking primed and I just saw the short squeeze news, not that it could really mean anything, but what do yall think?
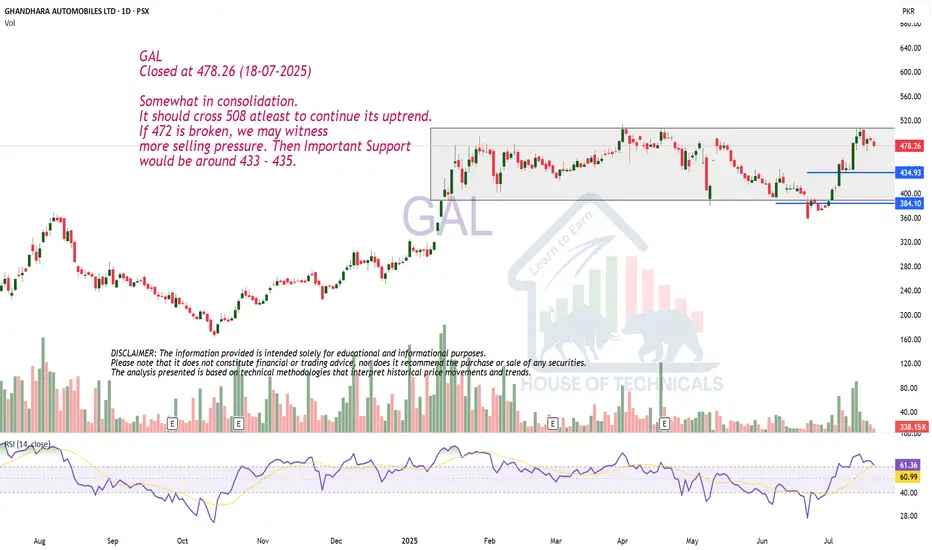
Somewhat in consolidation.GAL
Closed at 478.26 (18-07-2025)
Somewhat in consolidation.
It should cross 508 atleast to continue its uptrend.
If 472 is broken, we may witness
more selling pressure. Then Important Support
would be around 433 - 435.
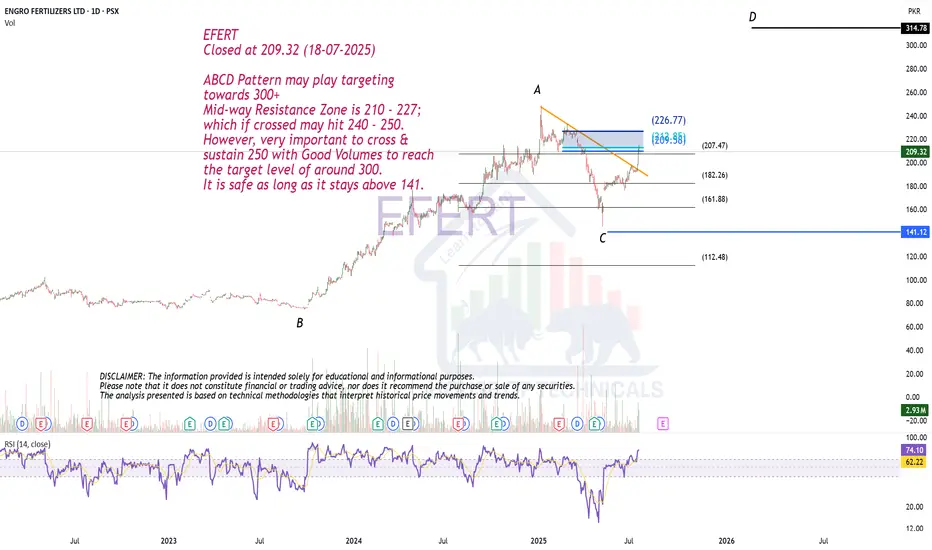
ABCD Pattern may play.EFERT
Closed at 209.32 (18-07-2025)
ABCD Pattern may play targeting
towards 300+
Mid-way Resistance Zone is 210 - 227;
which if crossed may hit 240 - 250.
However, very important to cross &
sustain 250 with Good Volumes to reach
the target level of around 300.
It is safe as long as it stays above 141.
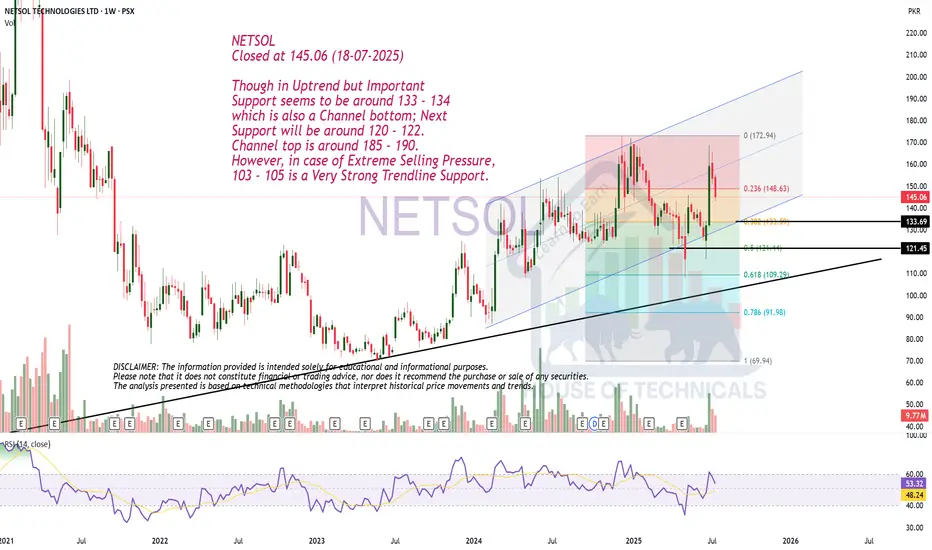
Though in Uptrend but..NETSOL
Closed at 145.06 (18-07-2025)
Though in Uptrend but Important
Support seems to be around 133 - 134
which is also a Channel bottom; Next
Support will be around 120 - 122.
Channel top is around 185 - 190.
However, in case of Extreme Selling Pressure,
103 - 105 is a Very Strong Trendline Support.
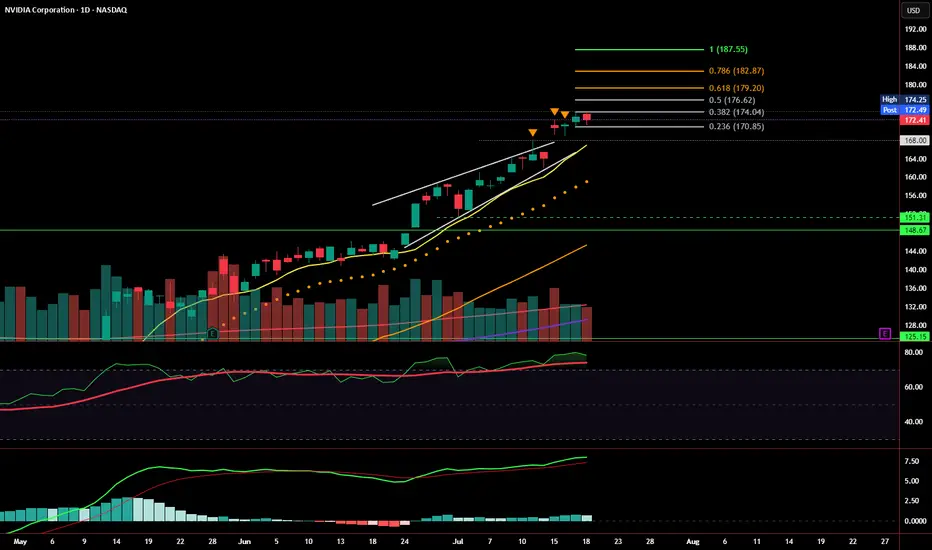
Weekly Close: Still Bullish, But Momentum Is SlowingNVDA closed the week at $172.41, just under short-term resistance and holding well above the prior rising wedge structure. Price action remains technically bullish, with a healthy consolidation forming just below the 0.382 Fibonacci retracement at $174.04.
That said, momentum is beginning to cool, and the next few sessions will be key.
📊 Current Read: Mildly Bullish
Price is holding above key support levels: 9 EMA, $170.85, and prior wedge resistance
No breakdowns — structure remains intact
However, volume is fading, and MACD is flattening, suggesting possible buyer fatigue
RSI remains elevated, not yet signaling reversal, but approaching caution territory
A confirmed breakout above $174.25 sets the stage for Fibonacci targets at:
🔸 $176.62, $179.20, $182.87, and $187.55
A close below $170.85 , and especially $168, would invalidate the current bullish structure and shift bias to bearish — targeting the $151.31–148.67 support zone.
Summary:
📈 Bias: Bullish - but cautious.
Price is consolidating near highs with no signs of breakdown yet. Continuation likely if bulls step in early next week.
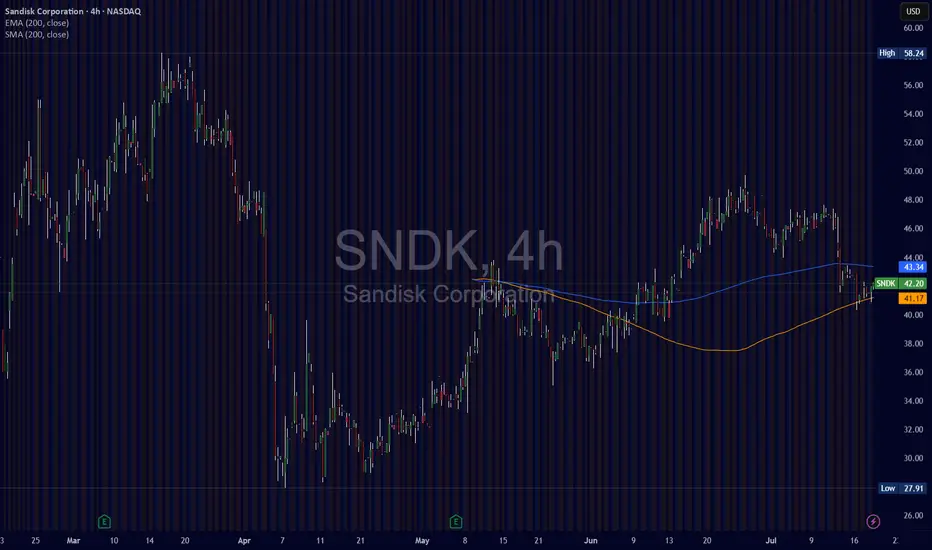
SanDiskIt seems that everyone typically looks toward the magnificent 7 for easy returns because they are so prevalent in our day to day lives. However, many people overlook companies like NASDAQ:SNDK mainly because their brand isn't shoved in our faces 24/7. But that's okay, SanDisk still controls about 1/4 of all small device storage market share, meaning they more than likely are here to stay for a while. Even though the stock is volatile, I have taken a substantial position in this company with the intent to sell for a nice profit.
My current position:
Buy 1 @ 45.39 ( July 7, 2025)
Buy 2 @ 42.15 ( July 14, 2025)
Currently the stock is trading above or near the 4 Hour 200 EMA and 200 SMA both of which are clearly moving at an uptrend. As for the industry itself, storage cards are always in demand especially for small consumer devices which has and absolutely gargantuan market. Most large institutions and rating agencies have this tock as a buy with some targets raising as high as $80 per share. Although that is optimistic this trade is aiming for a timeframe of 3 to 5 months, which could work out with that price target.
Here's the goal, sell 90% to 100% of the entire position with a price target of $62. It's just that simple.
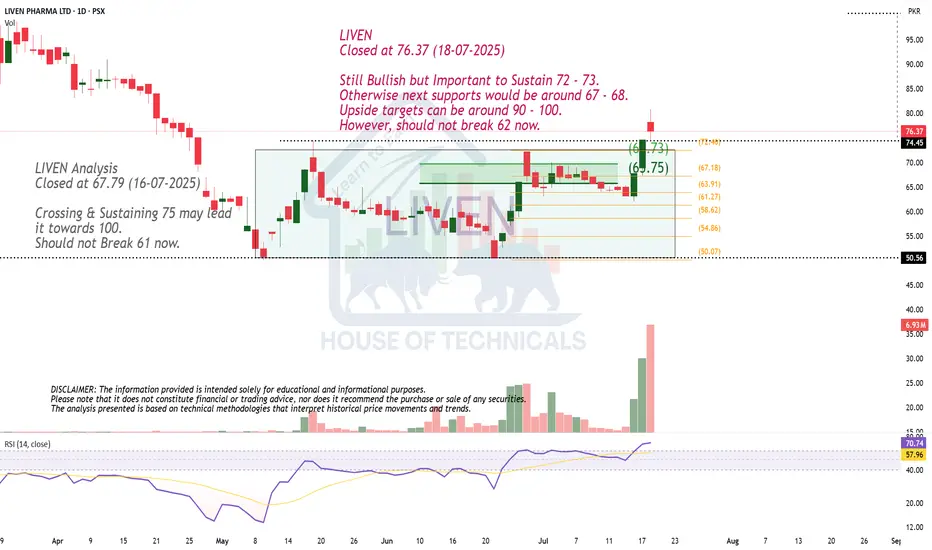
Still Bullish but ..LIVEN
Closed at 76.37 (18-07-2025)
Still Bullish but Important to Sustain 72 - 73.
Otherwise next supports would be around 67 - 68.
Upside targets can be around 90 - 100.
However, should not break 62 now.
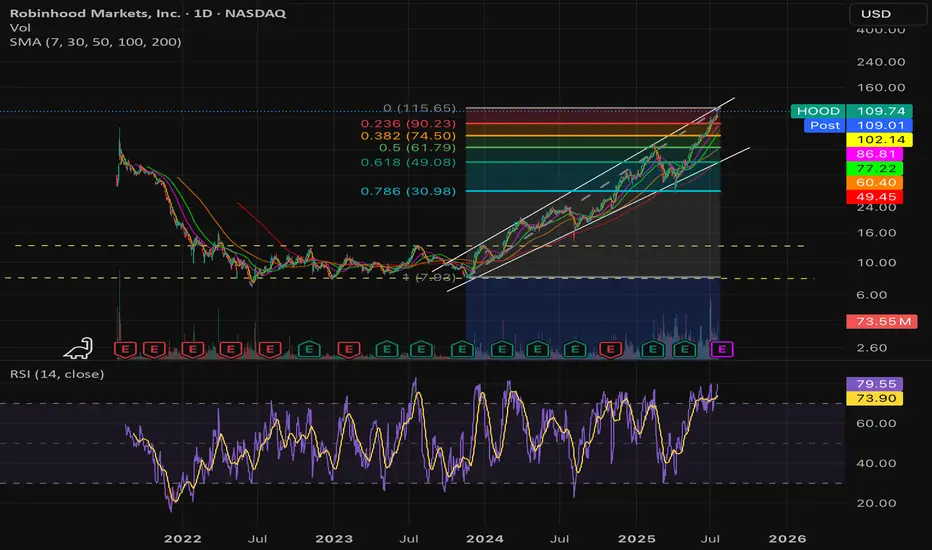
Party Over? Time to get back to senses!- NASDAQ:HOOD valuation is way stretched and it should correct to a reasonable valuation.
- This needs correction. Let's see how it folds out in next 6-12 months
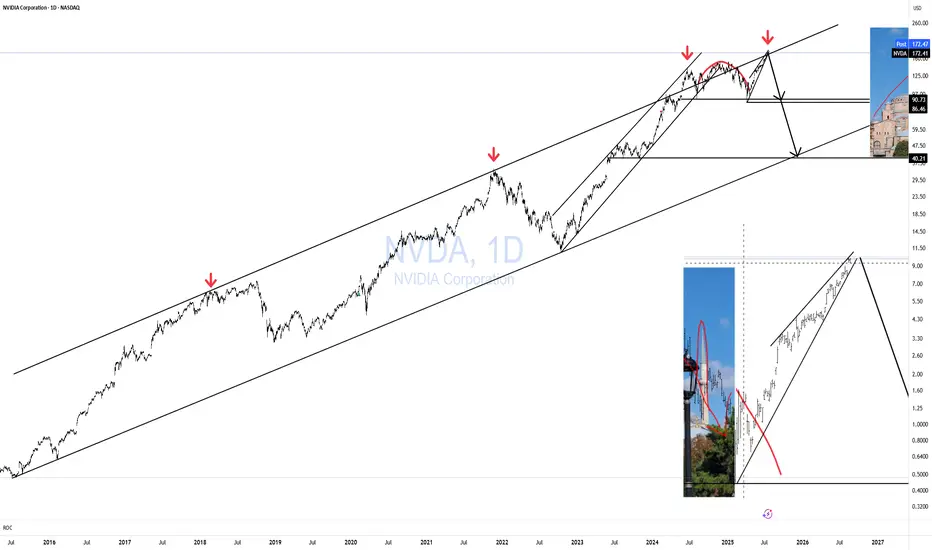
NVDA HAGIA SOPHIA!The Hagia Sophia pattern has now fully formed; it just needs the crack! and the Hook!
No matter what your vague hunches and feelings are about AI, the charts will always win.
You can't "buy the dip" unless you know when to "Sell the Rip"!
If you can't see this resistance area, I don't know what to tell you.
Everyone is bullish at the top of a bubbliotious market without exception!
Click boost, Like, Subscribe! Let's get to 5,000 followers. ))
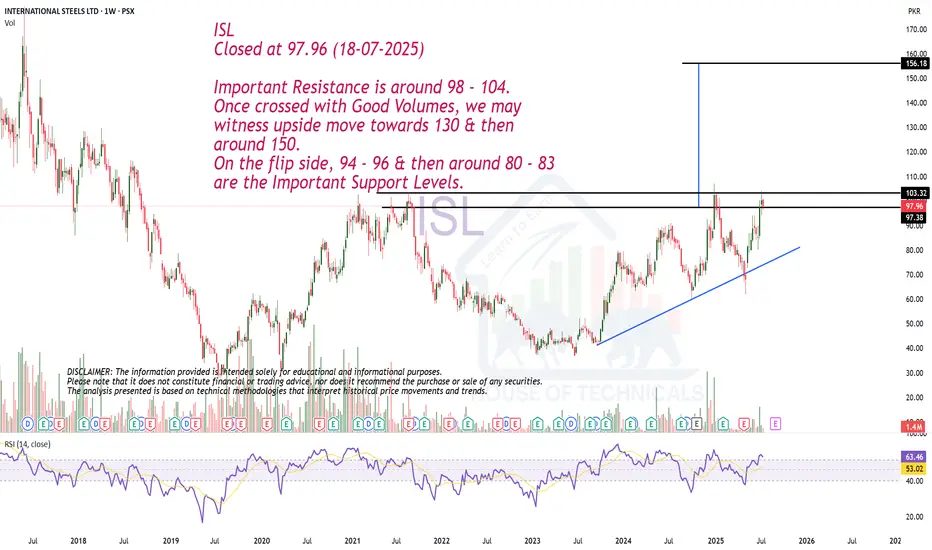
Important Resistance !ISL
Closed at 97.96 (18-07-2025)
Important Resistance is around 98 - 104.
Once crossed with Good Volumes, we may
witness upside move towards 130 & then
around 150.
On the flip side, 94 - 96 & then around 80 - 83
are the Important Support Levels.
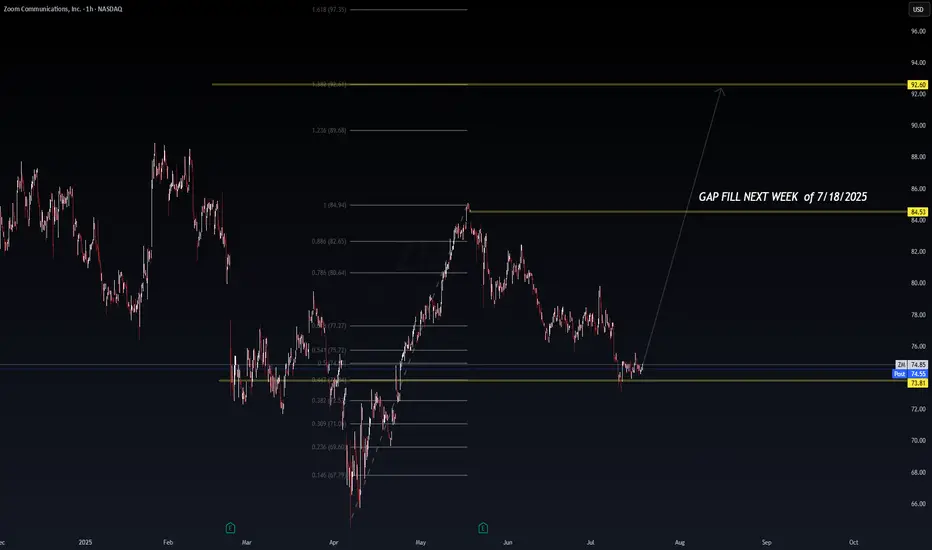
I am starting to think TradingView is Haunted. Anyways... ZM🎯 BOATS:ZM Gap Fill Setup – Targeting $84.53 by Week of 7/22
Zoom (ZM) may be setting up for a bullish gap-fill retracement off strong confluence support near $73.81. After a full fib retrace to the 0.5–0.618 zone, the current candle structure shows potential for a reversal toward the unfilled gap at $84.53.
🧠 VolanX Thesis:
✅ 0.5 Fib from March–May rally holding firm
✅ Gap from early June remains unfilled
✅ Bullish reversal candle forming at support
⚠️ Volume drying up on downside = potential exhaustion
🎯 Fib Levels to Watch:
🔹 0.618 = $77.27 (resistance → reclaim zone)
🔹 Gap Fill = $84.53
🔹 1.236 / 1.618 = $89.68 / $92.60 (momentum extension zones)
📈 Trade Idea (Illustrative):
plaintext
Copy
Edit
Entry: $74.50
Stop: $71.90
Target 1: $84.53 (gap fill)
Target 2: $89.60 (Fibonacci extension)
Gap fills often occur within 3–7 trading days when supported by fib reversal structure + buyer absorption.
Not Fin Advice! TY
📌 #ZM #Zoom #VolanXProtocol #GapFill #SmartMoneyConcepts #FibRetracement #DailySetup #WaverVanir #BreakoutTrading #TradingView
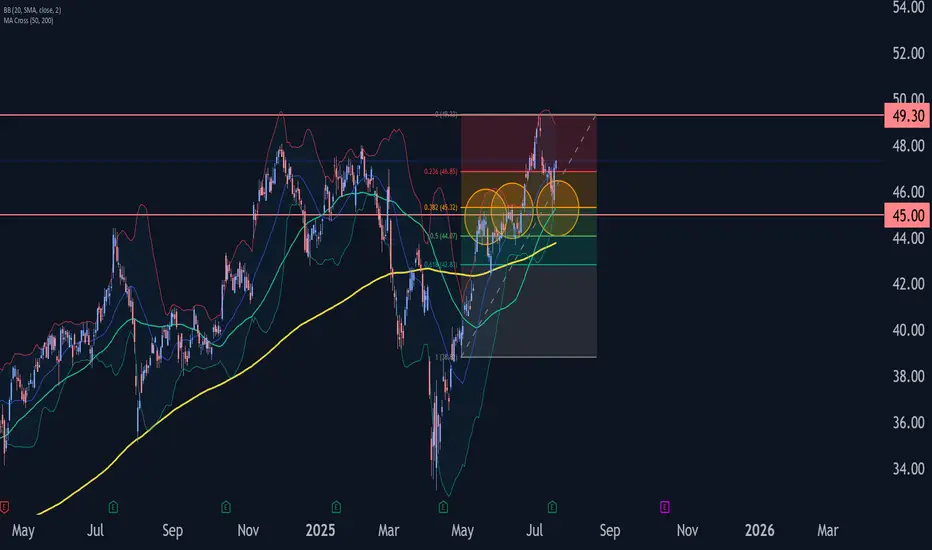
Bank of America Wave Analysis – 18 July 2025- Bank of America reversed from support area
- Likely to rise to resistance level 40550.00
Bank of America recently reversed up with the daily Morning Star from the support area located between the support level 45.00 (former resistance from May and June) and the lower daily Bollinger Band.
This support area was further strengthened by the 38.2% Fibonacci correction of the earlier upward impulse from April.
Given the clear daily uptrend, Bank of America can be expected to rise to the next resistance level 49.23 (top of the previous impulse wave 1).