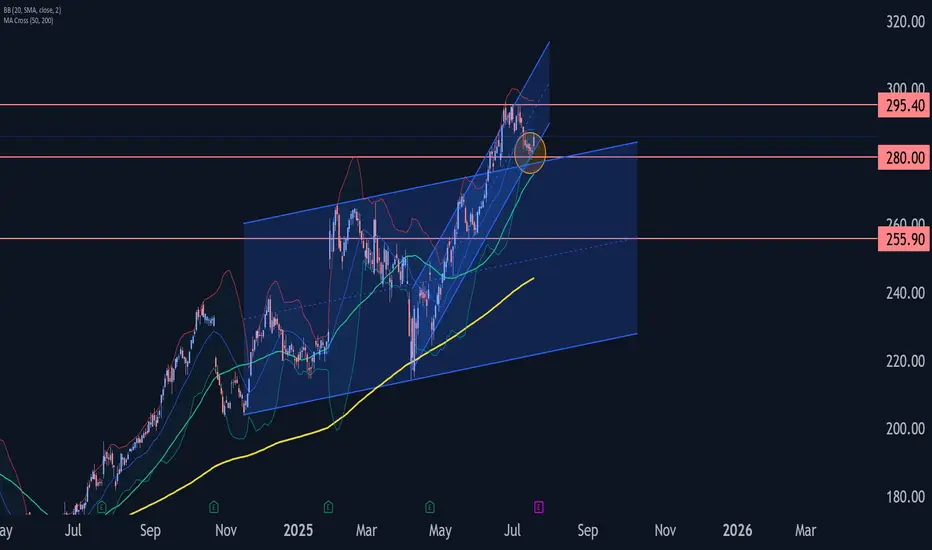
IBM Wave Analysis – 18 July 2025
- IBM reversed from support zone
- Likely to rise to resistance 295.40
IBM recently reversed up from the support zone between the support level 280.00, upper trendline of the recently broken weekly up channel from 2024 and the support trendline of the more recent up channel from April.
This support zone was further strengthened by the lower daily Bollinger Band and by the 38.2% Fibonacci correction of the sharp upward impulse from May.
Given the clear daily uptrend and the oversold daily Stochastic, IBM can be expected to rise further to the next resistance 295.40 (which stopped the previous waves 3 and (b)).
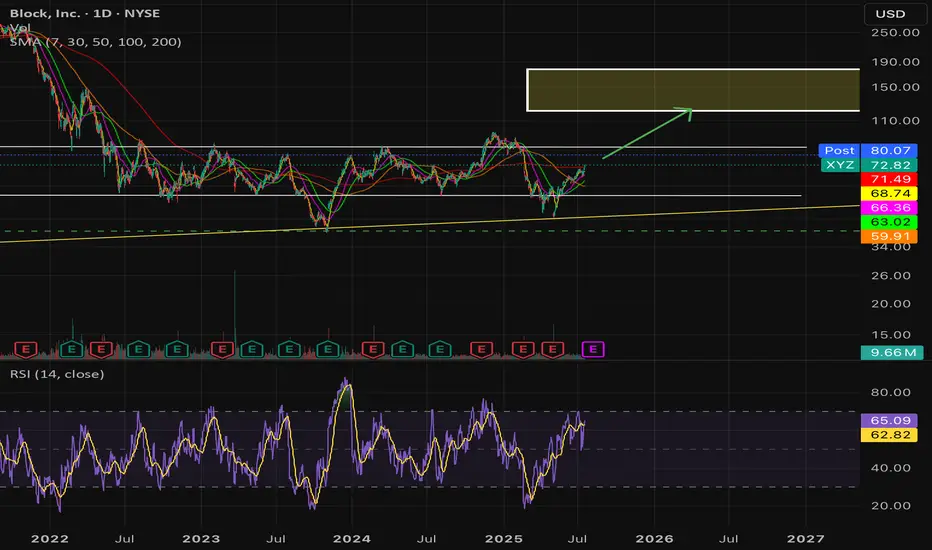
Overweight $XYZ ; Raising Price Target to $140+- BOATS:XYZ has been included to S&P 500 . It's a big news for BOATS:XYZ , this was one of the undervalued stock, treated like a dog but this company is always innovating and has strong talented employees.
- On top of that now BOATS:XYZ will get passive funds which is massive and bullish for the company.
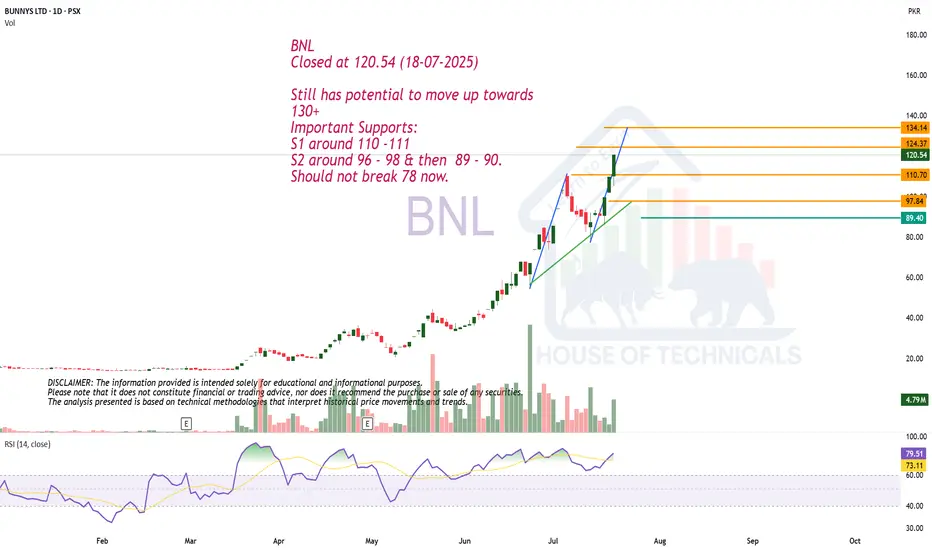
Play On LevelsBNL
Closed at 120.54 (18-07-2025)
Still has potential to move up towards
130+
Important Supports:
S1 around 110 -111
S2 around 96 - 98 & then 89 - 90.
Should not break 78 now.
HISTORICAL DATAWhen researching institutional holdings like BlackRock's purchases of a specific stock, it's important to look for Form 13F filings with the Securities and Exchange Commission (SEC). These filings are required from institutional investment managers with over $100 million in assets under management and disclose their equity holdings.
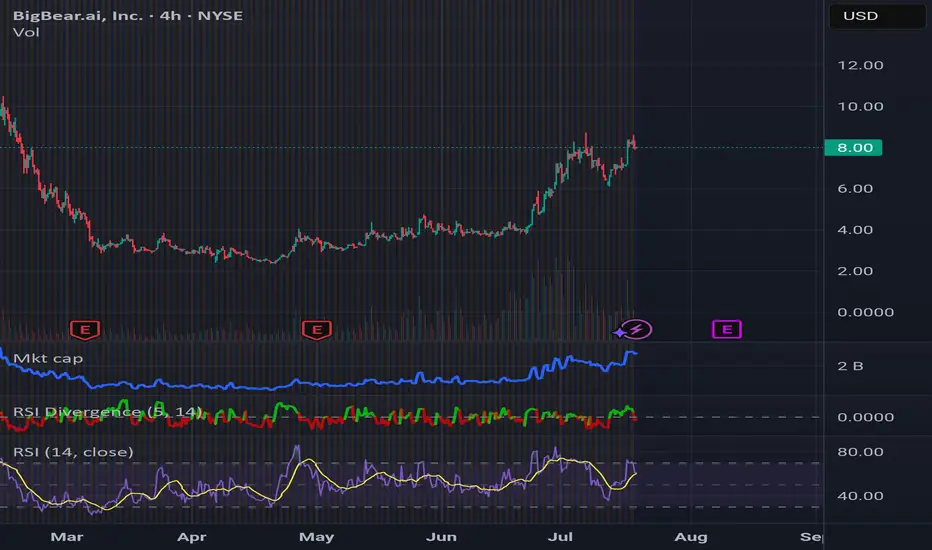
Based on recent SEC filings and financial data aggregators (like Fintel and Nasdaq, which pull from these filings), BlackRock, Inc. has indeed reported holdings in BigBear.ai Holdings, Inc. (BBAI).
Here's what the data suggests as of recent disclosures (typically reflecting holdings as of the end of the prior quarter):
* BlackRock, Inc. as a Shareholder: BlackRock is listed as one of the significant institutional owners of BBAI stock.
* Most Recent Filings:
* One report (from Fintel, based on a 13G filing as of July 17, 2025) shows BlackRock, Inc. holding 19,932,749 shares of BBAI.
* Another report (from Nasdaq, based on a 13F filing as of March 31, 2025) shows BlackRock, Inc. holding 8,023,992 shares and indicates a decrease of 464,763 shares (-5.475%) from their previous filing.
* A Nasdaq article (July 17, 2025) states that BLACKROCK, INC. added 11,605,372 shares (+88.3%) to their portfolio in Q1 2025, for an estimated value of $344,563,494. This suggests a significant increase in their position during that quarter.
Discrepancies and Interpretation:
It's common to see slightly different numbers reported across various financial data sources or even within the same source, depending on the type of filing (e.g., 13F, 13D, 13G), the date of the filing, and how the data aggregator interprets or updates the information.
* 13F filings generally show equity holdings at the end of a quarter (e.g., March 31, June 30, etc.).
* 13G filings are filed by passive investors who own more than 5% but less than 20% of a company's stock.
* The large increase reported for Q1 2025 indicates a significant move by BlackRock to build up its position in BBAI during that period.
In summary:
Yes, BlackRock holds shares of BBAI (BigBear.ai Holdings, Inc.). While the exact number of shares can vary slightly depending on the specific filing date and reporting method, BlackRock is a notable institutional investor in the company. Their recent activity suggests a substantial increase in their BBAI holdings during Q1 2025.
For the most precise and up-to-date information, you would typically refer directly to BlackRock's most recent 13F or 13G filings on the SEC's EDGAR database or use a financial data terminal that aggregates this information.
Retested Wedge Bullish Breakout = New Highs?
NASDAQ:TSLA
NASDAQ:TSLL
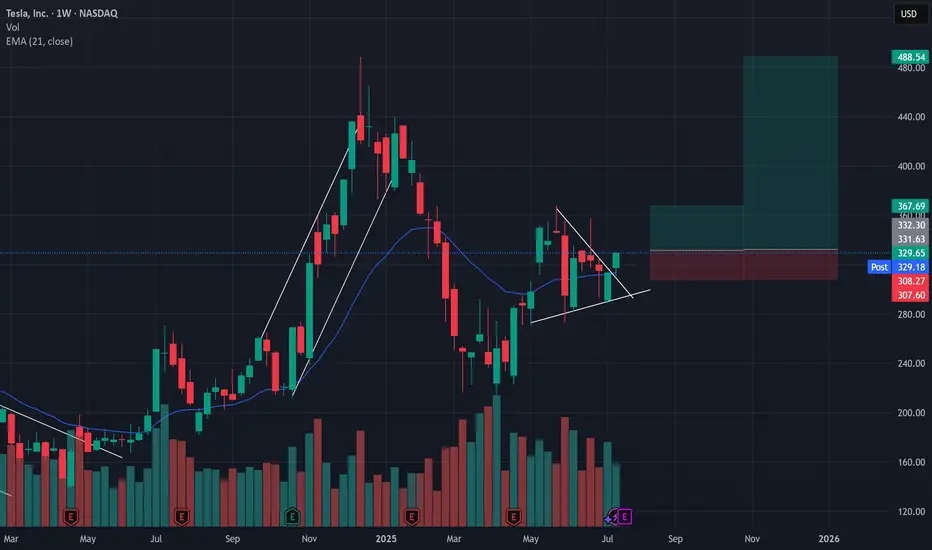
Tesla has currently showcased two very bullish setups with one already taking place.
Over the past 2 month we've seen TSLA swing dramatically from a high of $368 to a low of $278 while producing lower highs and higher lows AKA a wedge formation.
Wedge formations are a low probability set up and typically produce a 50/50 breakout, however there are a couple of bullish signals on the weekly chart that have kept me in my TSLL position expecting a retest of either the $368 high and/or $490.
Bullish insights -
1 - After a strong push above the 21d EMA, TSLA had a 2 legged pull back with last week being a short failure and closing above the 21d EMA
2 - this week's candle retested the breakout trendline and closed in a very bullish candle.
3 - Tesla's $488 high was an overshoot which produced a strong breakout to the low end, however there was no new high formed meaning there is a high probability chance that we will revisit ~$500.
Trade set up Idea:
If next week's candle forms higher than this weeks bullish candle, target is $368, Stop loss is set at $306 for a 1:1.5 Risk vs reward.
Or
If next week's candle forms higher than this weeks bullish candle, target is $348, Stop loss is set at $306 for a 1:6.5 Risk vs reward.
I'm holding for the second one ;)
Current position - 7400 shares of TSLL
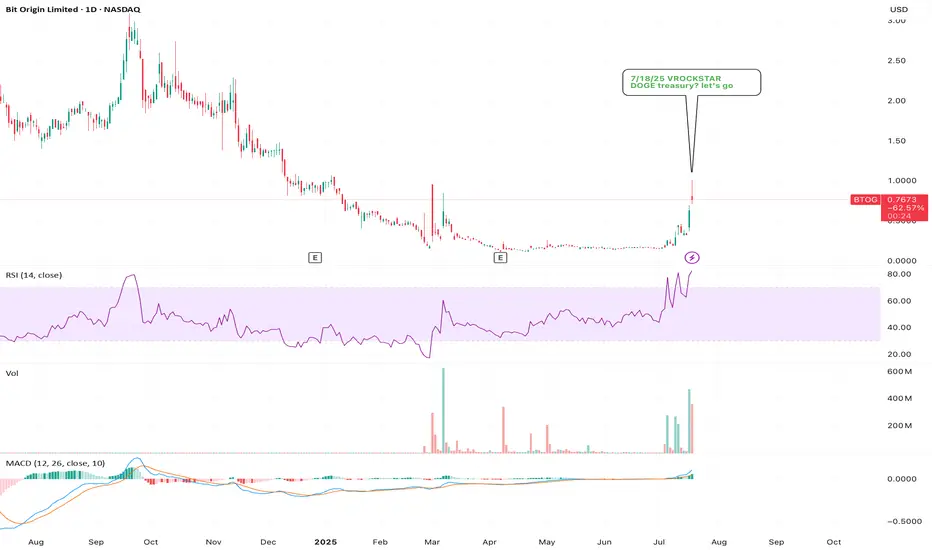
7/18/25 - $btog - DOGE treasury? let's go7/18/25 :: VROCKSTAR :: NASDAQ:BTOG
DOGE treasury? let's go
- doge is the better meme
- POW
- still small
- this ticker trades "cheap" vs. what they need to raise
- no way otherwise to buy doge in this way
- i'll add to this next week if down
V
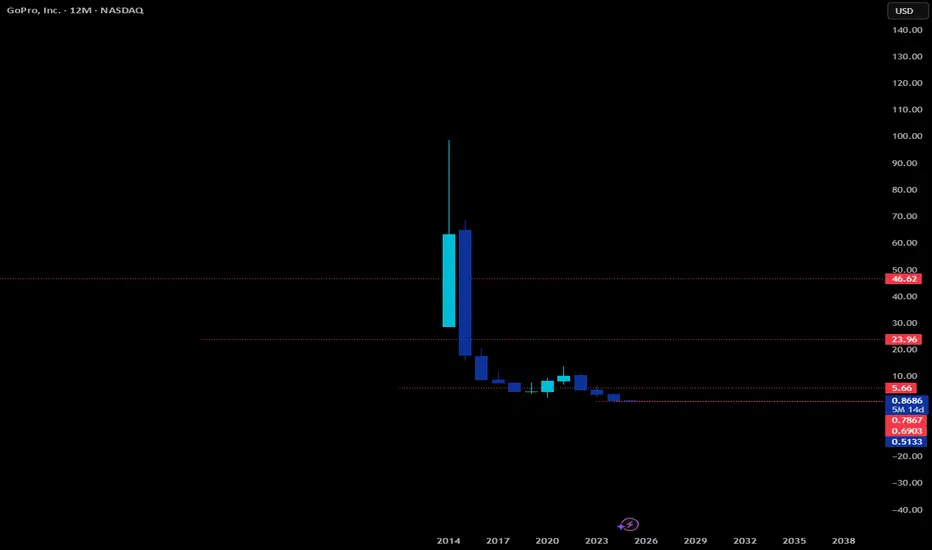
GPRO is the next GMEhuge pump incoming with major targets. GG.
sadf;asldkfa;sldkfjas;ldkfj;asldkfas;ldkfj;asldkjfa;slkdfj
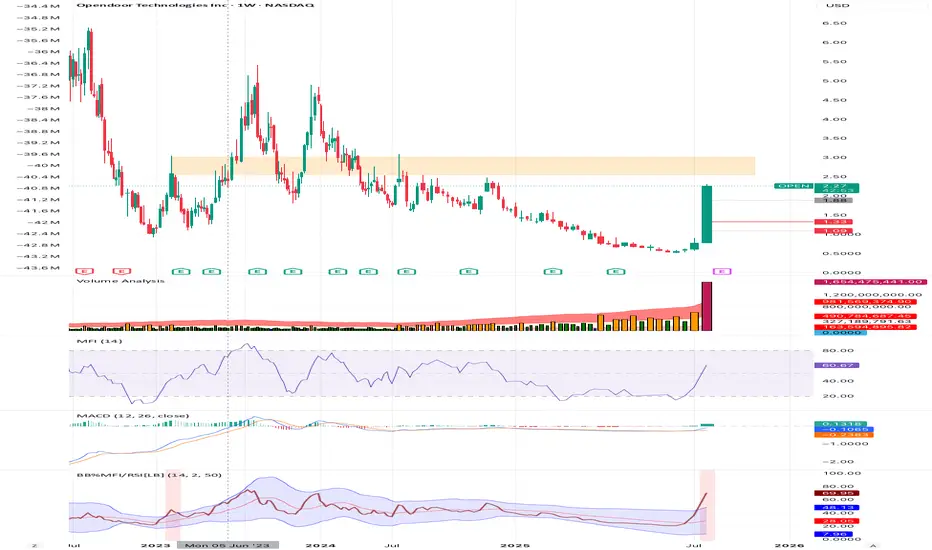
$OPEN Approaching Significant Resistance Range TestI believe the $2.5-$3 area may show resistance, as shown by the highlighted box covering the 2 large weekly resistance wicks in Jan 23 and Jul 24. We are moving swiftly and easily toward that range but that area may be significant and present the first real test. Past that range should be smoother sailing to $5.
I am not a financial advisor and this is not financial advice. I have been wrong before and will be wrong again; I trade within this reality and control my risk. I have a position in this stock and like it.
AMZN – Wedge Complete, Decision Imminent📦 AMZN – Wedge Complete, Decision Imminent
Price action has carved out a clean rising wedge into a known inflection zone. The top of this formation aligns with a macro breakdown level from Q1—likely to attract both breakout chasers and smart sellers.
📍 Key Levels:
Bull Break Target: $242.52
Bear Breakdown Target: $216.20
Decision Point: ~$228
This is a textbook volatility pocket. WaverVanir's DSS signals suggest we're nearing exhaustion. Watch for confirmation before positioning.
⚙️ VolanX Protocol – Predictive AI meets Market Structure.
#AMZN #WaverVanir #VolanX #SmartMoney #TradingView #NASDAQ #WedgePattern

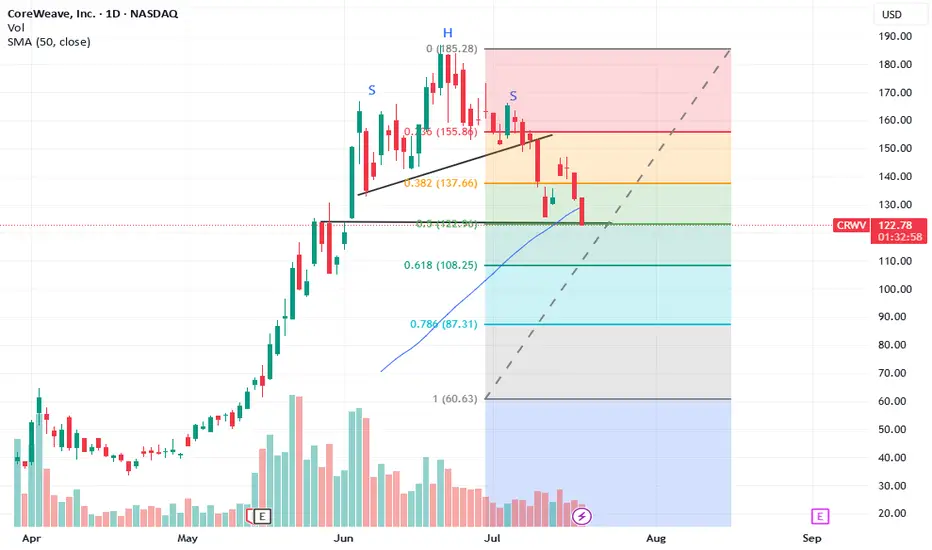
Coreweave retesting supportAfter a recent pop off the support line, it looks like the stock will retest these levels. Also, note the clear H&S pattern over the last several months. I'm expecting a breakdown below support in the next week or two.
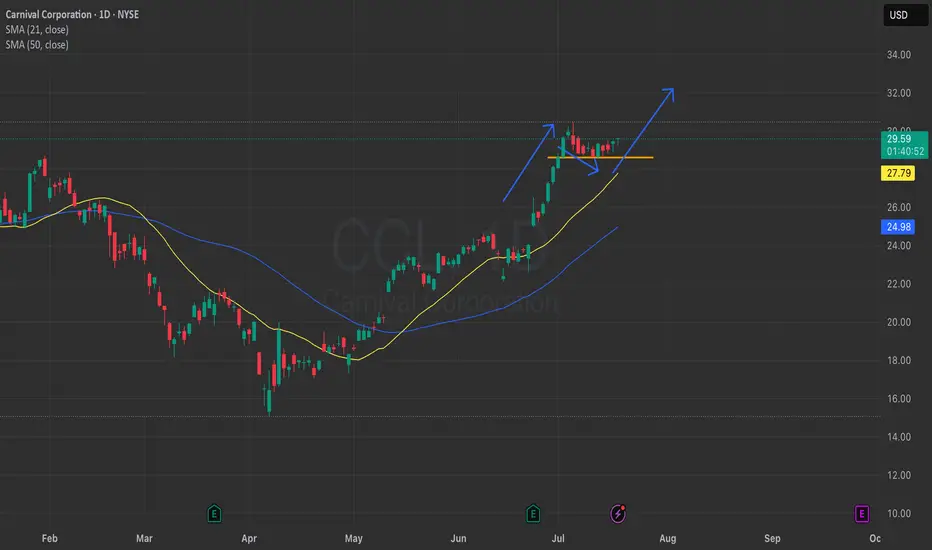
CCL Bull Flag BreakoutNYSE:CCL looks like it is starting to break out of a Bull Flag. Everyone has been focusing on NYSE:RCL , yet CCL has alot more upside potential.
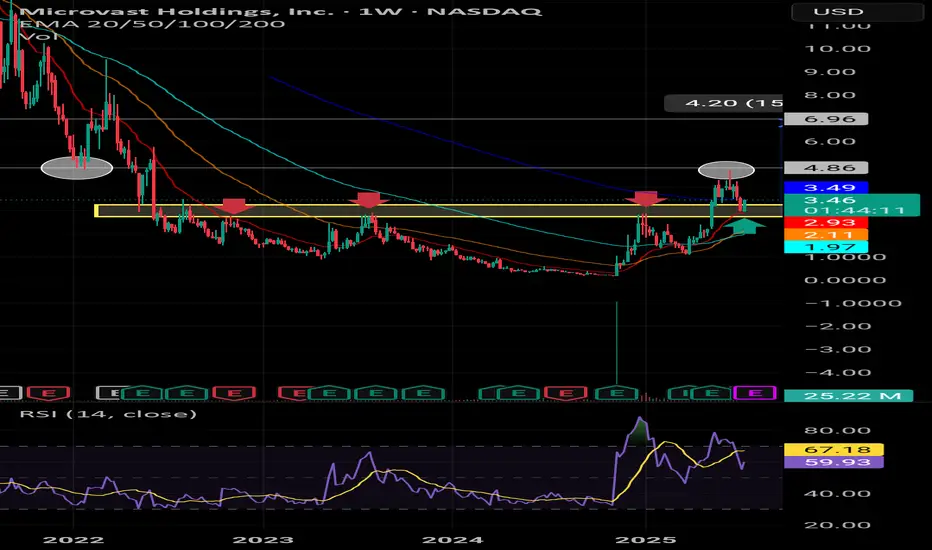
MVST: How Far Can It Soar? What Are the Chart Signals Telling UsFrom the weekly (1W) price chart of Microvast Holdings, Inc. (MVST) stock, we can observe significant developments indicating potential upward price movement in the future.
Breaking Through Strong Resistance (Yellow Zone):
Previously, MVST's stock price was under pressure and repeatedly failed to break above the "yellow zone." This is evident from the three red arrows indicating multiple unsuccessful attempts. This zone, therefore, served as a strong and highly significant resistance level in the past.
However, recent price action clearly shows that the price has successfully broken through this yellow zone. This is a highly positive signal, indicating a shift in momentum. It is anticipated that once this old resistance is breached, the yellow zone will transform into a crucial "support level" in the future, helping to prevent the price from easily falling back below it.
Clearing Selling Pressure from Bag Holders:
Historically, the price once touched the area marked by the "circle" before sharply declining. The probable reason for this was a large number of investors who had bought the stock at higher prices and had been "holding at a loss" (bag holders) for a long time. They decided to "sell off" to realize profits when the price recovered, or to cut their losses. This type of selling is a common phenomenon when a stock recovers from its lows.
Current Positive Signals:
The current ability of the price to break above the yellow zone, after the selling pressure from these long-term holders has largely been absorbed, indicates that significant buying interest has returned and is now stronger than the selling pressure.
How Far Can MVST Soar?
With this break above a significant resistance and the growing buying momentum, the chart displays a potential target at the 4.20 USD level, which is substantially higher than the current price. Nevertheless, investors should also monitor the trading volume to confirm the strength of this upward trend and consider other fundamental factors of the company before making investment decisions.
Conclusion:
The overall chart analysis suggests that MVST is transitioning from a stagnant trend to a clear upward trend. The breakthrough of significant resistance and the reduction in selling pressure from long-term holders position MVST for potential appreciation to higher price levels in the near future.
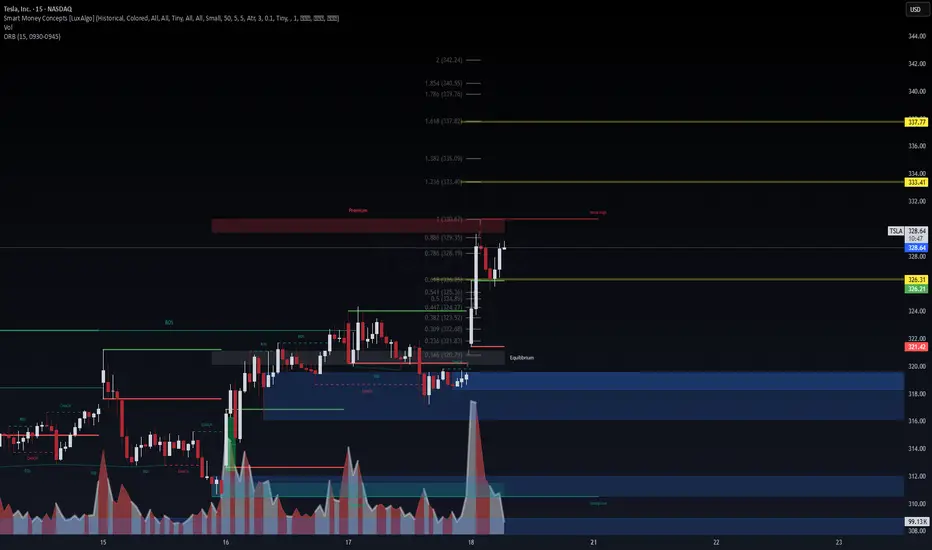
$TSLA Fibonacci Expansion Targets in Play – VolanX Precision Le🔋 NASDAQ:TSLA Fibonacci Expansion Targets in Play – VolanX Precision Levels
TSLA just powered through a clean bullish reversal from the discount zone and now trades inside the premium supply block near 330.67. This zone aligns with:
📍 0.886 Fib (329.35)
📍 Weak high at prior inefficiency
📍 VolanX ORB resistance (326.21–330.67)
🧠 WaverVanir VolanX Setup:
✅ CHoCH → BOS → Premium Tap
✅ ORB (15) broken to upside with volume (76.6K)
🟡 Currently testing equilibrium/premium confluence
🎯 Fibonacci Expansion Targets:
1.236 → 333.40
1.382 → 335.09
1.618 → 337.77
2.0+ range → 342–347 (if melt-up continues)
⚠️ Trade Logic:
A pullback to 326.30 may serve as a re-entry zone.
Watch for rejection at 330.67 — if it fails, bulls could reclaim control into the 333–337 fib cluster.
Macro + flows suggest continuation, but premium rejection remains possible. Stay nimble.
📌 #TSLA #Tesla #WaverVanir #VolanXProtocol #SmartMoneyConcepts #ORB #Fibonacci #LiquidityZones #BreakoutSetup #TradingView #OptionsFlow #Scalping #MacroMomentum
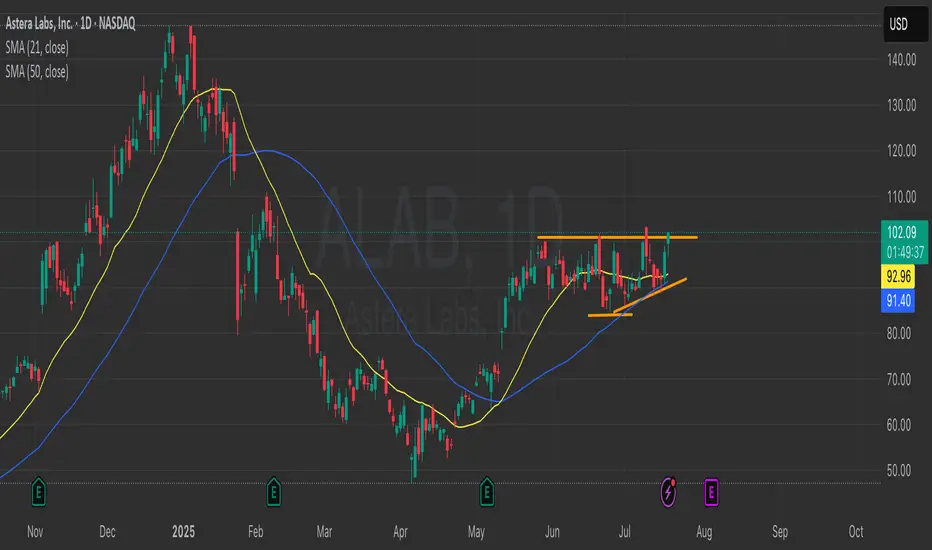
Will ALAB Finallyt Breakout?NASDAQ:ALAB has had several breakout attempts to no avail? Is now the time? Keep an eye on it, on the verge up starting an uptrend.... I hope I did not jinx it.
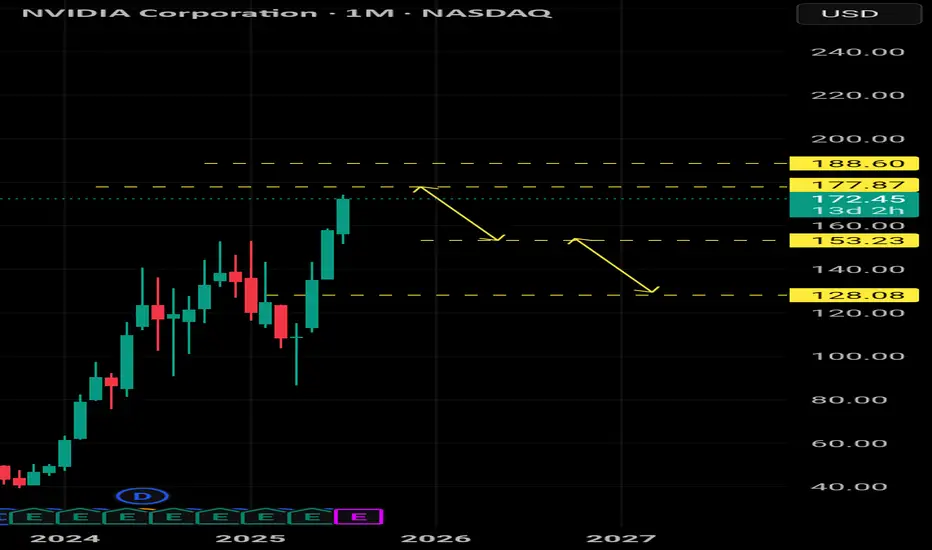
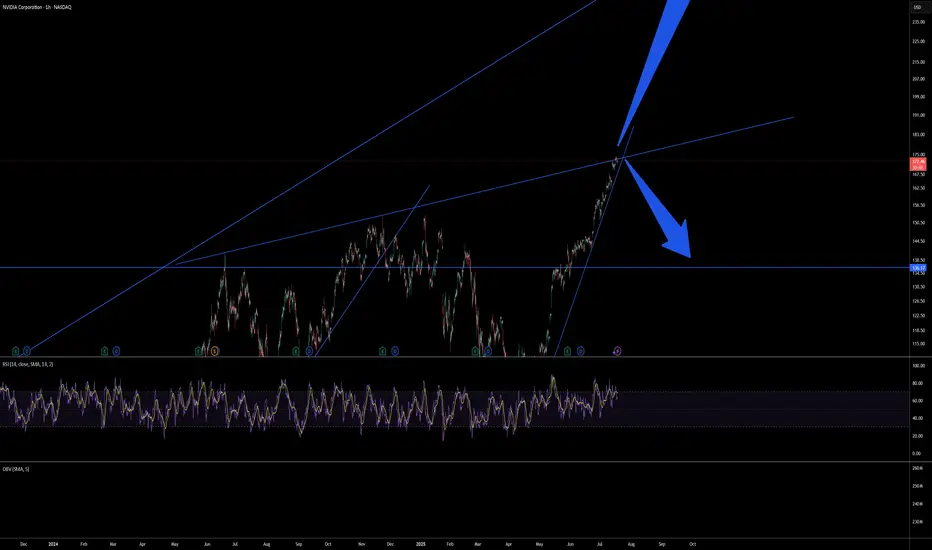
Potential NVIDIA Pullback: Watch These Key SupportsWe might witness a correction on one of the strongest stocks – NVIDIA
The level 177 is a very critical support.
Followed by the level 188 as another key level.
Correction targets are clearly illustrated on the chart in front of you.
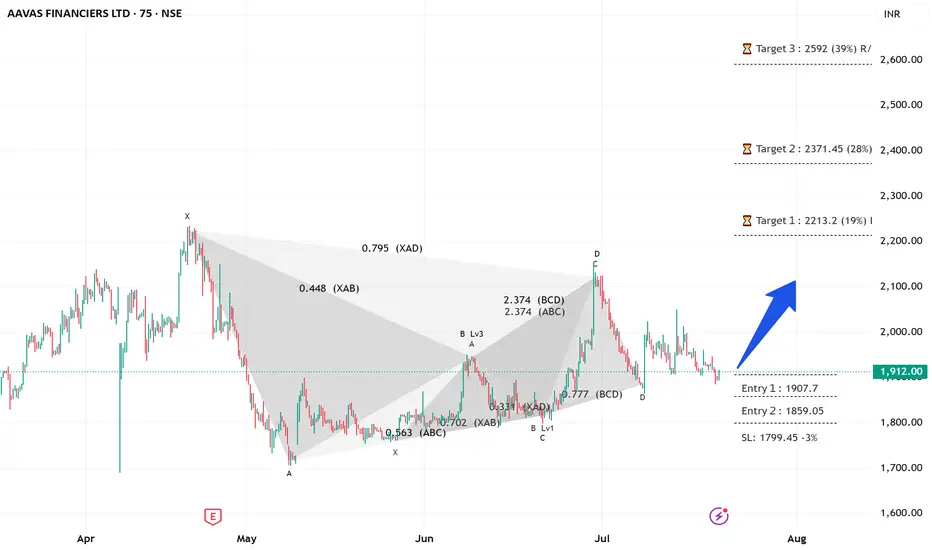
AAVAS -----BULLISH HARMONICS running 75 mins short to medium This stock is exhibiting a bullish harmonics wave structure.
correction wave leg seems completed
Investing in declines is a smart move for short/ long-term players.
Buy in DIPS recommended
Long-term investors prepare for strong returns over the next two to five years.
Every graphic used to comprehend & LEARN & understand the theory of Elliot waves, Harmonic waves, Gann Theory, and Time theory
Every chart is for educational purposes.
We have no accountability for your profit or loss.
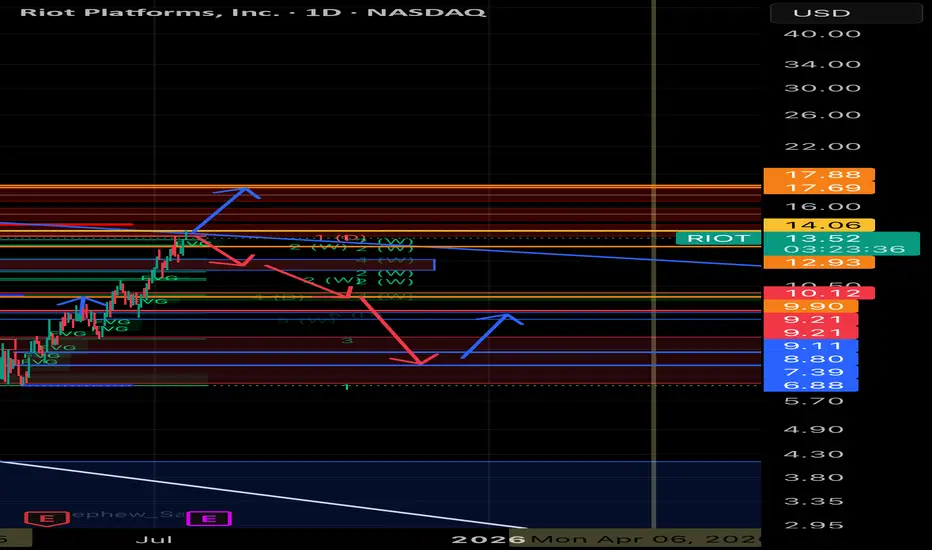
RIOT Platforms, Inc. ($RIOT) – Price Decision Point Near: $17 Br
📆 Timeframe: Daily (1D)
📈 Current Price: ~$13.56
🪙 Key Correlation: Moves in strong tandem with Bitcoin ( CRYPTOCAP:BTC )
⸻
🔧 Chart Analysis Summary
NASDAQ:RIOT has approached a major confluence zone just below $14.06, where several resistance levels, order blocks, and fair value gaps converge. Historically, this zone has rejected price multiple times, making it a critical inflection point.
The technicals suggest a binary outcome is likely in the near term:
⸻
🟢 Upside Scenario – Target: $17.35 to $17.88
If RIOT breaks above the $14.06 resistance with conviction:
• Price could push quickly toward $17.35–$17.88, where:
• Multiple historical supply zones exist
• Large prior rejection candles originated
• LuxAlgo and order block indicators flag institutional interest
• Momentum would likely align with a concurrent breakout in Bitcoin above $120K
⸻
🔴 Downside Scenario – Target: $10.12 to $9.70
If RIOT fails to close above $14 and loses $12.93 support:
• Expect retracement toward:
• $12.05
• $11.50
• Key demand near $10.12–$9.70
• These zones are backed by previous price consolidation, fair value gap fills, and historical bounce levels.
⸻
🔗 Bitcoin ( BITSTAMP:BTCUSD ) Connection
📉 Current BTC Price: ~$117,747
BTC has recently:
• Tagged a long-standing resistance band ($119,182–$120,000)
• Rejected sharply with multiple fair value gaps below
• Holding trendline support, but weakening structure is visible
If Bitcoin breaks below its trendline, a move toward $91K–$92K becomes likely — this would drag RIOT down with it.
If Bitcoin breaks above $120K, momentum could surge across crypto-exposed stocks, and RIOT may follow with a rapid leg up.
⸻
🎯 Conclusion
Scenario Trigger RIOT Target
✅ Bullish BTC breaks $120K $17.35–$17.88
❌ Bearish BTC rejects + loses trendline $12.05 → $11.50 → $10.12–$9.70
⸻
❓Your Turn:
Do you think RIOT breaks out or breaks down?
Let’s see how this unfolds.
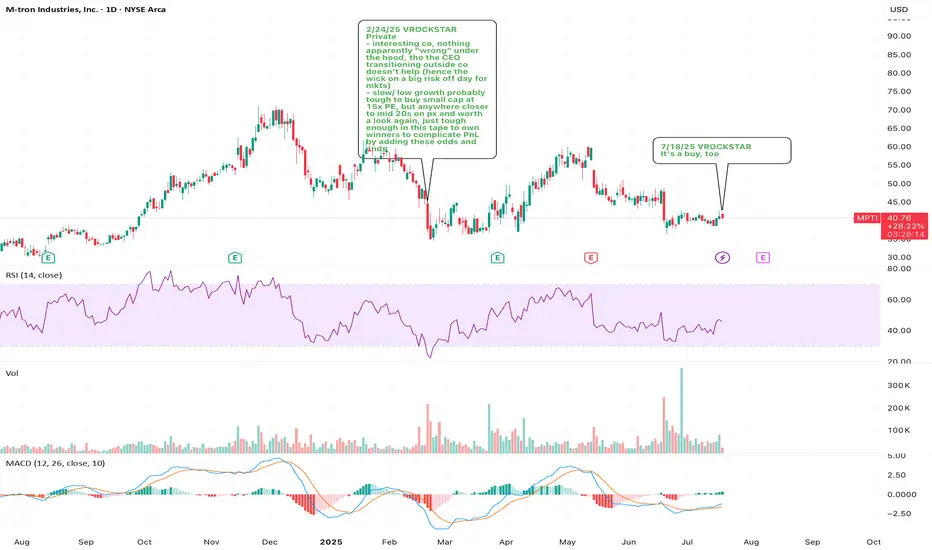
7/18/25 - $mpti - It's a buy, too7/18/25 :: VROCKSTAR :: AMEX:MPTI
It's a buy, too
- in the world of meme everything
- it helps to trade closer to $1, bc apes like to talk about $1 going to $100.
- it's also helps to have an active options chain
- but nevertheless, there are good businesses that are growing, generate cash and have good stories in the right industries that don't necessarily check those boxes
- while i'll probably not neck out on this one today, mainly bc i have my hands full w higher conviction stories, it's one of the top names on my space list ( OTC:MDALF really got away from me, even before i felt comfortable writing about it... kept going higher)
- i'd put this one as probably a close #2 even tho it's much smaller, in a totally different domain, and more defense oriented (and for the record, all war is evil, almost self evidently). however, protection and protecting oneself is a necessary element of the world we live in. these guys supply some cool warez
here's a description from koyfin
M-tron Industries, Inc. designs, manufactures, and markets frequency and spectrum control products to control the frequency and timing of signals in electronic circuits in various applications in the United States and internationally. The company offers radio frequency, microwave, and millimeter wave filters; cavity, crystal, ceramic, lumped element, and switched filters; high performance and high frequency oven-controlled crystal oscillators (OCXO), integrated phase-locked loops OCXOs, temperature-compensated crystal oscillators, voltage-controlled crystal oscillators, and low jitter and harsh environment oscillators; crystal resonators, integrated microwave assemblies, and solid-state power amplifier products. It serves commercial and military aerospace, defense, space, avionics, and industrial markets. The company was founded in 1965 and is headquartered in Orlando, Florida.
- so while MSD+ fcf yields are "good", they're not really in my "it's obvious" zone. then again, typically this is the case for good co's running just fine
- i'd want to get some clarity on why CEO left, which i haven't - any ideas or digs here on the comments wb appreciated
- what do u think anon?
V
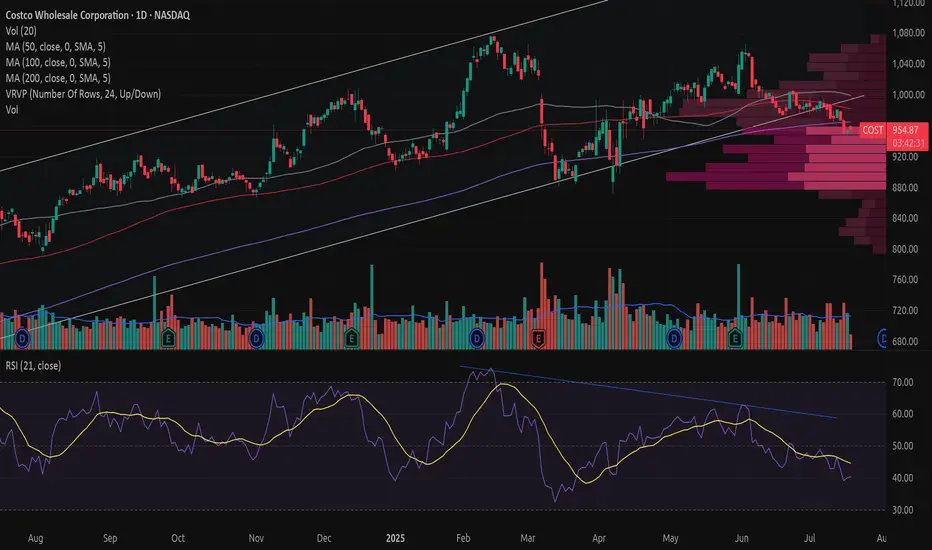
Costco has broken down from a rising trend Costco has broken down from a rising trend with increased volume and a significant price drop exceeding 3%.
The trendline has not been retested after the breakdown, but a retest is not required.
The price has support around 910 and 875.
There is a declining RSI(21) and negative volume balance over the past month.
The price is trading below a green Ichimoku cloud, and Senkou Span B has crossed above Senkou Span A in the forward-looking cloud, indicating weakening momentum ahead.
From a technical standpoint, Costco appears negative in the medium term (one to six months).
This analysis does not represent a long-term forecast.
Fundamental analysts remain largely positive on the stock.
Disclaimer: I recently exited my position in Costco. The position had shown weak performance, and I am also reducing exposure to the USD.
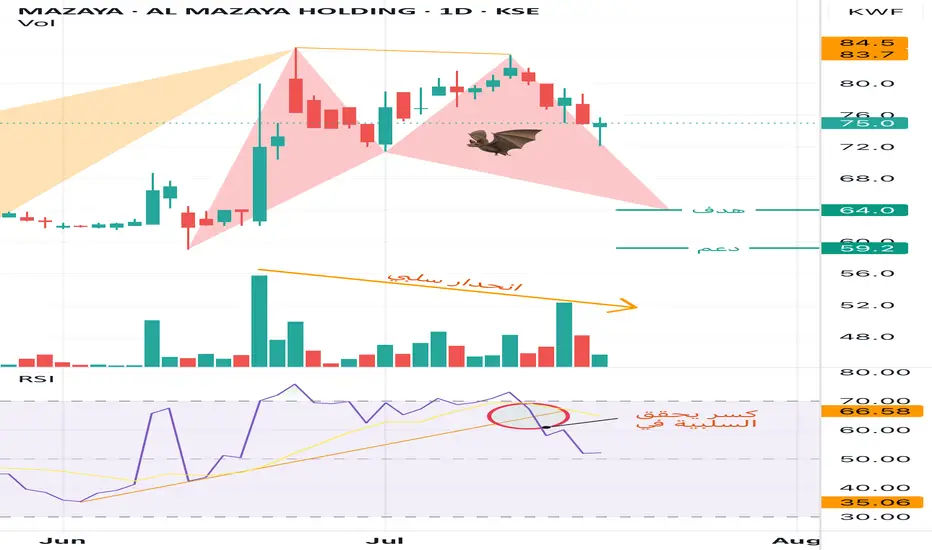
Al Mazaya Holding (MAZAYA) – Daily ChartAl Mazaya has entered a confirmed bearish phase, supported by multiple technical signals. The current setup suggests a continuation of the downside movement, with two key downside targets in play.
Key Technical Signals:
1. Bearish Harmonic Pattern – Bat Formation:
• The chart has formed a harmonic Bat pattern, which typically precedes a price decline.
• The pattern’s projected target is 64.0 KWF, with a further potential move toward 59.2 KWF, acting as a second-line support if the initial support near 63.0 KWF fails.
2. RSI Breakdown:
• The Relative Strength Index (RSI) has broken below its rising trendline and the moving average, confirming loss of momentum.
• This breakdown is a strong bearish signal, indicating weakening demand and increasing selling pressure.
3. Volume Decline – Negative Divergence:
• A clear volume divergence is visible, with trading volumes declining despite previous price rallies.
• This indicates distribution behavior, where smart money may be exiting positions, adding to the bearish bias.
Support and Resistance Levels:
• Current Price: 75.0 KWF
• First Support / Bat Target: 64.0 KWF
• Second Support: 59.2 KWF
• Resistance Range: 83.7 – 84.5 KWF (previous swing high)
Conclusion:
The technical structure for Al Mazaya Holding has shifted to bearish. The breakdown in RSI, the completion of the Bearish Bat pattern, and the diminishing volume all reinforce the possibility of a price decline toward 64.0 KWF, and potentially to 59.2 KWF if downward momentum continues. Investors should exercise caution and closely monitor support levels for any reversal signs.
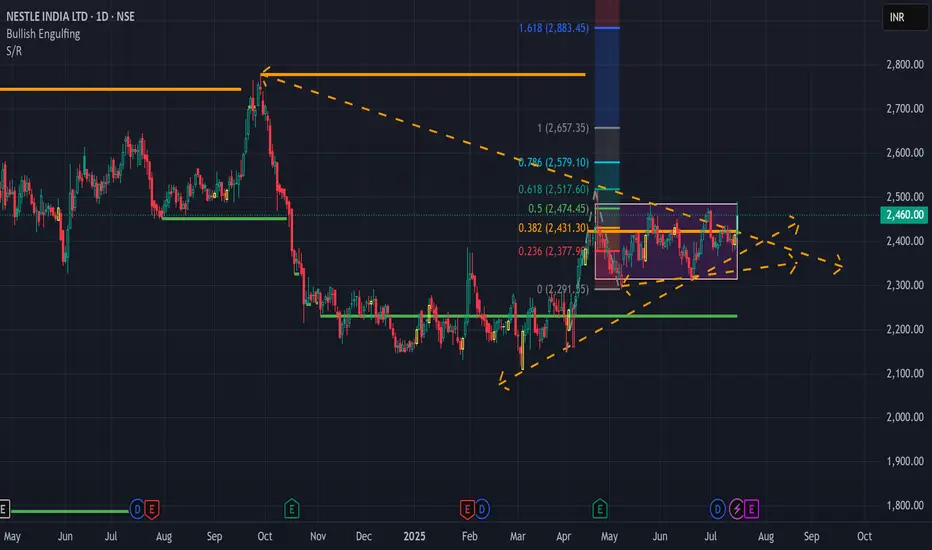
Nestle India, Breakout, 1D, LongNestle India tried to break the resistance at 2480 but failed multiple times. If it breaks this level of 2480 with Bullish candlestick patterns like Bullish Engulfing, Hammer & Inverted Hammer, Piercing Line, Morning Star, Three White Soldiers, Tweezer Bottoms or Bullish Harami, then a trade can be planned in it with target of 2530 and 2580.
Entry: 2480 (after Bullish Candlestick pattern)
Target1: 2530
Target2: 2580.
SL 2450
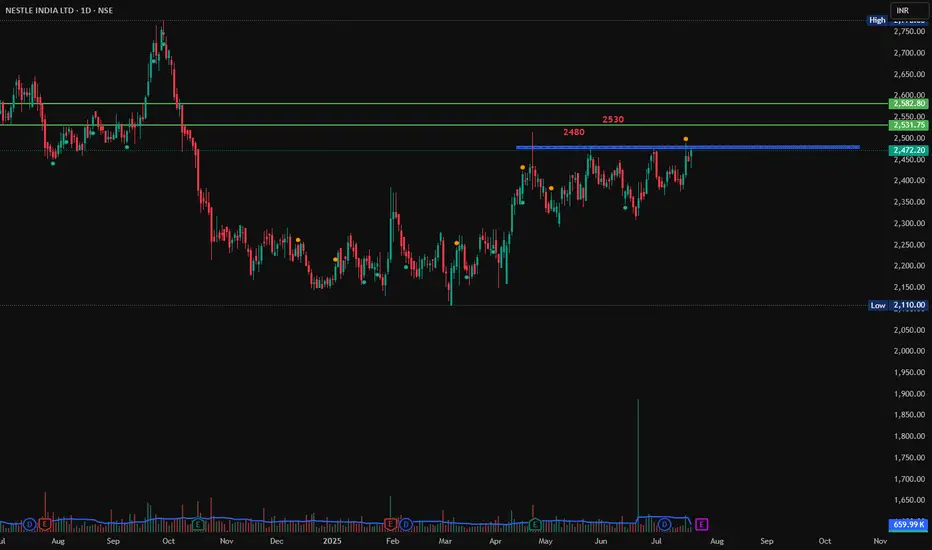
Nestle India in BreakoutNSE:NESTLEIND shows a breakout of a bullish ascending traingle trend. You can enter at 2460 and Target for 2640.