Hard candy Christmas: 'Soft landing' hopes fade ahead of CPI/Fed
- S&P 500, Dow rise modestly, Nasdaq just above flat
- Energy leads S&P 500 sector gainers; cons disc weakest group
- Euro STOXX 600 index down ~0.5%
- Dollar ~flat; gold, bitcoin dip; crude surges ~4%
- U.S. 10-Year Treasury yield edges down to ~3.56%
HARD CANDY CHRISTMAS: 'SOFT LANDING' HOPES FADE AHEAD OF CPI/FED (1100 EST/1600 GMT)
It seems that as far as market participants are concerned, we might as well skip Monday, because everyone's focus is fixed on Tuesday and Wednesday.
That's when the Labor Department releases what is likely to be one of its most closely-watched consumer prices (CPI) reports ever, followed the next day by Powell & Co's interest rate decision.
The above paragraph is borderline unnecessary. CPI and the Fed have been financial market's dual obsession for days and it seems to be all anyone is talking about.
That includes Oxford Economics (OE), which issued a CPI/Fed preview on Friday.
In the note, OE chief economist Ryan Sweet writes "we don't think the Fed will be able to engineer a soft landing," referring to the likelihood of recession.
"The economy is doing better than expected in Q4 and this positive momentum will delay the start of the recession until Q2 2023, one quarter later than we previously forecast," Sweet adds. "Still, the Fed's ongoing tightening will weigh on corporate profits, hiring and business investment, leading to a mild downturn next year."
CPI will be the November inflation tie-breaker. Average wages defied expectations by heating up, while producer prices cooled - albeit not by as much as analysts hoped.
The way things stand now, headline and core CPI are expected to have cooled down last month to 7.3% and 6.1%, respectively.
That's still scalding hot, and would mark the 12th consecutive month CPI has landed north of wage growth - marking a full year of declining real wages, a state of affairs that can't last forever, and a worrisome prospect considering consumer spending represents about 70% of the U.S. economy.
Here's a look at major inflation indicators, and how far they have to go before approaching the Fed's average annual 2% target:
According to OE's crystal ball, next year annual CPI growth will average 4.7% and cool down to 2.5% the year after that. The unemployment rate is seen rising to 4.2% and 4.6% in 2023 and 2024, respectively.
(Stephen Culp)
*****
U.S. STOCKS EDGE UP AHEAD OF KEY DATA, FED (0953 EST/1453 GMT)
Wall Street's main stock indexes are slightly higher early on Monday as investors await inflation data and the Federal Reserve's policy decision later this week to gauge the U.S. economic outlook amid worries of a recession.
According to the CME's FedWatch Tool, the market is pricing in a 77% chance of a 50 basis point rate hike at the conclusion of Wednesday's FOMC meeting. There is a 23% chance of a 75 basis point rate hike.
In any event, as markets approach the halfway mark of the final month on trading this year, the DJI ![]() DJI is significantly outperforming the other main indexes.
DJI is significantly outperforming the other main indexes.
Using Refinitiv data, the DJI is off around 7.5% this year vs a more than 17% drop for the S&P 500 ![]() SPX. As stands, the near 1000 basis points (bps) of DJI outperformance is the most since 1008 bps in 1934.
SPX. As stands, the near 1000 basis points (bps) of DJI outperformance is the most since 1008 bps in 1934.
The DJI is outperforming the Nasdaq ![]() IXIC, which is off about 30% this year, by around 2,200 bps, or the most since 3,311 bps in 2000, the year the Y2K tech-bubble burst.
IXIC, which is off about 30% this year, by around 2,200 bps, or the most since 3,311 bps in 2000, the year the Y2K tech-bubble burst.
Here is a snapshot of where markets stood about 20 minutes into the trading day:
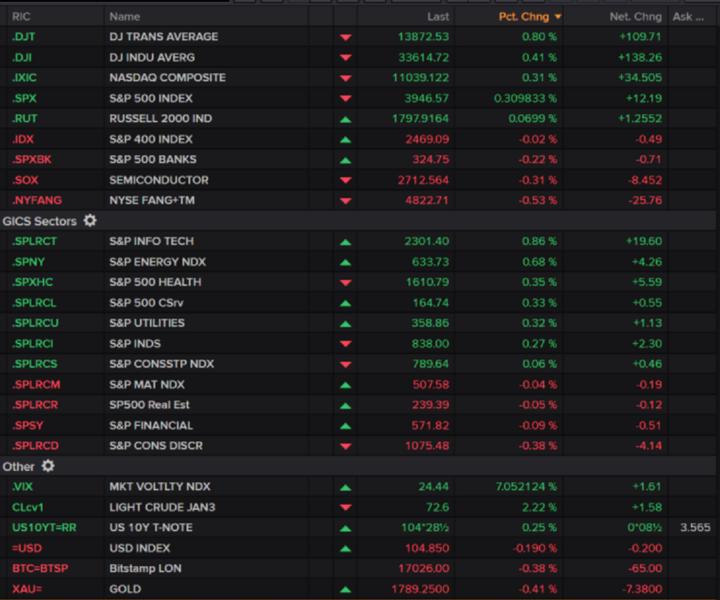
(Terence Gabriel)
*****
TRADERS EYE S&P 500 SUPPORT AND RESISTANCE AHEAD OF KEY EVENTS (0857 EST/1357 GMT)
Traders await an S&P 500 index ![]() SPX breakout vs some significant support and resistance levels. This, with key event risks: the November CPI report on Tuesday and the results of the latest FOMC meeting on Wednesday:
SPX breakout vs some significant support and resistance levels. This, with key event risks: the November CPI report on Tuesday and the results of the latest FOMC meeting on Wednesday:
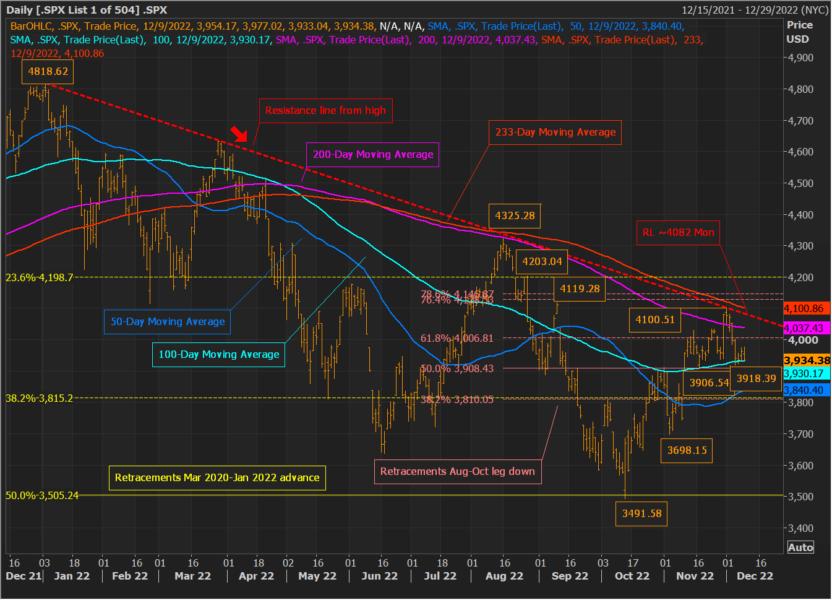
Although the SPX mounted three straight closes above its closely watched 200-day moving average (DMA) Nov. 30-Dec. 02, the benchmark index failed to overwhelm two other significant barriers.
These included the resistance from the early-January high and a Fibonacci-based longer-term moving average, the 233-DMA.
Of note, the SPX did violate the 200-week moving average (WMA) in late September and mid-October, but the 233-WMA served to contain that weakness.
Thus, on the upside, traders have shifted their primary focus away from the descending 200-DMA, which ended Friday just over 4,037, to the resistance line, which resides around 4,082 on Monday, and the descending 233-WMA which ended Friday at about 4,101.
On the downside, the 100-DMA, which ended Friday just over 3,930, is providing support. Despite flirting with the 100-DMA Tuesday-Friday last week, the SPX did not end a session below it. In fact, the SPX has ended above the 100-DMA since reclaiming it on Nov. 10.
Additional support is in the 3,918.39-3,906.54 area, which includes the Dec. 6 and Nov. 17 lows. The 50% retracement of the August-October down leg is at 3,908.43.
Thus, traders will be watching for momentum sparks to see if by mid-week, the SPX is hurdling out of the range defined by these support and resistance levels.
(Terence Gabriel)
*****
FOR MONDAY'S LIVE MARKETS' POSTS PRIOR TO 0900 EST/1400 GMT - CLICK HERE