OPEN-SOURCE SCRIPT
Percentage Price Over SMA
Return the percentage of closing prices greater than SMA's with periods within a user-selected range. An exponential moving average applied to these results is also displayed (in orange).
Settings
Usage
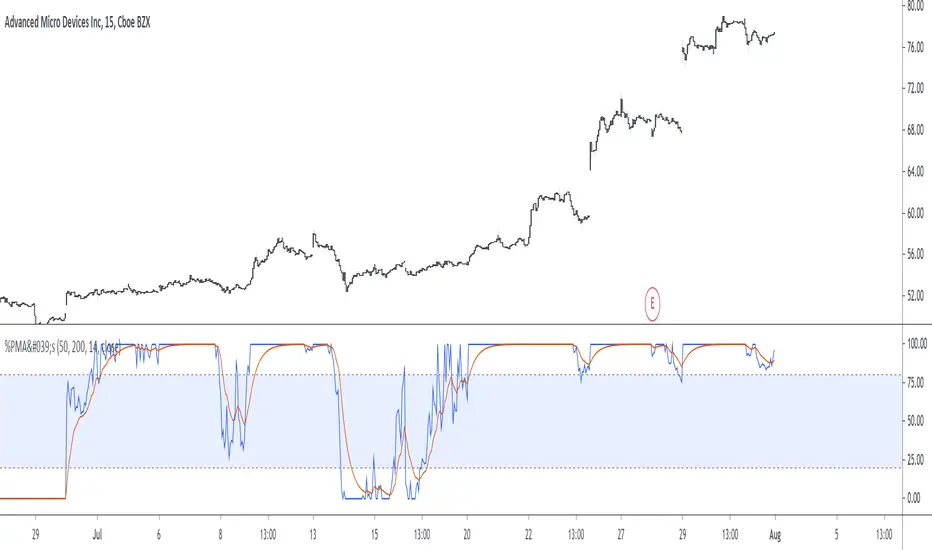
The indicator is a normalized oscillator. A value of 100 indicates that 100% of the current closing price is over SMA's with periods ranging from min to max, this indicates a bullish market, while a value of 0 would indicate a bearish market.

In this image the indicator use min = 50 and max = 200, here AMD has been strongly bullish at the start, and ended being strongly bearish at the end, during this bullish period the indicator is over its overbought level, while it is under its oversold level during the bearish period.
In case the market is ranging we can expect the indicator to be around 50%, using the smoothed result might be more useful to detect ranging markets with this indicator.

If the smoothed result is within the overbought/oversold levels, then we can say that the market is either ranging or transitioning from a bullish/bearish market to an opposite one.
Settings
- Min : Minimum period of the SMA in the range
- Max : Maximum period of the SMA in the range
- Smooth : Period of the EMA
- Src : Input series of the indicator
Usage
The indicator is a normalized oscillator. A value of 100 indicates that 100% of the current closing price is over SMA's with periods ranging from min to max, this indicates a bullish market, while a value of 0 would indicate a bearish market.
In this image the indicator use min = 50 and max = 200, here AMD has been strongly bullish at the start, and ended being strongly bearish at the end, during this bullish period the indicator is over its overbought level, while it is under its oversold level during the bearish period.
In case the market is ranging we can expect the indicator to be around 50%, using the smoothed result might be more useful to detect ranging markets with this indicator.
If the smoothed result is within the overbought/oversold levels, then we can say that the market is either ranging or transitioning from a bullish/bearish market to an opposite one.
Open-source script
In true TradingView spirit, the creator of this script has made it open-source, so that traders can review and verify its functionality. Kudos to the author! While you can use it for free, remember that republishing the code is subject to our House Rules.
Check out the indicators we are making at luxalgo: tradingview.com/u/LuxAlgo/
"My heart is so loud that I can't hear the fireworks"
"My heart is so loud that I can't hear the fireworks"
Disclaimer
The information and publications are not meant to be, and do not constitute, financial, investment, trading, or other types of advice or recommendations supplied or endorsed by TradingView. Read more in the Terms of Use.