OPEN-SOURCE SCRIPT
✅ VMA Avg ATR + Days to Targets 🎯
1) The trend filter: LazyBear VMA
You implement the well‑known “LazyBear” Variable Moving Average (VMA) from price directional movement (pdm/mdm).
Internally you:
Smooth positive/negative one‑bar moves (pdmS, mdmS),
Turn them into relative strengths (pdiS, mdiS),
Measure their difference/total (iS), and
Normalize that over a rolling window to get a scaling factor vI.
The VMA itself is then an adaptive EMA:
vma := (1 - k*vI) * vma[1] + (k*vI) * close, where k = 1/vmaLen.
When vI is larger, VMA hugs price more; when smaller, it smooths more.
Coloring:
Green when vma > vma[1] (rising),
Red when vma < vma[1] (falling),
White when flat.
Candles are recolored to match.
Why this matters: The VMA color is your trend regime; everything else in the script keys off changes in this color.
2) What counts as a “valid” new trend?
A new trend is valid only when the previous bar was white and the current bar turns green or red:
validTrendStart := vmaColor != color.white and vmaColor[1] == color.white.
When that happens, you start a trend segment:
Save entry price (startPrice = close) and baseline ATR (startATR = ATR(atrLen)).
Reset “extreme” trackers: extremeHigh = high, extremeLow = low.
Timestamp the start (trendStartTime = time).
Effect: You only study / trade transitions out of a flat VMA into a slope. This helps avoid chop and reduces false starts.
3) While the trend is active
On each new bar without a color change:
If green trend: update extremeHigh = max(extremeHigh, high).
If red trend: update extremeLow = min(extremeLow, low).
This tracks the best excursion from the entry during that single trend leg.
4) When the VMA color changes (trend ends)
When vmaColor flips (green→red or red→green), you close the prior segment only if it was a valid trend (started after white). Then you:
Compute how far price traveled in ATR units from the start:
Uptrend ended: (extremeHigh - startPrice) / startATR
Downtrend ended: (startPrice - extremeLow) / startATR
Add that result to a running sum and count for the direction:
totalUp / countUp, totalDown / countDown.
Target checks for the ended trend (no look‑ahead):
T1 uses the previous average ATR move before the just‑ended trend (prevAvgUp/prevAvgDown).
Up: t1Up = startPrice + prevAvgUp * startATR
Down: t1Down = startPrice - prevAvgDown * startATR
T2 is a fixed 6× ATR move from the start (up or down).
You increment hit counters and also accumulate time‑to‑hit (ms from trendStartTime) for any target that got reached during that ended leg.
If T1 wasn’t reached, it counts as a miss.
Immediately initialize the next potential trend segment with the current bar’s startPrice/startATR/extremes and set validTrendStart according to the “white → color” rule.
Important detail: Using prevAvgUp/Down to evaluate T1 for the just‑completed trend avoids look‑ahead bias. The current trend’s performance isn’t used to set its own T1.
5) Running statistics & targets (for the current live trend)
After closing/adding to totals:
avgUp = totalUp / countUp and avgDown = totalDown / countDown are the historical average ATR move per valid trend for each direction.
Current plotted targets (only visible while a valid trend is active and in that direction):
T1 Up: startPrice + avgUp * startATR
T2 Up: startPrice + 6 * startATR
T1 Down: startPrice - avgDown * startATR
T2 Down: startPrice - 6 * startATR
The entry line is also plotted at startPrice when a valid trend is live.
If there’s no history yet (e.g., first trend), avgUp/avgDown are na, so T1 is na until at least one valid trend has closed. T2 still shows (6× ATR).
6) Win rate & time metrics
Win % (per direction):
winUp = hitUpT1 / (hitUpT1 + missUp) and similarly for down.
(This is strictly based on T1 hits vs misses; T2 hits don’t affect Win% directly.)
Average days to hit T1/T2:
The script stores milliseconds from trend start to each target hit, then reports the average in days separately for Up/Down and for T1/T2.
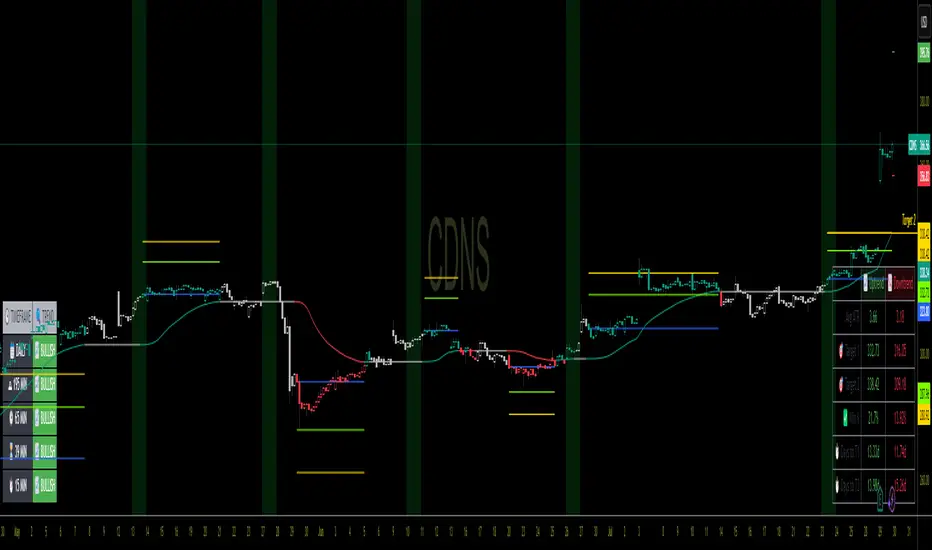
7) The dashboard table (bottom‑right)
It shows, side‑by‑side for Up/Down:
Avg ATR: historical average ATR move per completed valid trend.
🎯 Target 1 / Target 2: the current trend’s price levels (T1 = avgATR×ATR; T2 = 6×ATR).
✅ Win %: T1 hit rate so far.
⏱ Days to T1/T2: average days (from valid trend start) for the targets that were reached.
8) Alerts
“New Trend Detected” when a valid trend starts (white → green/red).
Target hits for the active trend:
Uptrend: separate alerts for T1 and T2 (high >= target).
Downtrend: separate alerts for T1 and T2 (low <= target).
9) Inputs & defaults
vmaLen = 17: governs how adaptive/smooth the VMA is (larger = smoother, fewer trend flips).
atrLen = 14: ATR baseline for sizing targets and normalizing moves.
10) Practical read of the plots
When you see white → green: that bar is your valid entry (trend start).
An Entry Line appears at the start price.
Target lines appear only for the active direction. T1 scales with your historical average ATR move; T2 is a fixed stretch (6× ATR).
The table updates as more trends complete, refining:
The average ATR reach (which resets your T1 sizing),
The win rate to T1, and
The average days it typically takes to hit T1/T2.
Subtle points / edge cases
No look‑ahead: T1 for a finished trend is checked against the prior average (not including the trend itself).
First trends: Until at least one valid trend completes, T1 is na (no history). T2 still shows.
Only “valid” trends are counted: Segments must start after a white bar; flips that happen color→color without a white in between don’t start a new valid trend.
Time math: Uses bar timestamps in ms, converted to days; results reflect the chart’s timeframe/market session.
TL;DR
The VMA color defines the regime; entries only trigger when a flat (white) VMA turns green/red.
Each trend’s max excursion from entry is recorded in ATR units.
T1 for current trends = (historical average ATR move) × current ATR from entry; T2 = 6× ATR.
The table shows your evolving edge (avg ATR reach, T1 win%, and days to targets), and alerts fire on new trends and target hits.
If you want, I can add optional features like: per‑ticker persistence of stats, excluding very short trends, or making T2 a user input instead of a fixed 6× ATR.
You implement the well‑known “LazyBear” Variable Moving Average (VMA) from price directional movement (pdm/mdm).
Internally you:
Smooth positive/negative one‑bar moves (pdmS, mdmS),
Turn them into relative strengths (pdiS, mdiS),
Measure their difference/total (iS), and
Normalize that over a rolling window to get a scaling factor vI.
The VMA itself is then an adaptive EMA:
vma := (1 - k*vI) * vma[1] + (k*vI) * close, where k = 1/vmaLen.
When vI is larger, VMA hugs price more; when smaller, it smooths more.
Coloring:
Green when vma > vma[1] (rising),
Red when vma < vma[1] (falling),
White when flat.
Candles are recolored to match.
Why this matters: The VMA color is your trend regime; everything else in the script keys off changes in this color.
2) What counts as a “valid” new trend?
A new trend is valid only when the previous bar was white and the current bar turns green or red:
validTrendStart := vmaColor != color.white and vmaColor[1] == color.white.
When that happens, you start a trend segment:
Save entry price (startPrice = close) and baseline ATR (startATR = ATR(atrLen)).
Reset “extreme” trackers: extremeHigh = high, extremeLow = low.
Timestamp the start (trendStartTime = time).
Effect: You only study / trade transitions out of a flat VMA into a slope. This helps avoid chop and reduces false starts.
3) While the trend is active
On each new bar without a color change:
If green trend: update extremeHigh = max(extremeHigh, high).
If red trend: update extremeLow = min(extremeLow, low).
This tracks the best excursion from the entry during that single trend leg.
4) When the VMA color changes (trend ends)
When vmaColor flips (green→red or red→green), you close the prior segment only if it was a valid trend (started after white). Then you:
Compute how far price traveled in ATR units from the start:
Uptrend ended: (extremeHigh - startPrice) / startATR
Downtrend ended: (startPrice - extremeLow) / startATR
Add that result to a running sum and count for the direction:
totalUp / countUp, totalDown / countDown.
Target checks for the ended trend (no look‑ahead):
T1 uses the previous average ATR move before the just‑ended trend (prevAvgUp/prevAvgDown).
Up: t1Up = startPrice + prevAvgUp * startATR
Down: t1Down = startPrice - prevAvgDown * startATR
T2 is a fixed 6× ATR move from the start (up or down).
You increment hit counters and also accumulate time‑to‑hit (ms from trendStartTime) for any target that got reached during that ended leg.
If T1 wasn’t reached, it counts as a miss.
Immediately initialize the next potential trend segment with the current bar’s startPrice/startATR/extremes and set validTrendStart according to the “white → color” rule.
Important detail: Using prevAvgUp/Down to evaluate T1 for the just‑completed trend avoids look‑ahead bias. The current trend’s performance isn’t used to set its own T1.
5) Running statistics & targets (for the current live trend)
After closing/adding to totals:
avgUp = totalUp / countUp and avgDown = totalDown / countDown are the historical average ATR move per valid trend for each direction.
Current plotted targets (only visible while a valid trend is active and in that direction):
T1 Up: startPrice + avgUp * startATR
T2 Up: startPrice + 6 * startATR
T1 Down: startPrice - avgDown * startATR
T2 Down: startPrice - 6 * startATR
The entry line is also plotted at startPrice when a valid trend is live.
If there’s no history yet (e.g., first trend), avgUp/avgDown are na, so T1 is na until at least one valid trend has closed. T2 still shows (6× ATR).
6) Win rate & time metrics
Win % (per direction):
winUp = hitUpT1 / (hitUpT1 + missUp) and similarly for down.
(This is strictly based on T1 hits vs misses; T2 hits don’t affect Win% directly.)
Average days to hit T1/T2:
The script stores milliseconds from trend start to each target hit, then reports the average in days separately for Up/Down and for T1/T2.
7) The dashboard table (bottom‑right)
It shows, side‑by‑side for Up/Down:
Avg ATR: historical average ATR move per completed valid trend.
🎯 Target 1 / Target 2: the current trend’s price levels (T1 = avgATR×ATR; T2 = 6×ATR).
✅ Win %: T1 hit rate so far.
⏱ Days to T1/T2: average days (from valid trend start) for the targets that were reached.
8) Alerts
“New Trend Detected” when a valid trend starts (white → green/red).
Target hits for the active trend:
Uptrend: separate alerts for T1 and T2 (high >= target).
Downtrend: separate alerts for T1 and T2 (low <= target).
9) Inputs & defaults
vmaLen = 17: governs how adaptive/smooth the VMA is (larger = smoother, fewer trend flips).
atrLen = 14: ATR baseline for sizing targets and normalizing moves.
10) Practical read of the plots
When you see white → green: that bar is your valid entry (trend start).
An Entry Line appears at the start price.
Target lines appear only for the active direction. T1 scales with your historical average ATR move; T2 is a fixed stretch (6× ATR).
The table updates as more trends complete, refining:
The average ATR reach (which resets your T1 sizing),
The win rate to T1, and
The average days it typically takes to hit T1/T2.
Subtle points / edge cases
No look‑ahead: T1 for a finished trend is checked against the prior average (not including the trend itself).
First trends: Until at least one valid trend completes, T1 is na (no history). T2 still shows.
Only “valid” trends are counted: Segments must start after a white bar; flips that happen color→color without a white in between don’t start a new valid trend.
Time math: Uses bar timestamps in ms, converted to days; results reflect the chart’s timeframe/market session.
TL;DR
The VMA color defines the regime; entries only trigger when a flat (white) VMA turns green/red.
Each trend’s max excursion from entry is recorded in ATR units.
T1 for current trends = (historical average ATR move) × current ATR from entry; T2 = 6× ATR.
The table shows your evolving edge (avg ATR reach, T1 win%, and days to targets), and alerts fire on new trends and target hits.
If you want, I can add optional features like: per‑ticker persistence of stats, excluding very short trends, or making T2 a user input instead of a fixed 6× ATR.
Open-source script
In true TradingView spirit, the creator of this script has made it open-source, so that traders can review and verify its functionality. Kudos to the author! While you can use it for free, remember that republishing the code is subject to our House Rules.
Disclaimer
The information and publications are not meant to be, and do not constitute, financial, investment, trading, or other types of advice or recommendations supplied or endorsed by TradingView. Read more in the Terms of Use.