OPEN-SOURCE SCRIPT
Midnight and 7:30 AM Open with Reset
Extreme Discount and Extreme Premium Indicator
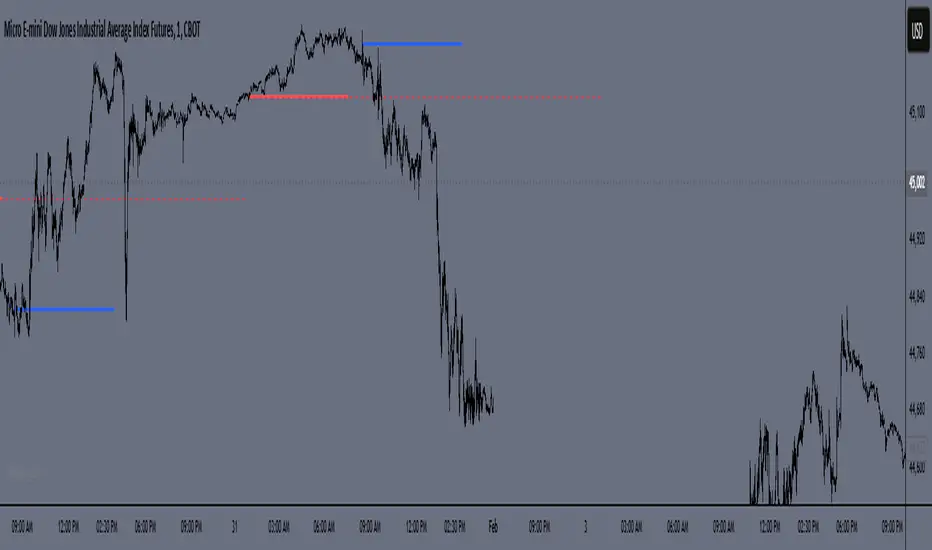
This custom indicator identifies the relationship between the current price and key discount and premium levels on the chart. It helps determine whether the price is in an "extreme discount" or "extreme premium" zone, which can be important for making trading decisions based on market structure.
Extreme Discount Zone: The indicator identifies the "extreme discount" zone when the price is below both its extreme discount levels, indicating that the market is in a potential buying area, which could signal a reversal or a good entry point to buy.
Extreme Premium Zone: The indicator marks the "extreme premium" zone when the price is above both its extreme premium levels, suggesting that the market is in a potential selling area, signaling a possible price reversal or a good entry point to sell.
The indicator dynamically adjusts and highlights these zones based on price movement, allowing traders to visualize when the price is reaching extreme levels relative to historical price action.
Key Features:
Detects when the current price is below both extreme discount levels.
Detects when the current price is above both extreme premium levels.
Highlights these extreme areas visually to help traders make informed decisions on buying or selling.
Open-source script
In true TradingView spirit, the creator of this script has made it open-source, so that traders can review and verify its functionality. Kudos to the author! While you can use it for free, remember that republishing the code is subject to our House Rules.
Disclaimer
The information and publications are not meant to be, and do not constitute, financial, investment, trading, or other types of advice or recommendations supplied or endorsed by TradingView. Read more in the Terms of Use.