OPEN-SOURCE SCRIPT
Volatility Percentage Indicator
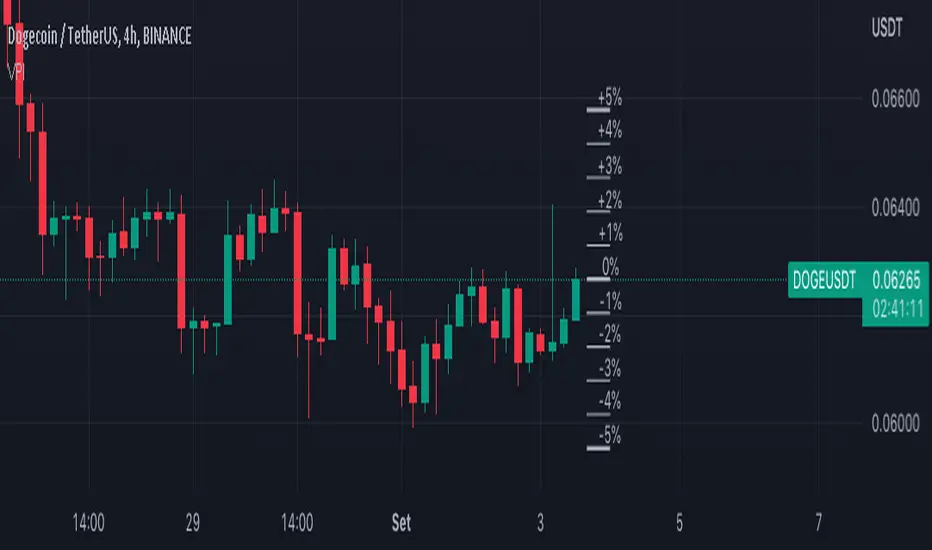
This simple indicator plot 11 lines in the chart at prices that correspond to -5%, -4%, -3%, -2%, -1%, 0%, 1%, 2%, 3%, 4%, 5%, referred to realtime price.
So the lines will move with the price.
The indicator is intended to give an at-a-glance information on price volatility by comparing the amplitude of the last candles with the percentages above.
So the lines will move with the price.
The indicator is intended to give an at-a-glance information on price volatility by comparing the amplitude of the last candles with the percentages above.
Open-source script
In true TradingView spirit, the creator of this script has made it open-source, so that traders can review and verify its functionality. Kudos to the author! While you can use it for free, remember that republishing the code is subject to our House Rules.
Disclaimer
The information and publications are not meant to be, and do not constitute, financial, investment, trading, or other types of advice or recommendations supplied or endorsed by TradingView. Read more in the Terms of Use.