OPEN-SOURCE SCRIPT
Candle Movement Marker
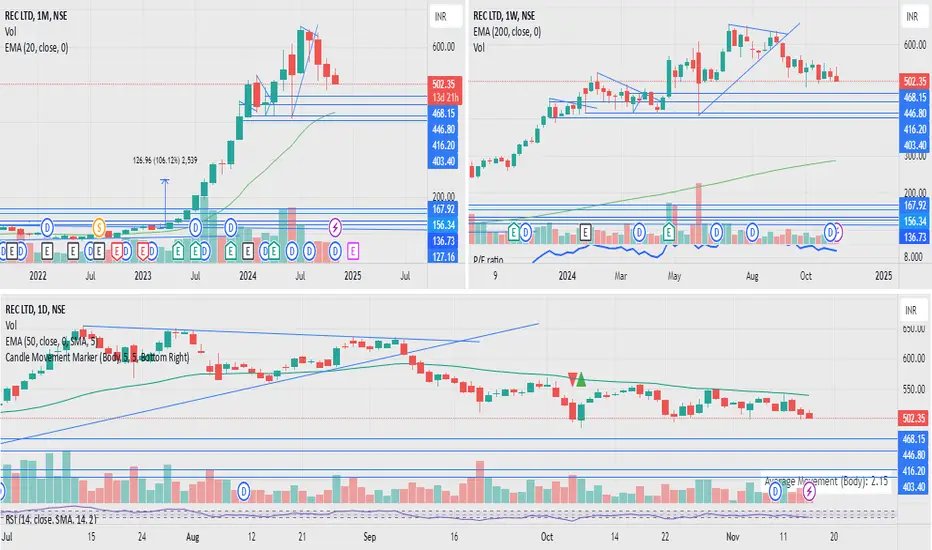
The Candle Movement Marker is a powerful Pine Script indicator designed to help traders quickly identify significant price movements within candles. Whether you're looking for large swings or want to analyze volatile periods, this tool gives you the visual cues you need to make better trading decisions.
Features:
Customizable Movement Detection: Specify whether to measure movement based on the full candle range (High-Low) or the candle body (Open-Close).
Movement Threshold Setting: Set a percentage threshold, and the indicator will mark all candles with movement greater than this value.
Visual Arrows: Bullish and bearish arrows (green and red) mark the significant candles, with the arrows moving dynamically along with the chart.
Average Movement Calculation: Displays the average movement of the last 'N' candles (fully customizable) in a convenient informational box on the chart.
Informative Placement: Choose whether to show the average movement in the top right or bottom right of the chart to avoid cluttering your analysis.
This indicator is ideal for traders who want to analyze price action, identify volatile candles, and study significant price behavior in a visually intuitive manner. Whether you’re a breakout trader or interested in understanding market momentum, Candle Movement Marker helps make the analysis easy and clear.
Use Case: This script helps traders study historical market movements by marking the most significant candles and providing an average movement over a customizable range. This makes it easy to spot when the market is making significant moves and identify trends or reversals, supporting informed decision-making.
Open-source script
In true TradingView spirit, the creator of this script has made it open-source, so that traders can review and verify its functionality. Kudos to the author! While you can use it for free, remember that republishing the code is subject to our House Rules.
Disclaimer
The information and publications are not meant to be, and do not constitute, financial, investment, trading, or other types of advice or recommendations supplied or endorsed by TradingView. Read more in the Terms of Use.