OPEN-SOURCE SCRIPT
Updated Rsi/Cci Overbought Oversold Candles
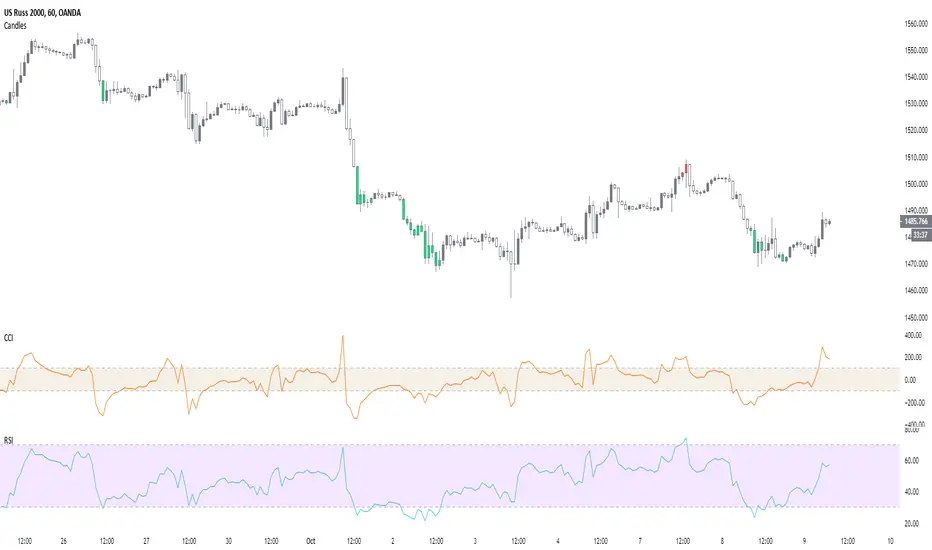
This indicator will allow you to see overbought and oversold areas of the rsi or the cci, you must set yourself the upper and lower band of the rsi (70-30) or cci (100, -100). By default, it's Rsi
I have already posted the same indicator but only with the Rsi, I wanted to posted a more complete that offers the 2.
On the chart, it is the overbought / oversold area of the Cci that is displayed
I have already posted the same indicator but only with the Rsi,
On the chart, it is the overbought / oversold area of the Cci that is displayed
Release Notes
I have the time to update the code, the latter was falsifying the result, now everything works, to get the overbought / oversold areas of the CCI, you have to tick the box and enter the values of the top and the bottom manually, same for the RSI, by default, the result is that of the RSIRelease Notes
Update to V4Open-source script
In true TradingView spirit, the creator of this script has made it open-source, so that traders can review and verify its functionality. Kudos to the author! While you can use it for free, remember that republishing the code is subject to our House Rules.
Disclaimer
The information and publications are not meant to be, and do not constitute, financial, investment, trading, or other types of advice or recommendations supplied or endorsed by TradingView. Read more in the Terms of Use.
Open-source script
In true TradingView spirit, the creator of this script has made it open-source, so that traders can review and verify its functionality. Kudos to the author! While you can use it for free, remember that republishing the code is subject to our House Rules.
Disclaimer
The information and publications are not meant to be, and do not constitute, financial, investment, trading, or other types of advice or recommendations supplied or endorsed by TradingView. Read more in the Terms of Use.