OPEN-SOURCE SCRIPT
Updated [_ParkF]RSI+
[_ParkF]RSI ----- UPGRADE ----> [_ParkF]RSI+
-------------------------------------------------------------------------------------------------------------------------------------------------------------------------------------------
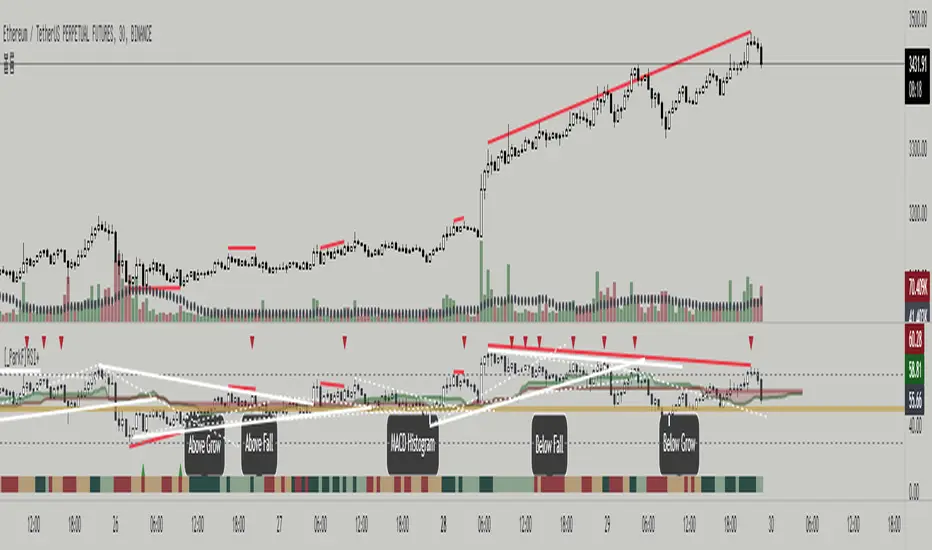
[_ParkF] The RSI index has been upgraded.
The display function of RSI Candle, RSI Line, Divergence, and Divergence Line, which were previous functions, has been maintained.
As an upgrade, two linear regression and two trend lines are drawn.
Since the two linear regression values are different, support and resistance of long-term and short-term linear regression can be confirmed.
The two trend lines also have different period values, so it is possible to check support and resistance that could not be confirmed in linear regression.
Each linear regression and trend line can be turned on and off.
In addition, each linear regression and trend line can arbitrarily modify period values and deviation values.
Log charts and linear chart switches have been added to the trend line.
I hope it will help you with your trading.
-------------------------------------------------------------------------------------------------------------------------------------------------------------------------------------------
[_ParkF] RSI 인덱스가 업그레이드되었습니다.
기존 기능이었던 캔들, 라인, 다이버전스, 다이버전스 라인의 디스플레이 기능은 그대로 유지됐다.
업그레이드로 두 개의 선형 회귀 분석과 두 개의 추세선이 그려집니다.
두 선형 회귀 값은 서로 다르기 때문에 장기 및 단기 선형 회귀의 지지 및 저항을 확인할 수 있습니다.
두 추세선의 주기 값도 다르므로 선형 회귀 분석에서 확인할 수 없었던 지지 및 저항을 확인할 수 있습니다.
각 선형 회귀선 및 추세선은 켜거나 끌 수 있습니다.
또한 각 선형 회귀선 및 추세선은 주기 값과 편차 값을 임의로 수정할 수 있습니다.
로그 차트 및 선형 차트 스위치가 추세선에 추가되었습니다.
당신의 트레이딩에 도움이 되었으면 합니다.
* I would like to express my gratitude to zdmre for revealing the linear regression source.
* I would like to express my gratitude to aaahopper for revealing the trendlines source.
-------------------------------------------------------------------------------------------------------------------------------------------------------------------------------------------
[_ParkF] The RSI index has been upgraded.
The display function of RSI Candle, RSI Line, Divergence, and Divergence Line, which were previous functions, has been maintained.
As an upgrade, two linear regression and two trend lines are drawn.
Since the two linear regression values are different, support and resistance of long-term and short-term linear regression can be confirmed.
The two trend lines also have different period values, so it is possible to check support and resistance that could not be confirmed in linear regression.
Each linear regression and trend line can be turned on and off.
In addition, each linear regression and trend line can arbitrarily modify period values and deviation values.
Log charts and linear chart switches have been added to the trend line.
I hope it will help you with your trading.
-------------------------------------------------------------------------------------------------------------------------------------------------------------------------------------------
[_ParkF] RSI 인덱스가 업그레이드되었습니다.
기존 기능이었던 캔들, 라인, 다이버전스, 다이버전스 라인의 디스플레이 기능은 그대로 유지됐다.
업그레이드로 두 개의 선형 회귀 분석과 두 개의 추세선이 그려집니다.
두 선형 회귀 값은 서로 다르기 때문에 장기 및 단기 선형 회귀의 지지 및 저항을 확인할 수 있습니다.
두 추세선의 주기 값도 다르므로 선형 회귀 분석에서 확인할 수 없었던 지지 및 저항을 확인할 수 있습니다.
각 선형 회귀선 및 추세선은 켜거나 끌 수 있습니다.
또한 각 선형 회귀선 및 추세선은 주기 값과 편차 값을 임의로 수정할 수 있습니다.
로그 차트 및 선형 차트 스위치가 추세선에 추가되었습니다.
당신의 트레이딩에 도움이 되었으면 합니다.
* I would like to express my gratitude to zdmre for revealing the linear regression source.
* I would like to express my gratitude to aaahopper for revealing the trendlines source.
Release Notes
removed divergence lineadded linreg width
added linreg color
added trendlines width
added trendline color
Release Notes
****** A trend lines will be taken based on the wick.Release Notes
The order of the script code has been changed.Release Notes
*** Add ichimoku cloudClouds made of the preceding span 1 and the preceding span 2 of the balance table can predict the trend by displaying the current price balance ahead of the future.
In addition to the role of clouds in the above-described balance sheet , this indicator also shows the cloud band support and resistance of the current RSI value.
Release Notes
Ichimoku period value changeRelease Notes
source code clearRelease Notes
fixedRelease Notes
fixedRelease Notes
fixedRelease Notes
Added MACD HistogramRelease Notes
Added MACD Histogram On / Off Switch Release Notes
Added Multi Time Frame RSI ====> (Yellow Line - 1H) / (Orange Line - 4H) / (Red Line - 1D) and MTF_RSI On / Off Switch
Release Notes
fixedRelease Notes
Added TSI Hisogram & HIstogram On / Off switchyou can choose between MACD and TSI Histogram
Release Notes
Fixed the issue where the candle was obscured by the mtf line.Release Notes
Added Divergence AlertTo remove a divergence alert label, remove the label from the plot.
Release Notes
Added rsi 90 and 10 lineRelease Notes
fixed AlertRelease Notes
Alert name fixedRelease Notes
Linear regression, which was missing during the last revision process, was added again.Open-source script
In true TradingView spirit, the creator of this script has made it open-source, so that traders can review and verify its functionality. Kudos to the author! While you can use it for free, remember that republishing the code is subject to our House Rules.
Disclaimer
The information and publications are not meant to be, and do not constitute, financial, investment, trading, or other types of advice or recommendations supplied or endorsed by TradingView. Read more in the Terms of Use.
Open-source script
In true TradingView spirit, the creator of this script has made it open-source, so that traders can review and verify its functionality. Kudos to the author! While you can use it for free, remember that republishing the code is subject to our House Rules.
Disclaimer
The information and publications are not meant to be, and do not constitute, financial, investment, trading, or other types of advice or recommendations supplied or endorsed by TradingView. Read more in the Terms of Use.