OPEN-SOURCE SCRIPT
Treasury Yield Spread 10y-2y [TXMC]
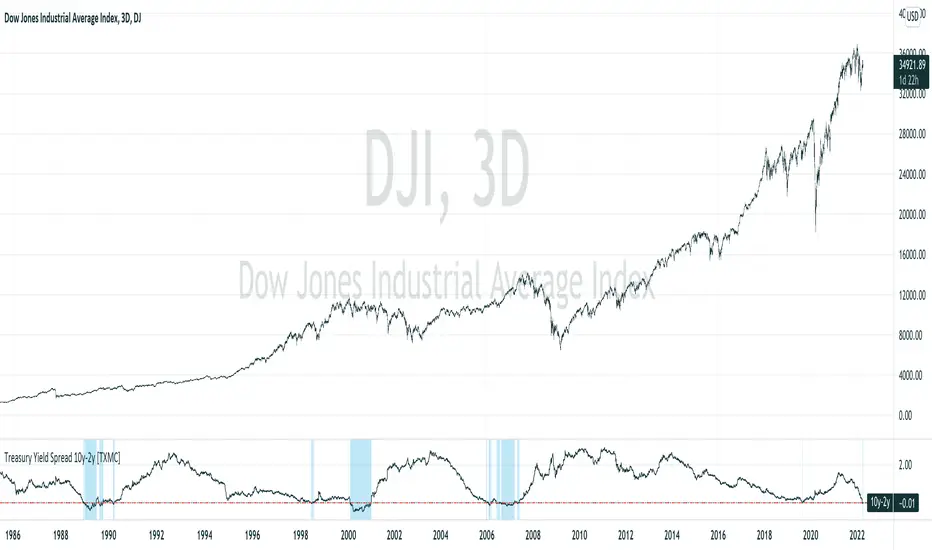
A simple indicator to show inversions of the US Treasury yield curve, specifically between the 2yr and 10yr yields.
A colored band prints when the 2yr treasury yield surpasses the 10yr, indicating an inversion of the yield curve.
This indicator is for educational purposes only.
A colored band prints when the 2yr treasury yield surpasses the 10yr, indicating an inversion of the yield curve.
This indicator is for educational purposes only.
Open-source script
In true TradingView spirit, the creator of this script has made it open-source, so that traders can review and verify its functionality. Kudos to the author! While you can use it for free, remember that republishing the code is subject to our House Rules.
Disclaimer
The information and publications are not meant to be, and do not constitute, financial, investment, trading, or other types of advice or recommendations supplied or endorsed by TradingView. Read more in the Terms of Use.