OPEN-SOURCE SCRIPT
Williams %R Indicator
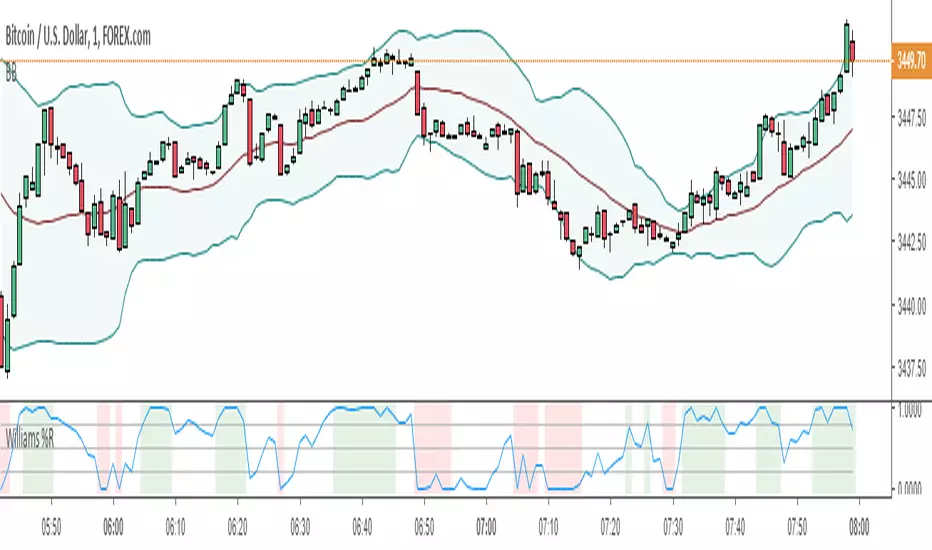
Developed by Larry Williams, Williams %R is a momentum indicator much like the Stochastic Oscillator and is especially popular
for measuring overbought and oversold levels. The scale ranges from 0 to -100 with readings from 0 to -20 considered overbought,
and readings from -80 to -100 considered oversold. Typically, Williams %R is calculated using 14 periods and can be used on intraday,
daily, weekly or monthly data.
This implementation is enhanced with CCI in the form of background colors as a confirming signal and an indication of a prevailing trend.
Open-source script
In true TradingView spirit, the creator of this script has made it open-source, so that traders can review and verify its functionality. Kudos to the author! While you can use it for free, remember that republishing the code is subject to our House Rules.
Disclaimer
The information and publications are not meant to be, and do not constitute, financial, investment, trading, or other types of advice or recommendations supplied or endorsed by TradingView. Read more in the Terms of Use.