OPEN-SOURCE SCRIPT
9:45am NIFTY TRADING
Time Frame: 15 Minutes | Reference Candle Time: 9:45 AM IST | Valid Trading Window: 3 Hours
📌 Introduction
This document outlines a structured trading strategy for NIFTY & BANKNIFTY Options based on a 15-minute timeframe with a 9:45 AM IST reference candle. The strategy incorporates technical indicators, probability analysis, and strict trading rules to optimize entries and exits.
📊 Core Features
1. Reference Time Trading System
9:45 AM IST Candle acts as the reference for the day.
All signals (Buy/Sell/Reversal) are generated based on price action relative to this candle.
The valid trading window is 3 hours after the reference candle.
2. Signal Generation Logic
Signal Condition
Buy (B) Price breaks above reference candle high with confirmation
Sell (S) Price breaks below reference candle low with confirmation
Reversal (R) Early trend reversal signal (requires strict confirmation)
3. Probability Analysis System
The strategy calculates Win Probability (%) using 4 components:
Component Weight Calculation
Body Win Probability 30% Based on candle body strength (body % of total range)
Volume Win Probability 30% Current volume vs. average volume strength
Trend Win Probability 40% EMA crossover + RSI momentum alignment
Composite Probability - Weighted average of all 3 components
Probability Color Coding:
🟢 Green (High Probability): ≥70%
🟠 Orange (Medium Probability): 50-69%
🔴 Red (Low Probability): <50%
4. Timeframe Enforcement
Strictly 15-minute charts only (no other timeframes allowed).
System auto-disables signals if the wrong timeframe is selected.
📈 Technical Analysis Components
1. EMA System (Trend Analysis)
Short EMA (9) – Fast trend indicator
Middle EMA (20) – Intermediate trend
Long EMA (50) – Long-term trend confirmation
Rules:
Buy Signal: Price > 9 EMA > 20 EMA > 50 EMA (Bullish trend)
Sell Signal: Price < 9 EMA < 20 EMA < 50 EMA (Bearish trend)
2. Multi-Timeframe RSI (Momentum)
5M, 15M, 1H, 4H, Daily RSI values are compared for divergence/confluence.
Overbought (≥70) / Oversold (≤30) conditions help in reversal signals.
3. Volume Analysis
Volume Strength (%) = (Current Volume / Avg. Volume) × 100
Strong Volume (>120% Avg.) confirms breakout/breakdown.
4. Body Percentage (Candle Strength)
Body % = (Close - Open) / (High - Low) × 100
Strong Bullish Candle: Body > 60%
Strong Bearish Candle: Body < 40%
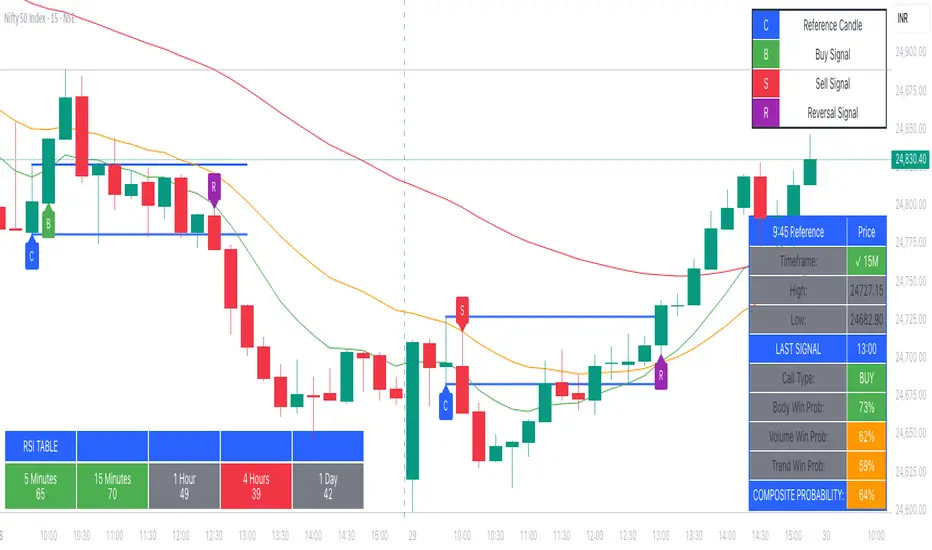
📊 Visual Elements
1. Information Tables
Reference Data Table (9:45 AM Candle High/Low/Close)
RSI Values Table (5M, 15M, 1H, 4H, Daily)
Signal Legend (Buy/Sell/Reversal indicators)
2. Chart Overlays
Reference Lines (9:45 AM High & Low)
EMA Lines (9, 20, 50)
Signal Labels (B, S, R)
3. Color Coding
High Probability (Green)
Medium Probability (Orange)
Low Probability (Red)
⚠️ Important Usage Guidelines
✅ Best Practices:
Trade only within the 3-hour window (9:45 AM - 12:45 PM IST).
Wait for confirmation (closing above/below reference candle).
Use probability score to filter high-confidence trades.
❌ Avoid:
Trading outside the 15-minute timeframe.
Ignoring volume & RSI divergence.
Overtrading – Stick to 1-2 high-probability setups per day.
🎯 Conclusion
This NIFTY Trading Strategy is optimized for 15-minute charts with a 9:45 AM IST reference candle. It combines EMA trends, RSI momentum, volume analysis, and probability scoring to generate high-confidence signals.
🚀 Key Takeaways:
✔ Reference candle defines the day’s bias.
✔ Probability system filters best trades.
✔ Strict 15M timeframe ensures consistency.
Happy Trading! 📈💰
📌 Introduction
This document outlines a structured trading strategy for NIFTY & BANKNIFTY Options based on a 15-minute timeframe with a 9:45 AM IST reference candle. The strategy incorporates technical indicators, probability analysis, and strict trading rules to optimize entries and exits.
📊 Core Features
1. Reference Time Trading System
9:45 AM IST Candle acts as the reference for the day.
All signals (Buy/Sell/Reversal) are generated based on price action relative to this candle.
The valid trading window is 3 hours after the reference candle.
2. Signal Generation Logic
Signal Condition
Buy (B) Price breaks above reference candle high with confirmation
Sell (S) Price breaks below reference candle low with confirmation
Reversal (R) Early trend reversal signal (requires strict confirmation)
3. Probability Analysis System
The strategy calculates Win Probability (%) using 4 components:
Component Weight Calculation
Body Win Probability 30% Based on candle body strength (body % of total range)
Volume Win Probability 30% Current volume vs. average volume strength
Trend Win Probability 40% EMA crossover + RSI momentum alignment
Composite Probability - Weighted average of all 3 components
Probability Color Coding:
🟢 Green (High Probability): ≥70%
🟠 Orange (Medium Probability): 50-69%
🔴 Red (Low Probability): <50%
4. Timeframe Enforcement
Strictly 15-minute charts only (no other timeframes allowed).
System auto-disables signals if the wrong timeframe is selected.
📈 Technical Analysis Components
1. EMA System (Trend Analysis)
Short EMA (9) – Fast trend indicator
Middle EMA (20) – Intermediate trend
Long EMA (50) – Long-term trend confirmation
Rules:
Buy Signal: Price > 9 EMA > 20 EMA > 50 EMA (Bullish trend)
Sell Signal: Price < 9 EMA < 20 EMA < 50 EMA (Bearish trend)
2. Multi-Timeframe RSI (Momentum)
5M, 15M, 1H, 4H, Daily RSI values are compared for divergence/confluence.
Overbought (≥70) / Oversold (≤30) conditions help in reversal signals.
3. Volume Analysis
Volume Strength (%) = (Current Volume / Avg. Volume) × 100
Strong Volume (>120% Avg.) confirms breakout/breakdown.
4. Body Percentage (Candle Strength)
Body % = (Close - Open) / (High - Low) × 100
Strong Bullish Candle: Body > 60%
Strong Bearish Candle: Body < 40%
📊 Visual Elements
1. Information Tables
Reference Data Table (9:45 AM Candle High/Low/Close)
RSI Values Table (5M, 15M, 1H, 4H, Daily)
Signal Legend (Buy/Sell/Reversal indicators)
2. Chart Overlays
Reference Lines (9:45 AM High & Low)
EMA Lines (9, 20, 50)
Signal Labels (B, S, R)
3. Color Coding
High Probability (Green)
Medium Probability (Orange)
Low Probability (Red)
⚠️ Important Usage Guidelines
✅ Best Practices:
Trade only within the 3-hour window (9:45 AM - 12:45 PM IST).
Wait for confirmation (closing above/below reference candle).
Use probability score to filter high-confidence trades.
❌ Avoid:
Trading outside the 15-minute timeframe.
Ignoring volume & RSI divergence.
Overtrading – Stick to 1-2 high-probability setups per day.
🎯 Conclusion
This NIFTY Trading Strategy is optimized for 15-minute charts with a 9:45 AM IST reference candle. It combines EMA trends, RSI momentum, volume analysis, and probability scoring to generate high-confidence signals.
🚀 Key Takeaways:
✔ Reference candle defines the day’s bias.
✔ Probability system filters best trades.
✔ Strict 15M timeframe ensures consistency.
Happy Trading! 📈💰
Open-source script
In true TradingView spirit, the creator of this script has made it open-source, so that traders can review and verify its functionality. Kudos to the author! While you can use it for free, remember that republishing the code is subject to our House Rules.
Disclaimer
The information and publications are not meant to be, and do not constitute, financial, investment, trading, or other types of advice or recommendations supplied or endorsed by TradingView. Read more in the Terms of Use.