OPEN-SOURCE SCRIPT
PSS Divergence RSI
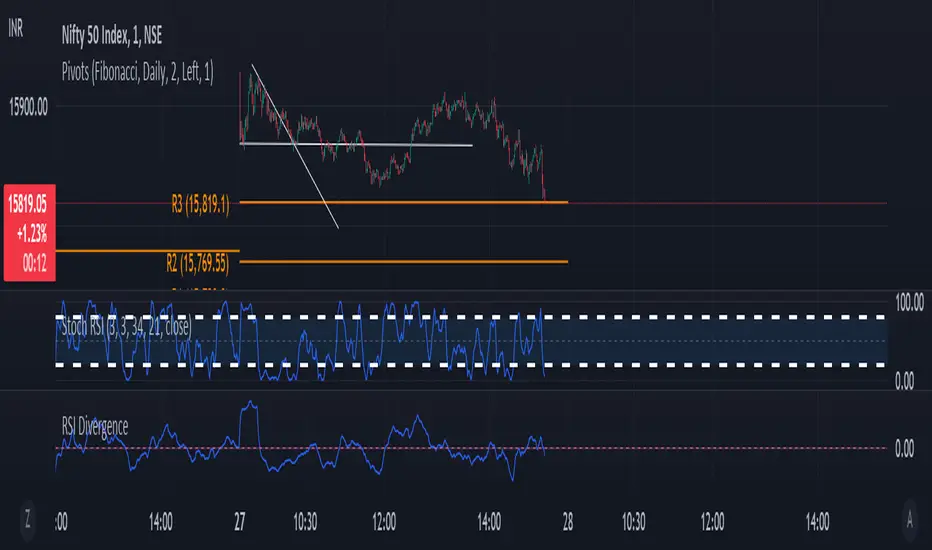
The objective of the script is to identify the divergences (positive / negative) and visualize them as an indicator to easily spot the possible trend change.
Ingredients -
a. 34 period RSI at current candle
b. 34 period RSI at 21 candles back
c. 5 EMA of a
d. 5 EMA of b
e. 5 EMA of current candle
f. 5 EMA of 21 candles back
Description -
The indicator is designed for scalping and to smooth-out the noise in shorter timeframe (1 min), bigger period (34) is used for RSI calculation.
The core idea of divergence is to look at RSI movement in relation to price movement, hence a ratios are created for RSI value relative to it's price.
R1 = rsiMA1*100/priceMA1
R2 = rsiMA2*100/priceMA2
Some mathematics is applied over the calculated ratios to determine if there is bullish or bearish divergence -
Div = (R1-R2)*100/(R1+R2)
The reasoning to apply 5 EMA to price as well as RSI is to compare areas (5 candles) instead of single point comparison for better insights.
The value above zero line is considered positive divergence and below zero line is negative divergence.
Recommended to combine with Pivot Points, Fibonacci or Gann levels as confirmation to enter the trade.
Reviews / feedbacks are most welcome !
Prasad Shenwai
prasad.s.shenwai@gmail.com
Open-source script
In true TradingView spirit, the creator of this script has made it open-source, so that traders can review and verify its functionality. Kudos to the author! While you can use it for free, remember that republishing the code is subject to our House Rules.
Disclaimer
The information and publications are not meant to be, and do not constitute, financial, investment, trading, or other types of advice or recommendations supplied or endorsed by TradingView. Read more in the Terms of Use.