OPEN-SOURCE SCRIPT
VWAP & Breakout Volume Confirm
How the TradingView Indicator Works (Explained Simply)
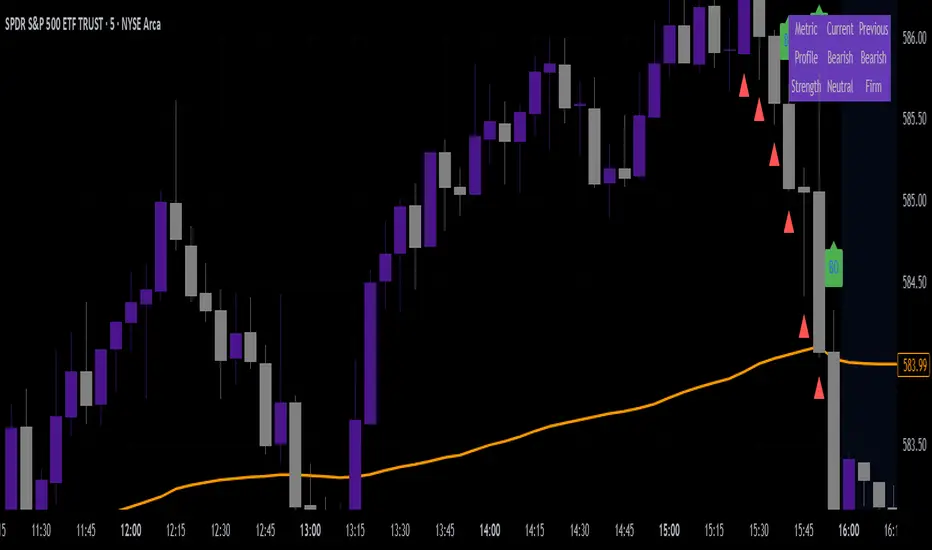
VWAP Line (Orange)
It plots the Volume Weighted Average Price for the day.
Price above VWAP = bullish zone
Price below VWAP = bearish zone
Volume Spike Detection (Red Triangle)
It calculates the average volume over the last 20 candles.
If the current volume is 1.5× that average, it plots a red triangle under the candle.
Helps confirm if a move has real momentum or not.
Breakout Confirmation (Green Label ‘BO’)
Checks if price breaks above the last 10-bar high (for upside breakout) or below the last 10-bar low (for downside breakout).
If a breakout happens and the volume spike is present, it plots a green “BO” label above the candle.
This tells you the breakout is strong and likely to follow through.
Open-source script
In true TradingView spirit, the creator of this script has made it open-source, so that traders can review and verify its functionality. Kudos to the author! While you can use it for free, remember that republishing the code is subject to our House Rules.
Disclaimer
The information and publications are not meant to be, and do not constitute, financial, investment, trading, or other types of advice or recommendations supplied or endorsed by TradingView. Read more in the Terms of Use.