OPEN-SOURCE SCRIPT
Candlesticks Not Touching EMA 3 & EMA 5 Scanner
Candlesticks Not Touching EMA 3 & EMA 5 Scanner
Short Title: EMA Scanner
Overview
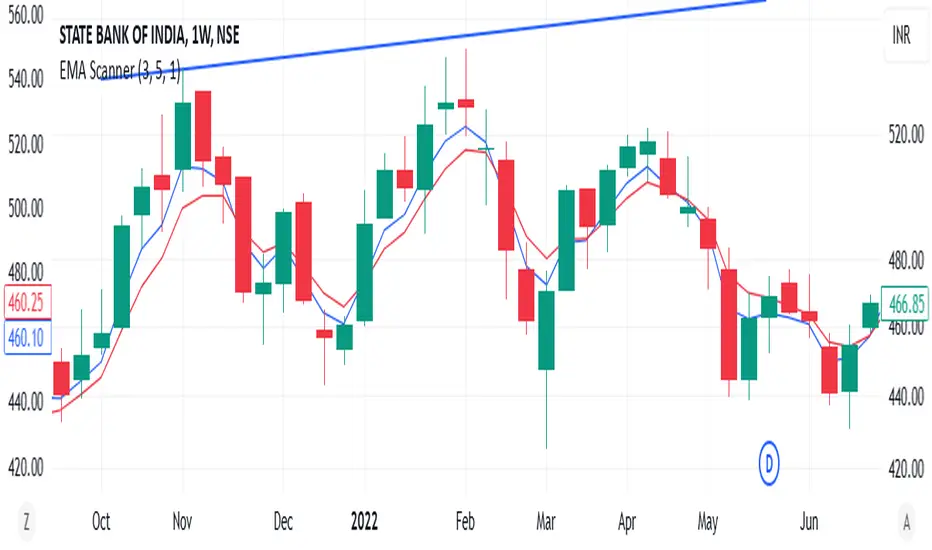
This indicator scans for candlesticks that do not touch the EMA 3 and EMA 5, highlighting potential trading opportunities where price action is significantly distanced from these moving averages. It identifies momentum-based entries and helps traders spot strong trends.
How It Works
It checks if the candle's high and low are completely above or below both EMAs (3 & 5).
It ensures that the distance between the candle and EMA 5 is at least a user-defined multiple of the candle range.
When a valid candle is detected, a triangle marker appears below (for long trades) or above (for short trades).
Trade Execution Strategy
Entry:
Long Entry → Break of the candle’s high
Short Entry → Break of the candle’s low
Stop Loss:
Long SL → Low of the same candle
Short SL → High of the same candle
Target: EMA 5
Additional Features
✅ Plots EMA 3 (Blue) and EMA 5 (Red) for reference
✅ Marks potential long and short trades with arrows
✅ Detects & plots when Target or Stop Loss is hit
✅ Alerts for valid signals, target hits, and stop loss hits
Best Use Cases
🔹 Suitable for intraday & swing traders looking for momentum-based trades
🔹 Works well in trending markets
🔹 Helps identify mean-reversion & breakout opportunities
🚀 Use this indicator to refine your trading setups & boost your market edge! 🚀
Short Title: EMA Scanner
Overview
This indicator scans for candlesticks that do not touch the EMA 3 and EMA 5, highlighting potential trading opportunities where price action is significantly distanced from these moving averages. It identifies momentum-based entries and helps traders spot strong trends.
How It Works
It checks if the candle's high and low are completely above or below both EMAs (3 & 5).
It ensures that the distance between the candle and EMA 5 is at least a user-defined multiple of the candle range.
When a valid candle is detected, a triangle marker appears below (for long trades) or above (for short trades).
Trade Execution Strategy
Entry:
Long Entry → Break of the candle’s high
Short Entry → Break of the candle’s low
Stop Loss:
Long SL → Low of the same candle
Short SL → High of the same candle
Target: EMA 5
Additional Features
✅ Plots EMA 3 (Blue) and EMA 5 (Red) for reference
✅ Marks potential long and short trades with arrows
✅ Detects & plots when Target or Stop Loss is hit
✅ Alerts for valid signals, target hits, and stop loss hits
Best Use Cases
🔹 Suitable for intraday & swing traders looking for momentum-based trades
🔹 Works well in trending markets
🔹 Helps identify mean-reversion & breakout opportunities
🚀 Use this indicator to refine your trading setups & boost your market edge! 🚀
Open-source script
In true TradingView spirit, the creator of this script has made it open-source, so that traders can review and verify its functionality. Kudos to the author! While you can use it for free, remember that republishing the code is subject to our House Rules.
Disclaimer
The information and publications are not meant to be, and do not constitute, financial, investment, trading, or other types of advice or recommendations supplied or endorsed by TradingView. Read more in the Terms of Use.