OPEN-SOURCE SCRIPT
TEMA with Slope Color [MrBuCha]
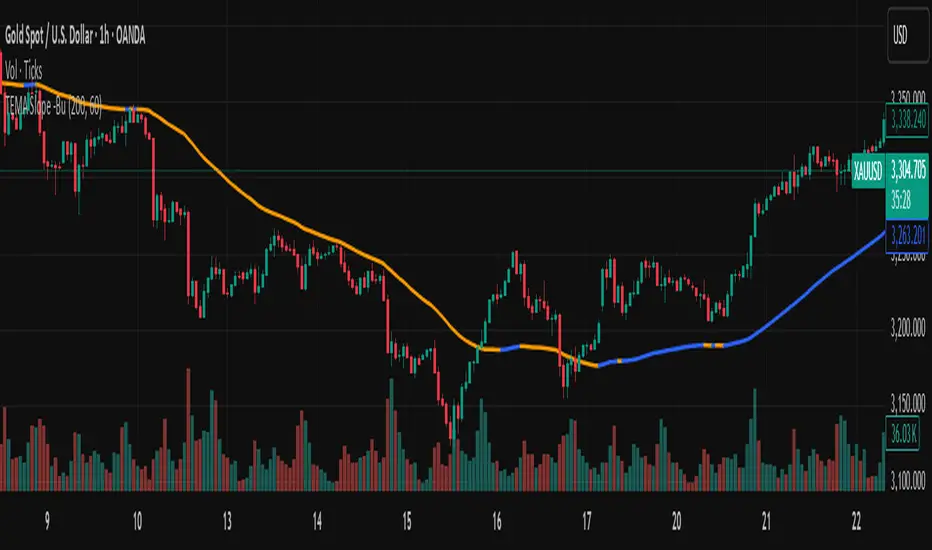
This TEMA indicator is particularly useful for trend following strategies. The key innovation here is using a higher timeframe (default 1-hour) to get a broader perspective on the trend direction, while the color-coding makes it immediately obvious whether the momentum is bullish (blue) or bearish (orange).
The 200-period length makes this more suitable for swing trading rather than day trading, as it filters out short-term noise and focuses on significant trend movements.
//
What is TEMA and How Does It Work?
TEMA (Triple Exponential Moving Average) is a technical indicator that builds upon the standard EMA to reduce lag and provide faster response to price changes. The calculation process is:
EMA1 = EMA of closing price with specified length
EMA2 = EMA of EMA1 with the same length
EMA3 = EMA of EMA2 with the same length
TEMA = 3 × (EMA1 - EMA2) + EMA3
This formula helps reduce the lag inherent in smoothing calculations, making TEMA more responsive to price movements compared to other moving averages.
Default Values
Length: 200 periods
Timeframe: "60" (1 hour)
Slope Colors
Blue: When TEMA is trending upward (tema_current > tema_previous)
Orange: When TEMA is trending downward (tema_current ≤ tema_previous)
Pros and Cons Summary
Advantages:
Fast Response: Reduces lag better than SMA and regular EMA
Easy to Use: Color-coded slope makes trend direction immediately visible
Multi-timeframe Capability: Can display TEMA from higher timeframes
Trend Following: Excellent for identifying trend direction
Visual Clarity: Clear color signals help with quick decision making
Disadvantages:
False Signals: Prone to whipsaws in sideways/choppy markets
Noise in Volatility: Frequent color changes during high volatility periods
Not Suitable for Scalping: Length of 200 is quite long for short-term trading
Still Lagging: Despite improvements, it remains a lagging indicator
Requires Confirmation: Should be used with other indicators for better accuracy
Best Use Cases:
Medium to long-term trend following
Identifying major trend changes
Multi-timeframe analysis
Combine with momentum oscillators for confirmation
Trading Tips:
Wait for color confirmation before entering trades
Use higher timeframe TEMA for overall trend bias
Combine with support/resistance levels
Avoid trading during consolidation periods
Open-source script
In true TradingView spirit, the creator of this script has made it open-source, so that traders can review and verify its functionality. Kudos to the author! While you can use it for free, remember that republishing the code is subject to our House Rules.
Disclaimer
The information and publications are not meant to be, and do not constitute, financial, investment, trading, or other types of advice or recommendations supplied or endorsed by TradingView. Read more in the Terms of Use.