OPEN-SOURCE SCRIPT
Updated William %R MTF [DM]
Greeting Colleagues
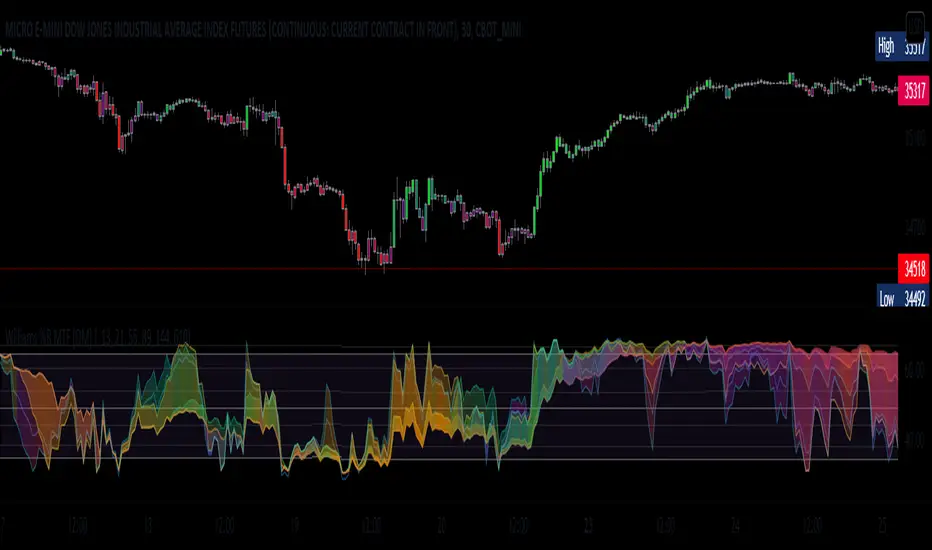
Today I share The Wlliams %R
Extras=
- 5 diferent length
- 1 extra signal with the technique used in the ultimate oscillator
- Fibo Leves based on ob os leves "width it's automatic"
- Colored bars bassed en average strength
- The indicator that is modified now has the same range as the ultimate oscillator.
Enjoy [;-)
//The Williams %R (%R) indicator was created by famed commodities trader and author Larry Williams.
//
//Calculation
//%R = (CurrentClose - Highest High) / (Highest High - Lowest Low) x -100
//
//Highest High = Highest High for the user defined look-back period.
//Lowest Low = Lowest Low for the user defined look-back period.
//
//The basics
//As previously mentioned, the %R is used to measure momentum. %R oscillates
//within a fixed range between the values of 0 and -100. Williams himself set the
//parameters of overbought as any reading between 0 and -20. His oversold
//parameters were readings between -80 and -100. It is important to note that these
//values are traditional examples. It may be beneficial for the technical analyst
//to set different parameters based on the specific instrument being analyzed. Wider
//or narrower overbought and oversold levels may be appropriate based on historical analysis.
//
//What to look for
//There are two major conditions identified by using the %R indicator.
//The first is standard overbought and oversold conditions. The second is momentum
//changes characterized by momentum failures.
//
//Overbought/Oversold
//Overbought and Oversold conditions are a very common signal generated by momentum oscillators.
//The %R indicator is no different.
Release Notes
Minor changesRelease Notes
Added butterfly color rules to plotsAdded switch to hide parcels
Release Notes
Minor changesRelease Notes
Added black background for use in the white chartsOpen-source script
In true TradingView spirit, the creator of this script has made it open-source, so that traders can review and verify its functionality. Kudos to the author! While you can use it for free, remember that republishing the code is subject to our House Rules.
Disclaimer
The information and publications are not meant to be, and do not constitute, financial, investment, trading, or other types of advice or recommendations supplied or endorsed by TradingView. Read more in the Terms of Use.
Open-source script
In true TradingView spirit, the creator of this script has made it open-source, so that traders can review and verify its functionality. Kudos to the author! While you can use it for free, remember that republishing the code is subject to our House Rules.
Disclaimer
The information and publications are not meant to be, and do not constitute, financial, investment, trading, or other types of advice or recommendations supplied or endorsed by TradingView. Read more in the Terms of Use.