OPEN-SOURCE SCRIPT
Updated SL - 4 EMAs, 2 SMAs & Crossover Signals
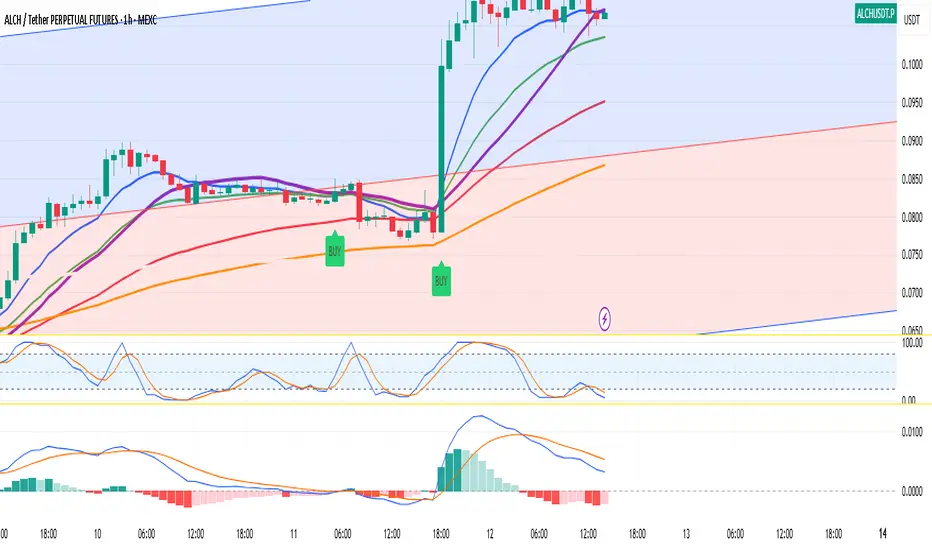
This TradingView Pine Script code is built for day traders, especially those trading crypto on a 1‑hour chart. In simple words, the script does the following:
Calculates Moving Averages:
It computes four exponential moving averages (EMAs) and two simple moving averages (SMAs) based on the closing price (or any price you select). Each moving average uses a different time period that you can adjust.
Plots Them on Your Chart:
The EMAs and SMAs are drawn on your chart in different colors and line thicknesses. This helps you quickly see the short-term and long-term trends.
Generates Buy and Sell Signals:
Buy Signal: When the fastest EMA (for example, a 10-period EMA) crosses above a slightly slower EMA (like a 21-period EMA) and the four EMAs are in a bullish order (meaning the fastest is above the next ones), the script will show a "BUY" label on the chart.
Sell Signal: When the fastest EMA crosses below the second fastest EMA and the four EMAs are lined up in a bearish order (the fastest is below the others), it displays a "SELL" label.
In essence, the code is designed to help you spot potential entry and exit points based on the relationships between multiple moving averages, which work as trend indicators. This makes it easier to decide when to trade on your 1‑hour crypto chart.
Release Notes
update v2Open-source script
In true TradingView spirit, the creator of this script has made it open-source, so that traders can review and verify its functionality. Kudos to the author! While you can use it for free, remember that republishing the code is subject to our House Rules.
Disclaimer
The information and publications are not meant to be, and do not constitute, financial, investment, trading, or other types of advice or recommendations supplied or endorsed by TradingView. Read more in the Terms of Use.
Open-source script
In true TradingView spirit, the creator of this script has made it open-source, so that traders can review and verify its functionality. Kudos to the author! While you can use it for free, remember that republishing the code is subject to our House Rules.
Disclaimer
The information and publications are not meant to be, and do not constitute, financial, investment, trading, or other types of advice or recommendations supplied or endorsed by TradingView. Read more in the Terms of Use.