OPEN-SOURCE SCRIPT
Fib Cross Moving Averages
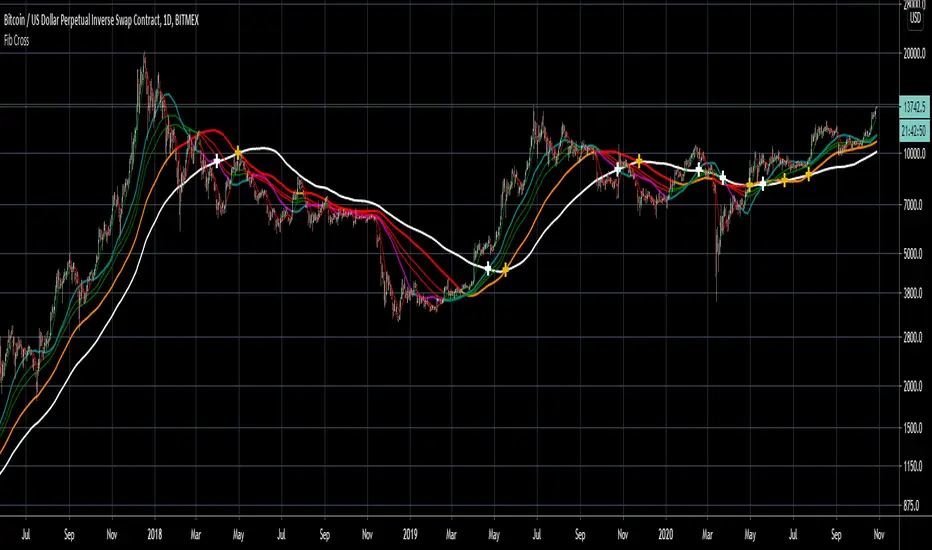
The white line is the main 200-candle MA. The fibonacci ratio MAs are relative to that 200-day MA. Some lines change color based on the trend shown by this indicator.
So 61.8% for example, the orange/red line golden ratio MA is a 124 candle MA (~68% of 200). There is also a weighted 124 candle MA that works along-side the 100 candle MA.
So 61.8% for example, the orange/red line golden ratio MA is a 124 candle MA (~68% of 200). There is also a weighted 124 candle MA that works along-side the 100 candle MA.
Open-source script
In true TradingView spirit, the creator of this script has made it open-source, so that traders can review and verify its functionality. Kudos to the author! While you can use it for free, remember that republishing the code is subject to our House Rules.
Disclaimer
The information and publications are not meant to be, and do not constitute, financial, investment, trading, or other types of advice or recommendations supplied or endorsed by TradingView. Read more in the Terms of Use.