OPEN-SOURCE SCRIPT
Custom Daily % Levels Table
📘 Indicator Description
"Custom Daily % Levels – table" is a dynamic and customizable tool designed to help traders visualize daily percentage-based price ranges and key metrics in a compact, table-style format.
🧩 Key Features:
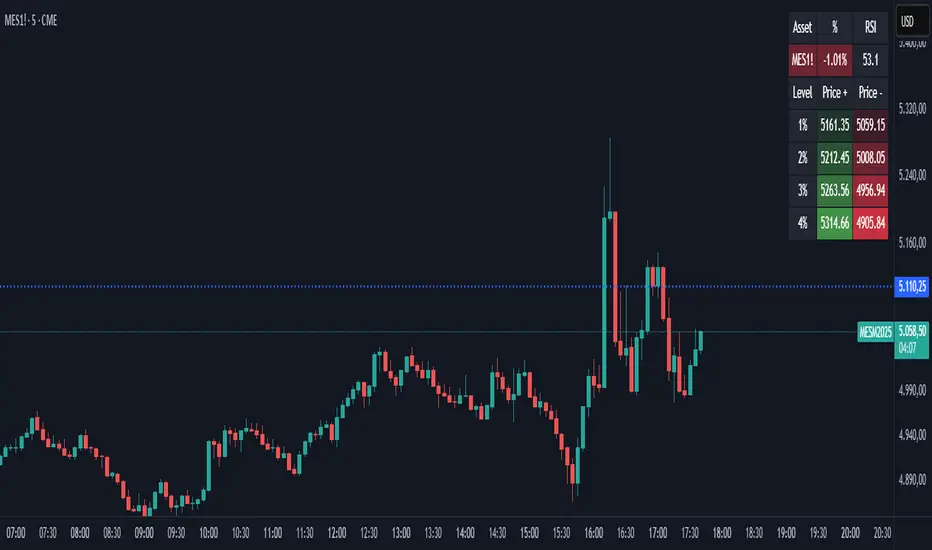
📐 Custom Percent Levels: Automatically calculates upper and lower price levels based on a user-defined base percentage and number of levels, relative to the previous daily close.
🟢🔴 Color Gradient Highlighting: Positive levels are shown with a green gradient, negative levels with red, and the level labels with a neutral tone for easy reference.
📊 Live Asset Info: Displays the current symbol, percentage change from the previous daily close, and 14-period RSI, all color-coded for quick interpretation.
⚙️ Header Control: Toggle the visibility of the main info headers and level headers independently.
📌 Position Customization: Choose where the table appears on your chart (top/bottom, left/right, center).
📈 Clean Layout: Makes it easy to visually track price movement relative to daily expected ranges.
This indicator is especially useful for intraday traders, scalpers, or anyone needing a clear visual of short-term price expansion and contraction based on predefined volatility zones.
"Custom Daily % Levels – table" is a dynamic and customizable tool designed to help traders visualize daily percentage-based price ranges and key metrics in a compact, table-style format.
🧩 Key Features:
📐 Custom Percent Levels: Automatically calculates upper and lower price levels based on a user-defined base percentage and number of levels, relative to the previous daily close.
🟢🔴 Color Gradient Highlighting: Positive levels are shown with a green gradient, negative levels with red, and the level labels with a neutral tone for easy reference.
📊 Live Asset Info: Displays the current symbol, percentage change from the previous daily close, and 14-period RSI, all color-coded for quick interpretation.
⚙️ Header Control: Toggle the visibility of the main info headers and level headers independently.
📌 Position Customization: Choose where the table appears on your chart (top/bottom, left/right, center).
📈 Clean Layout: Makes it easy to visually track price movement relative to daily expected ranges.
This indicator is especially useful for intraday traders, scalpers, or anyone needing a clear visual of short-term price expansion and contraction based on predefined volatility zones.
Open-source script
In true TradingView spirit, the creator of this script has made it open-source, so that traders can review and verify its functionality. Kudos to the author! While you can use it for free, remember that republishing the code is subject to our House Rules.
Disclaimer
The information and publications are not meant to be, and do not constitute, financial, investment, trading, or other types of advice or recommendations supplied or endorsed by TradingView. Read more in the Terms of Use.