OPEN-SOURCE SCRIPT
MACD trend heatmap (by ChartArt)
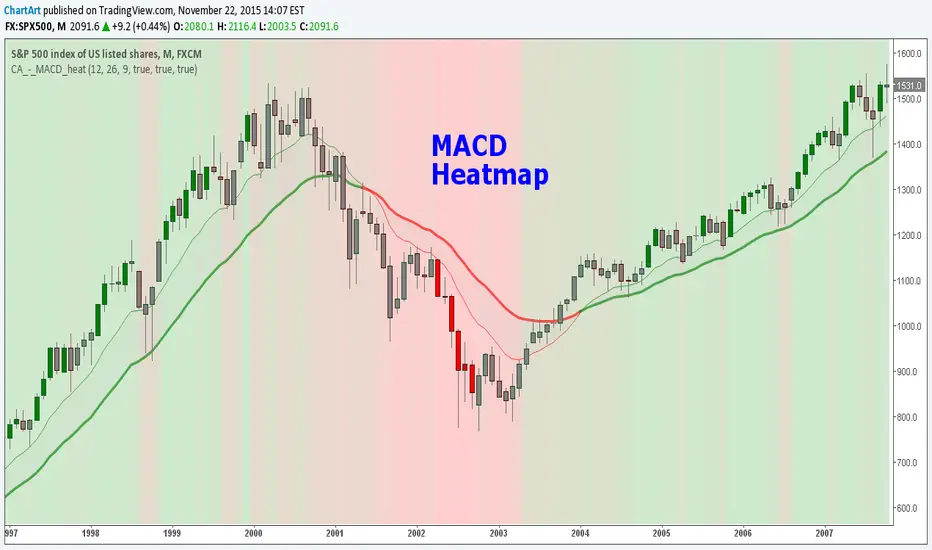
This is an overlay indicator which uses the classic period settings and signals from the MACD (Moving Average Convergence/Divergence) indicator to overlay a heatmap using all the information the MACD generates with its three periods (12,26,9).
The first two moving averages which the MACD uses (12 and 26) can be plotted on the chart like usual EMAs.
In addition to the background color function (the heatmap) and the EMAs, there is an optional bar color alert when the uptrend or the downtrend as measured by the MACD appears to be very strong.
Open-source script
In true TradingView spirit, the creator of this script has made it open-source, so that traders can review and verify its functionality. Kudos to the author! While you can use it for free, remember that republishing the code is subject to our House Rules.
Disclaimer
The information and publications are not meant to be, and do not constitute, financial, investment, trading, or other types of advice or recommendations supplied or endorsed by TradingView. Read more in the Terms of Use.