OPEN-SOURCE SCRIPT
COV Bands ~ C H I P A
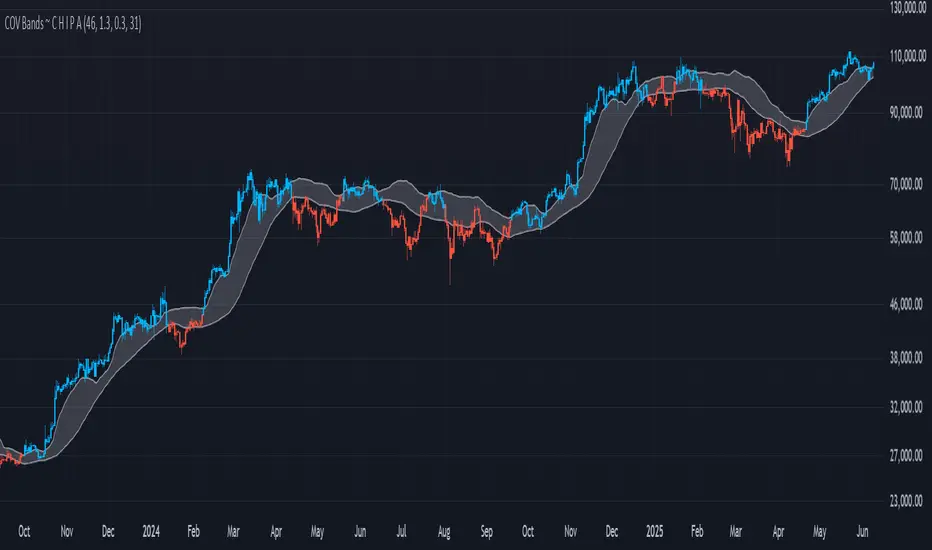
COV Bands ~ C H I P A is a custom volatility and trend identification tool designed to capture directional shifts using the Coefficient of Variation (COV), calculated from standard deviation relative to a mean price baseline.
Key features include:
A configurable SMA-based mean baseline to anchor volatility measurements clearly.
Adjustable upper and lower band multipliers to independently calibrate sensitivity and responsiveness for bullish or bearish breakouts.
Dynamic bands derived from price-relative volatility (COV), enabling adaptive identification of significant price deviations.
User-controlled standard deviation length to manage sensitivity and smoothness of volatility signals.
Direct candle coloring, providing immediate visual feedback using vibrant electric blue for bullish momentum and bright red for bearish momentum.
This indicator is particularly useful for detecting meaningful price movements, breakout signals, and potential reversals when the market moves significantly beyond its typical volatility boundaries.
Note: This indicator has not undergone formal robustness or optimization testing. Therefore, future performance in live trading environments isn't guaranteed.
Open-source script
In true TradingView spirit, the creator of this script has made it open-source, so that traders can review and verify its functionality. Kudos to the author! While you can use it for free, remember that republishing the code is subject to our House Rules.
Disclaimer
The information and publications are not meant to be, and do not constitute, financial, investment, trading, or other types of advice or recommendations supplied or endorsed by TradingView. Read more in the Terms of Use.