OPEN-SOURCE SCRIPT
Stoch Money Flow (ADMF) & Absolute Strength Index (ASI) [cI8DH]
This indicator can apply my previous indicator, Historical and Standard Stochastic, to Money Flow (ADMF) or Absolute Strength Index (ASI) or both at the same time. It can also display those two indicators in regular mode as well as showing visual cues when the indicators make new ATH or ATL.
ASI is basically a new name I am giving to my Gain/Loss Moving Average indicator. If you normalize ASI with the moving average of all the changes in price, it becomes identical to RSI. So ASI is basically non-normalized RSI, that is why it should be a more accurate representation of price momentum.
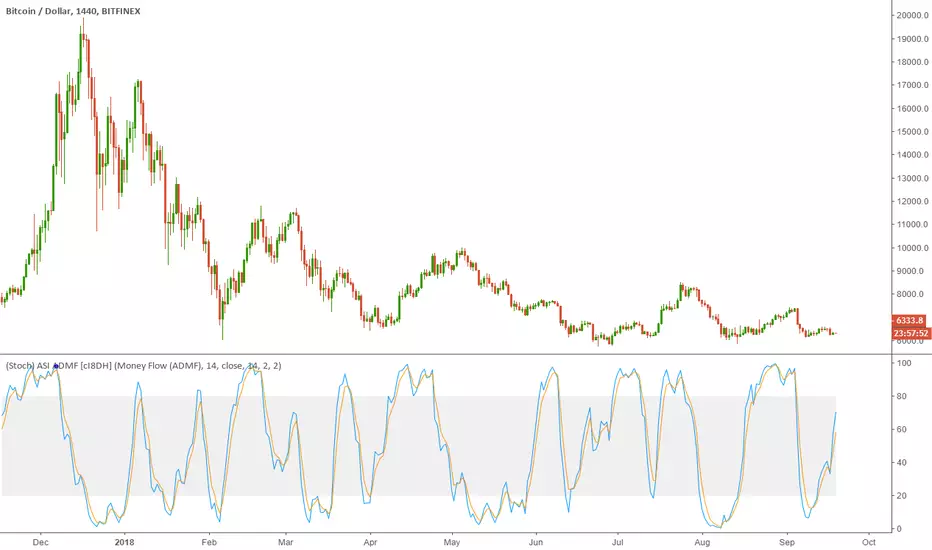
ADMF is an accumulation/distribution and money flow momentum indicator. Both ASI and ADMF are not range-bound so it is not easy to compare them against each other. When stochastic equation is applied to them, they both become range-bound and comparable. The gaps between the two indicator can reveal valuable information about market dynamics. The chart below shows some examples (note the settings).

For conventional usages of stochastic, please read tradingview.com/wiki/Stochastic_(STOCH) and tradingview.com/wiki/Stochastic_RSI_(STOCH_RSI). I recommend you to find the optimal length by playing with the stoch length in the indicator settings. If this parameter is calibrated properly, this indicator can be a powerful tool for identifying market cycle.
You can get these features (ATH, ATL detection and historical stochastic) for any other indicator using the script below:
![Historical Stochatic (HS) [cI8DH]](https://tradingview.sweetlogin.com/proxy-s3/d/dMdLQCW0_mid.png)
ASI is basically a new name I am giving to my Gain/Loss Moving Average indicator. If you normalize ASI with the moving average of all the changes in price, it becomes identical to RSI. So ASI is basically non-normalized RSI, that is why it should be a more accurate representation of price momentum.
ADMF is an accumulation/distribution and money flow momentum indicator. Both ASI and ADMF are not range-bound so it is not easy to compare them against each other. When stochastic equation is applied to them, they both become range-bound and comparable. The gaps between the two indicator can reveal valuable information about market dynamics. The chart below shows some examples (note the settings).
For conventional usages of stochastic, please read tradingview.com/wiki/Stochastic_(STOCH) and tradingview.com/wiki/Stochastic_RSI_(STOCH_RSI). I recommend you to find the optimal length by playing with the stoch length in the indicator settings. If this parameter is calibrated properly, this indicator can be a powerful tool for identifying market cycle.
You can get these features (ATH, ATL detection and historical stochastic) for any other indicator using the script below:
Open-source script
In true TradingView spirit, the creator of this script has made it open-source, so that traders can review and verify its functionality. Kudos to the author! While you can use it for free, remember that republishing the code is subject to our House Rules.
Disclaimer
The information and publications are not meant to be, and do not constitute, financial, investment, trading, or other types of advice or recommendations supplied or endorsed by TradingView. Read more in the Terms of Use.