OPEN-SOURCE SCRIPT
Distance Bands Oscillator_KT
█ OVERVIEW
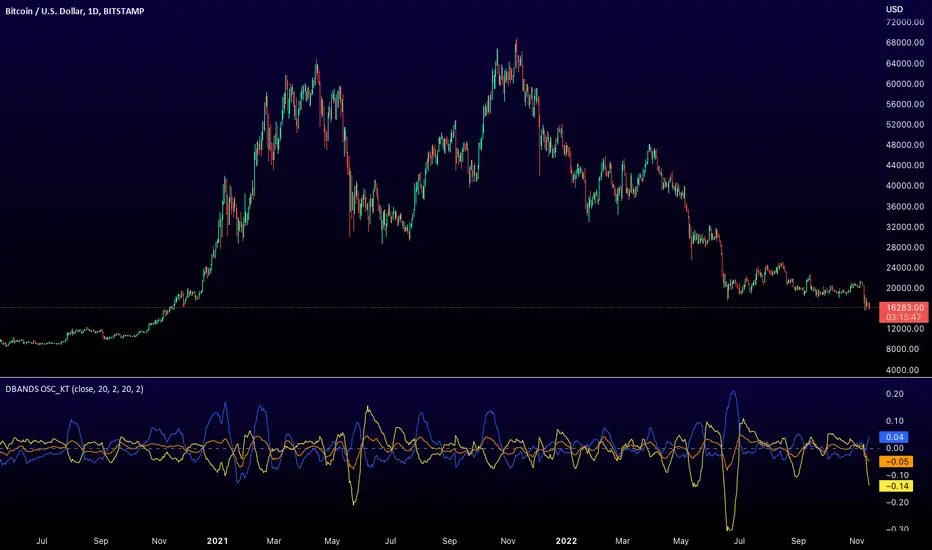
This tool is based on both Bollinger Bands and Keltner Channels, and measures 3 distances between the two, respectively.
Similar to the Band Width indicator, this can be used as a measure of volatility, and can be used to measure uptrend, downtrend and chop regions on a given chart.
Happy Trading,
ET
This tool is based on both Bollinger Bands and Keltner Channels, and measures 3 distances between the two, respectively.
- Upper Kelt to Upper Bollinger Band
- Lower Kelt to Lower Bollinger Band
- Kelt Basis to Bollinger Basis Basis
Similar to the Band Width indicator, this can be used as a measure of volatility, and can be used to measure uptrend, downtrend and chop regions on a given chart.
Happy Trading,
ET
Open-source script
In true TradingView spirit, the creator of this script has made it open-source, so that traders can review and verify its functionality. Kudos to the author! While you can use it for free, remember that republishing the code is subject to our House Rules.
Eric Thies
Disclaimer
The information and publications are not meant to be, and do not constitute, financial, investment, trading, or other types of advice or recommendations supplied or endorsed by TradingView. Read more in the Terms of Use.