OPEN-SOURCE SCRIPT
[GB]Commodity Futures Map
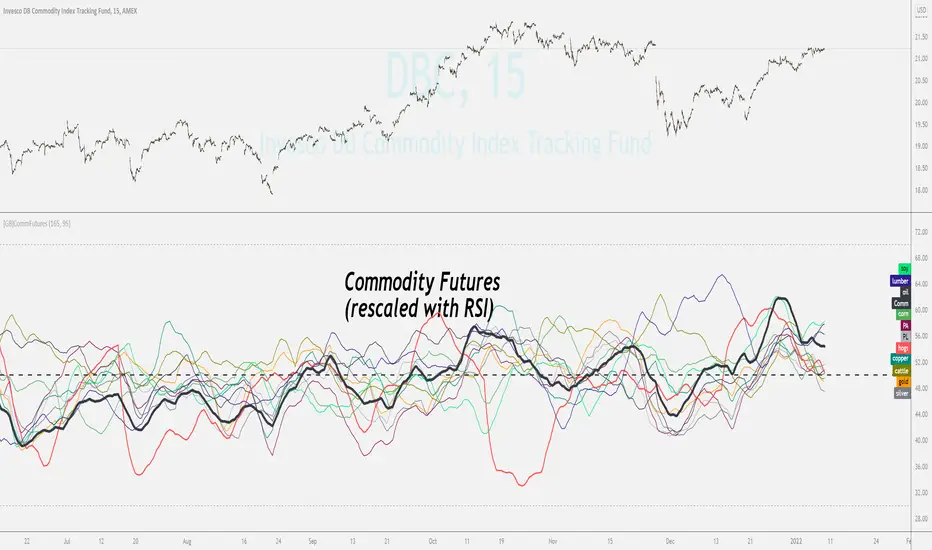
Puts numerous commodity futures on the same scale. The main function is RSI (without evoking "oversold/bought" concepts).
Reading the chart: Much like any oscillator, the important elements are:
Position relative to the middle
*
Settings:
May add value when asking questions like:
Is lumber trending?
Is silver trending faster than gold?
Is the entire asset class trending up down or not at all?
Adding additional symbols is easy since the code for each symbol is identical.
Reading the chart: Much like any oscillator, the important elements are:
Position relative to the middle
- Slope
Momentum
Volatility
*
Settings:
- RSI length
EMA smoothing
Time Frame (of the indicator, not the chart(
May add value when asking questions like:
Is lumber trending?
Is silver trending faster than gold?
Is the entire asset class trending up down or not at all?
Adding additional symbols is easy since the code for each symbol is identical.
Open-source script
In true TradingView spirit, the creator of this script has made it open-source, so that traders can review and verify its functionality. Kudos to the author! While you can use it for free, remember that republishing the code is subject to our House Rules.
Disclaimer
The information and publications are not meant to be, and do not constitute, financial, investment, trading, or other types of advice or recommendations supplied or endorsed by TradingView. Read more in the Terms of Use.