OPEN-SOURCE SCRIPT
EMA Distance Indicator [Eddie_Bitcoin]
🧠 EMA Distance Indicator [Eddie_Bitcoin]
This indicator is a powerful statistical tool designed to provide enhanced context and signal confirmation for traders who want to go beyond price action alone.
🔍 What It Does
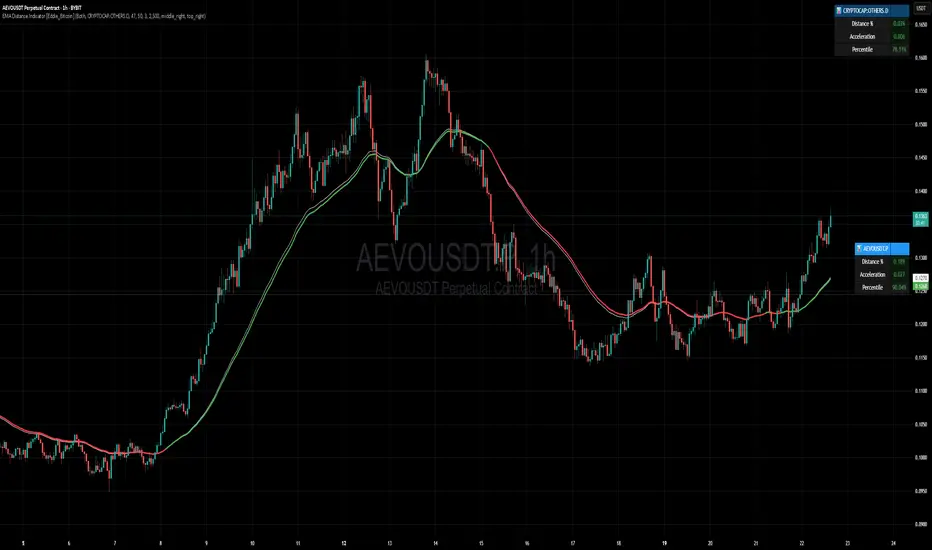
It calculates and visualizes the distance (%) between two EMAs (Fast & Slow) on either the current chart symbol or a selected macro/index reference (e.g., BTC Dominance, TOTAL2, SPX). But it doesn't stop there:
Core Features:
✅ Real-time percentage distance between Fast and Slow EMAs
📈 Slope (acceleration) of the distance to capture trend momentum
🎯 Gaussian-based percentile rank of the current distance over a configurable historical sample
📊 Dynamic table display with intuitive emoji-based cues
🟢 Highlights extreme conditions (e.g., TOP 5% or LOW 5% percentile zones)
🔀 Compare both current asset and a macro/index asset side by side
💡 Display Modes:
Show only current symbol
Show only index/macro symbol
Show both with independently positioned tables
🎯 Ideal Use Case
This is not a standalone strategy, but rather a statistical enhancement module designed to pair with tools like my 👉 “AltCoin Index Correlation” indicator. It gives traders a quick-glance view of strength, divergence, and macro alignment for better timing and confidence.
Whether you’re trading altcoins, tracking dominance charts, or watching indices, this tool offers deep visual insight into EMA-based dynamics — wrapped in a clean, emoji-driven UI.
🛠 Created with ❤️ by Eddie_Bitcoin
🚀 ### Check my profile for other juicy hints and original strategies. ### 🚀
This indicator is a powerful statistical tool designed to provide enhanced context and signal confirmation for traders who want to go beyond price action alone.
🔍 What It Does
It calculates and visualizes the distance (%) between two EMAs (Fast & Slow) on either the current chart symbol or a selected macro/index reference (e.g., BTC Dominance, TOTAL2, SPX). But it doesn't stop there:
Core Features:
✅ Real-time percentage distance between Fast and Slow EMAs
📈 Slope (acceleration) of the distance to capture trend momentum
🎯 Gaussian-based percentile rank of the current distance over a configurable historical sample
📊 Dynamic table display with intuitive emoji-based cues
🟢 Highlights extreme conditions (e.g., TOP 5% or LOW 5% percentile zones)
🔀 Compare both current asset and a macro/index asset side by side
💡 Display Modes:
Show only current symbol
Show only index/macro symbol
Show both with independently positioned tables
🎯 Ideal Use Case
This is not a standalone strategy, but rather a statistical enhancement module designed to pair with tools like my 👉 “AltCoin Index Correlation” indicator. It gives traders a quick-glance view of strength, divergence, and macro alignment for better timing and confidence.
Whether you’re trading altcoins, tracking dominance charts, or watching indices, this tool offers deep visual insight into EMA-based dynamics — wrapped in a clean, emoji-driven UI.
🛠 Created with ❤️ by Eddie_Bitcoin
🚀 ### Check my profile for other juicy hints and original strategies. ### 🚀
Open-source script
In true TradingView spirit, the creator of this script has made it open-source, so that traders can review and verify its functionality. Kudos to the author! While you can use it for free, remember that republishing the code is subject to our House Rules.
Disclaimer
The information and publications are not meant to be, and do not constitute, financial, investment, trading, or other types of advice or recommendations supplied or endorsed by TradingView. Read more in the Terms of Use.