OPEN-SOURCE SCRIPT
Updated Low Volume Regions (Captura de liquidez)
"Low Volume Regions"
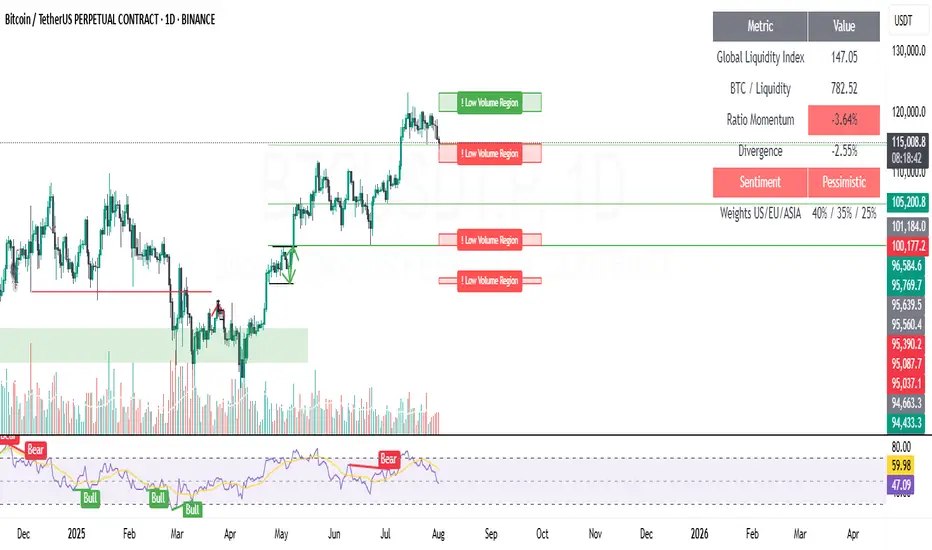
Detects and highlights price zones where Bitcoin rapidly moved through with unusually low traded volume—approximating low-volume nodes. Adjacent sparse-volume bins are merged into cleaner regions. Zones above the current price are green, below are red; the emptiest zone (strongest low-volume signature) is tagged with “! Low Volume Region.” Opacity encodes scarcity: darker/less transparent means lower volume. Designed to surface liquidity capture areas likely to be revisited.
This indicator identifies and visualizes “low volume regions” in the price action of Bitcoin—price areas that were traversed quickly with little trading activity, creating potential liquidity gaps that the market may later revisit. These regions approximate what traders refer to as low-volume nodes (LVNs) or thin zones on a volume profile, without relying on native volume-profile data.
How it works:
It analyzes the last N candles (configurable lookback) and divides the price range into discrete bins.
Volume is accumulated per bin based on historical closes to estimate where trading was sparse.
Bins with volume below a chosen percentile threshold are marked as low-volume.
Nearby low-volume bins are merged into broader regions to reduce clutter and reflect meaningful sparse-volume zones.
Each merged zone’s average volume is used to compute a “scarcity” score; zones with comparatively less volume are rendered more opaque (stronger visual emphasis).
Zones above the current price are colored green, zones below are colored red.
The most extreme low-volume region (the one with the lowest relative volume) is flagged with the label “! Low Volume Region”, while others are labeled “Low Volume Region”.
Visuals:
Filled boxes (zones) show aggregated low-volume price regions projected forward.
Opacity scales: emptier (lower volume) regions are darker/less transparent.
Single label per region indicates its nature; the strongest zone includes an exclamation mark prefixed to the label.
Color indicates relative position to current price (bullish above / bearish below).
Key inputs / parameters:
lookback: Number of candles to include in the volume analysis window.
binsCount: Granularity of price partitioning.
percentileThreshold: Defines how “low” volume must be to qualify (e.g., 25 picks the bottom 25% by volume).
zoneWidthBars: How far the detected region extends to the right for visibility.
mergeGapFactor: Controls how aggressively adjacent low-volume bins are merged.
Interpretation:
Traders can use these regions as potential areas of liquidity capture or imbalance. Price often revisits such thin zones to fill them (retracement) before continuing in the prevailing direction. The highlighted “strongest” zone (with the exclamation) is the most pronounced candidate for such behavior.
Usage tips:
Combine with overall trend/context to decide if a revisit is a corrective opportunity or a trap.
Use the zones as potential support/resistance or entries/exits when price returns.
Adjust lookback and binsCount to suit the time frame (higher lookback + more bins for higher timeframes).
Limitations:
This is an approximation of volume-profile behavior using only candle close-based binning; it does not replace full-profile footprint or order-book analysis.
Zones are recalculated on the latest candle only to reduce clutter; historical persistence or revisit detection must be handled externally if needed.
Example use case:
On a daily BTC chart, a sharp green candle that quickly leaps above a narrow consolidation with low volume leaves behind a “Low Volume Region.” If price later retraces, traders watch that zone for potential liquidity capture or a bounce.
Release Notes
# Low Volume Regions + Support Lows## Summary
This indicator identifies and highlights **grouped low-volume price regions** (potential liquidity capture zones) and overlays the **last three isolated pivot lows** as dynamic support lines. It’s designed to surface areas where price moved with little trading activity (gaps in liquidity) and mark recent structural support, helping traders spot potential revisit zones or liquidity hunts.
## What’s New / Key Features
### 1. **Grouped Low Volume Regions**
- Scans the last `lookback` candles and divides the price range into `binsCount` price bands.
- Aggregates volume per bin using historical closes.
- Identifies the bottom percentile (`percentileThreshold`) of bins by volume — these represent **low-volume zones** (areas with little trading interest).
- **Merges adjacent low-volume bins** within a tolerance (`mergeGapFactor`) to form wider regions.
- Computes a normalized “emptiness” score (norm) per merged zone.
- The emptiest (least traded) zone is specially marked with a **“! Low Volume Region”** label.
- Zones are drawn as semi-transparent boxes extending forward (`zoneWidthBars`), with:
- **Color**: green if above current price, red if below.
- **Transparency interpolated**: emptier zones appear more opaque (stronger highlight), denser low-volume zones are lighter.
### 2. **Support Lines from Last 3 Pivot Lows**
- Detects pivot lows using `ta.pivotlow` with user-controlled left/right window.
- Maintains the **three most recent distinct pivot lows** (avoiding duplicates via a tick tolerance).
- Draws horizontal support lines extending to the right:
- Most recent is brightest; older ones fade progressively.
- These serve as **recent structural support levels** (liquidity capture lows / swing lows) for contextual confluence with low-volume regions.
### 3. **Robustness Improvements**
- All array accesses (e.g., retrieving last lows or merged zones) are safely guarded to prevent out-of-bounds errors.
- Merging logic for low-volume zones ensures contiguous emptiness areas are grouped cleanly.
- Labels and boxes only render on the latest bar to reduce visual clutter and keep focus on current actionable zones.
## Visual Output
- **Colored boxes**: Highlight grouped low-volume regions.
- Emptiest region gets a “!” label.
- Above-price zones are green, below-price are red.
- Opacity scales with how “low-volume” the region is.
- **Labels**: “Low Volume Region” or “! Low Volume Region” centered in each zone.
- **Support lines**: Three horizontal lines at the last distinct pivot lows (support structure), with a gradient of visibility (newer stronger).
## Inputs / Parameters
- `lookback`: How many candles back to analyze volume profile.
- `binsCount`: Number of price buckets to divide the range into.
- `percentileThreshold`: Defines the cutoff percentile for what counts as low volume (lower = stricter).
- `zoneWidthBars`: How far forward the low-volume zone boxes extend.
- `mergeGapFactor`: Tolerance for merging adjacent low-volume bins (as a fraction of bin size).
- `minTransparency` / `maxTransparency`: Controls visual intensity interpolation for zones.
- `pivot_left` / `pivot_right`: Window size for detecting pivot lows.
- `support_line_length`: Historical lookback extent used when drawing support lines (controls how far left they originate).
## Interpretation
- **Low Volume Regions** often act as imbalance or liquidity gaps; price tends to revisit or react when moving back through them. The emptiest (marked with “!”) are the most significant.
- **Support Lines** from pivot lows give recent structural levels where previous buyers were present; if these align with low-volume zones, the confluence increases relevance.
- Together, they help identify **liquidity capture areas** where price may stall, reverse, or retest with lower friction.
## Usage Tips
- Look for price approaching a “! Low Volume Region” from above or below; if a pivot low support line sits near or overlaps, that adds support confluence.
- Use the opacity gradient to prioritize zones: more opaque = less traded historically = potentially stronger imbalance.
- Combine with price action or other momentum confirmation before acting.
- Adjust `percentileThreshold` to widen/narrow what qualifies as low-volume for different volatility regimes.
## Limitations
- Zones are only drawn on the most recent bar (no historical persistence beyond that snapshot).
- Pivot detection depends on the chosen left/right window; too small = noise, too large = lag.
- Low-volume regions are statistical and don’t guarantee reversal—should be used with context.
## Example Workflow
1. Spot a “! Low Volume Region” below price that aligns with an older pivot low—this could be a **liquidity capture support**.
2. Wait for price to revisit with a bullish reaction (e.g., rejection candle) for a potential long.
3. If price breaks through a support pivot low into a low-volume zone, watch for fast moves (low resistance) or reversal traps.
Open-source script
In true TradingView spirit, the creator of this script has made it open-source, so that traders can review and verify its functionality. Kudos to the author! While you can use it for free, remember that republishing the code is subject to our House Rules.
Disclaimer
The information and publications are not meant to be, and do not constitute, financial, investment, trading, or other types of advice or recommendations supplied or endorsed by TradingView. Read more in the Terms of Use.