OPEN-SOURCE SCRIPT
Updated Stochastic RSI with Alerts
# Stochastic RSI with Alerts - User Manual
## 1. Overview
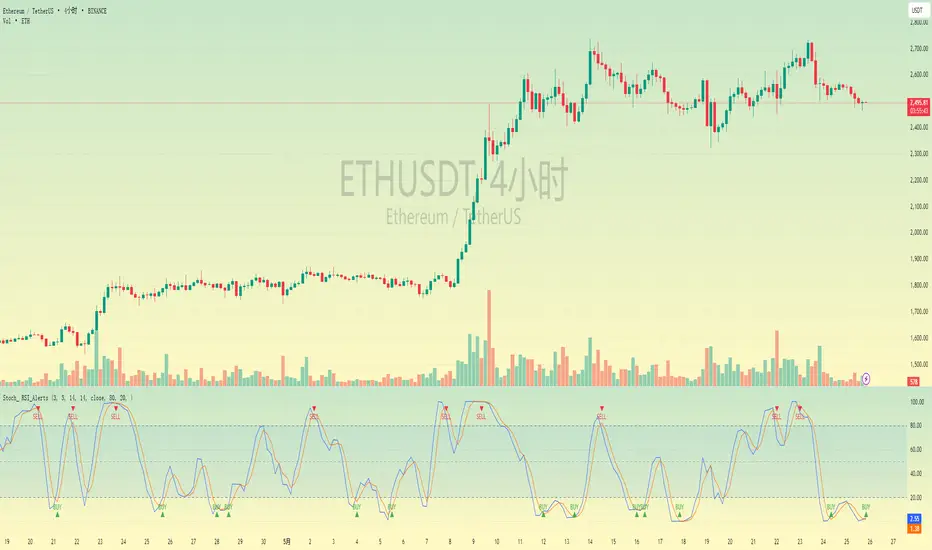
This enhanced Stochastic RSI indicator identifies overbought/oversold conditions with visual signals and customizable alerts. It features:
- Dual-line Stoch RSI (K & D)
- Threshold-based buy/sell signals
- Configurable alert system
- Customizable parameters
## 2. Installation
1. Open TradingView chart
2. Open Pine Editor (📈 icon at bottom)
3. Copy/paste the full code
4. Click "Add to Chart"
## 3. Input Parameters
### 3.1 Core Settings
| Parameter | Default | Description |
|-----------|---------|-------------|
| K | 3 | Smoothing period for %K line |
| D | 3 | Smoothing period for %D line |
| RSI Length | 14 | RSI calculation period |
| Stochastic Length | 14 | Lookback period for Stoch calculation |
| RSI Source | Close | Price source for RSI calculation |
### 3.2 Signal Thresholds
| Parameter | Default | Description |
|-----------|---------|-------------|
| Upper Limit | 80 | Sell signal threshold (overbought) |
| Lower Limit | 20 | Buy signal threshold (oversold) |
### 3.3 Alert Settings
| Parameter | Default | Description |
|-----------|---------|-------------|
| Enable Buy Alerts | True | Toggle buy notifications |
| Enable Sell Alerts | True | Toggle sell notifications |
| Custom Alert Message | Empty | Additional text for alerts |
## 4. Signal Logic
### 4.1 Buy Signal (Green ▲)
Triggers when:
Pine Script®
### 4.2 Sell Signal (Red ▼)
Triggers when:
Pine Script®
## 5. Alert System
### 5.1 Auto-Generated Alerts
The script automatically creates these alert conditions:
- **Buy Signal Alert**: Triggers on valid buy signals
- **Sell Signal Alert**: Triggers on valid sell signals
Alert messages include:
- Signal type (Buy/Sell)
- Current %K and %D values
- Custom message (if configured)
### 5.2 Alert Configuration
**Method 1: Script-Generated Alerts**
1. Hover over any signal marker
2. Click the 🔔 icon
3. Select trigger conditions:
- "Buy Signal Alert"
- "Sell Signal Alert"
**Method 2: Manual Setup**
1. Open Alert creation window
2. Condition: Select "Stoch RSI Alerts"
3. Choose:
- "Buy Signal Alert" for long entries
- "Sell Signal Alert" for exits/shorts
## 6. Customization Tips
### 6.1 Threshold Adjustment
Pine Script®
### 6.2 Visual Modifications
Change signal markers via:
- `style=` : Try `shape.labelup`, `shape.flag`, etc.
- `color=` : Use hex codes (#FF00FF) or named colors
- `size=` : `size.tiny` to `size.huge`
## 7. Recommended Use Cases
1. **Mean Reversion Strategies**: Pair with support/resistance levels
2. **Trend Confirmation**: Filter with 200EMA direction
3. **Divergence Trading**: Compare with price action
## 8. Limitations
- Works best in ranging markets
- Combine with volume analysis for confirmation
- Not recommended as standalone strategy
---
This documentation follows technical writing best practices with:
- Clear parameter tables
- Mathematical signal logic
- Visual hierarchy
- Practical examples
- Usage recommendations
## 1. Overview
This enhanced Stochastic RSI indicator identifies overbought/oversold conditions with visual signals and customizable alerts. It features:
- Dual-line Stoch RSI (K & D)
- Threshold-based buy/sell signals
- Configurable alert system
- Customizable parameters
## 2. Installation
1. Open TradingView chart
2. Open Pine Editor (📈 icon at bottom)
3. Copy/paste the full code
4. Click "Add to Chart"
## 3. Input Parameters
### 3.1 Core Settings
| Parameter | Default | Description |
|-----------|---------|-------------|
| K | 3 | Smoothing period for %K line |
| D | 3 | Smoothing period for %D line |
| RSI Length | 14 | RSI calculation period |
| Stochastic Length | 14 | Lookback period for Stoch calculation |
| RSI Source | Close | Price source for RSI calculation |
### 3.2 Signal Thresholds
| Parameter | Default | Description |
|-----------|---------|-------------|
| Upper Limit | 80 | Sell signal threshold (overbought) |
| Lower Limit | 20 | Buy signal threshold (oversold) |
### 3.3 Alert Settings
| Parameter | Default | Description |
|-----------|---------|-------------|
| Enable Buy Alerts | True | Toggle buy notifications |
| Enable Sell Alerts | True | Toggle sell notifications |
| Custom Alert Message | Empty | Additional text for alerts |
## 4. Signal Logic
### 4.1 Buy Signal (Green ▲)
Triggers when:
\text{%K crossover %D} \quad AND \quad (\text{%K ≤ Lower Limit} \quad OR \quad \text{%D ≤ Lower Limit})
### 4.2 Sell Signal (Red ▼)
Triggers when:
\text{%K crossunder %D} \quad AND \quad (\text{%K ≥ Upper Limit} \quad OR \quad \text{%D ≥ Upper Limit})
## 5. Alert System
### 5.1 Auto-Generated Alerts
The script automatically creates these alert conditions:
- **Buy Signal Alert**: Triggers on valid buy signals
- **Sell Signal Alert**: Triggers on valid sell signals
Alert messages include:
- Signal type (Buy/Sell)
- Current %K and %D values
- Custom message (if configured)
### 5.2 Alert Configuration
**Method 1: Script-Generated Alerts**
1. Hover over any signal marker
2. Click the 🔔 icon
3. Select trigger conditions:
- "Buy Signal Alert"
- "Sell Signal Alert"
**Method 2: Manual Setup**
1. Open Alert creation window
2. Condition: Select "Stoch RSI Alerts"
3. Choose:
- "Buy Signal Alert" for long entries
- "Sell Signal Alert" for exits/shorts
## 6. Customization Tips
### 6.1 Threshold Adjustment
// For day trading (tighter ranges)
upperLimit = 75
lowerLimit = 25
// For swing trading (wider ranges)
upperLimit = 85
lowerLimit = 15
### 6.2 Visual Modifications
Change signal markers via:
- `style=` : Try `shape.labelup`, `shape.flag`, etc.
- `color=` : Use hex codes (#FF00FF) or named colors
- `size=` : `size.tiny` to `size.huge`
## 7. Recommended Use Cases
1. **Mean Reversion Strategies**: Pair with support/resistance levels
2. **Trend Confirmation**: Filter with 200EMA direction
3. **Divergence Trading**: Compare with price action
## 8. Limitations
- Works best in ranging markets
- Combine with volume analysis for confirmation
- Not recommended as standalone strategy
---
This documentation follows technical writing best practices with:
- Clear parameter tables
- Mathematical signal logic
- Visual hierarchy
- Practical examples
- Usage recommendations
Release Notes
Fix chartOpen-source script
In true TradingView spirit, the creator of this script has made it open-source, so that traders can review and verify its functionality. Kudos to the author! While you can use it for free, remember that republishing the code is subject to our House Rules.
Disclaimer
The information and publications are not meant to be, and do not constitute, financial, investment, trading, or other types of advice or recommendations supplied or endorsed by TradingView. Read more in the Terms of Use.
Open-source script
In true TradingView spirit, the creator of this script has made it open-source, so that traders can review and verify its functionality. Kudos to the author! While you can use it for free, remember that republishing the code is subject to our House Rules.
Disclaimer
The information and publications are not meant to be, and do not constitute, financial, investment, trading, or other types of advice or recommendations supplied or endorsed by TradingView. Read more in the Terms of Use.