OPEN-SOURCE SCRIPT
Updated day of Month | xilix
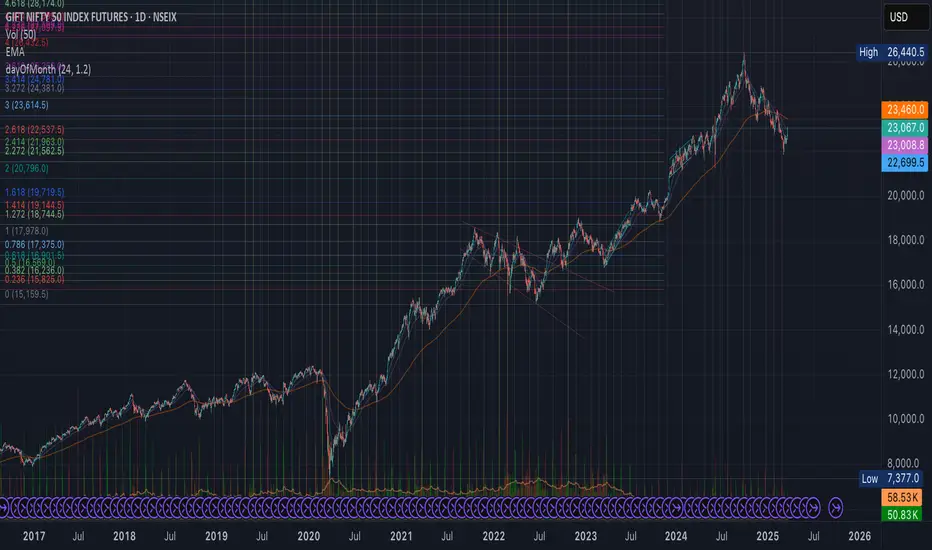
Monthly Marker (1D Only)
The Monthly Marker indicator automatically highlights a specific day of the month on a daily (1D) chart by drawing a vertical line. Users can select their desired day of the month and customize the line color.
Features:
✅ Marks the chosen day of each month with a vertical line.
✅ Customizable line color (set in the indicator settings).
✅ Helps traders quickly identify key monthly dates.
Note: This indicator will not work on lower timeframes (e.g., 4H, 1H) and will show an error if applied outside the 1D timeframe.
Best Use Cases: Monthly trend tracking, economic event alignment, and custom date-based analysis. 🚀
Release Notes
Day of Month Marker (1D Only)The Monthly Marker indicator automatically highlights a specific day of the month on a daily (1D) chart by drawing a vertical line. Users can select their desired day of the month and customize the line color.
If the selected day experiences a price change greater than a user-defined percentage, the line is highlighted in a different color.
Features:
✅ Marks the chosen day of each month with a vertical line.
✅ Highlights the line if the day's price change (open to close) exceeds the input threshold.
✅ Customizable colors for default and highlighted lines.
✅ Helps traders quickly identify key monthly dates.
Note: This indicator will not work on lower timeframes (e.g., 4H, 1H) and will show an error if applied outside the 1D timeframe.
Best Use Cases: Monthly trend tracking,economic event alignment, and custom date-based analysis. 🚀
Open-source script
In true TradingView spirit, the creator of this script has made it open-source, so that traders can review and verify its functionality. Kudos to the author! While you can use it for free, remember that republishing the code is subject to our House Rules.
Disclaimer
The information and publications are not meant to be, and do not constitute, financial, investment, trading, or other types of advice or recommendations supplied or endorsed by TradingView. Read more in the Terms of Use.