OPEN-SOURCE SCRIPT
Candle Range % vs 8-Candle Avg
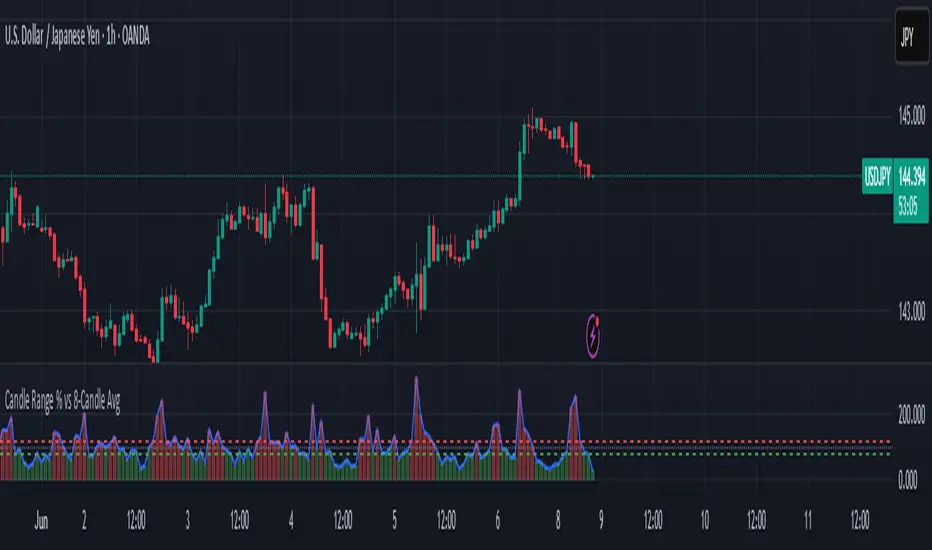
Candle % Indicator – Measure Candle Strength by Range %
**Overview:**
The *Candle % Indicator* helps traders visually and analytically gauge the strength or significance of a price candle relative to its recent historical context. This is particularly useful for detecting breakout moves, volatility shifts, or overextended candles that may signal exhaustion.
**What It Does:**
* Calculates the **percentage range** of the current candle compared to the **average range of the past N candles**.
* Highlights candles that exceed a user-defined threshold (e.g., 150% of the average range).
* Useful for **filtering out extreme candles** that might represent anomalies or unsustainable moves.
* Can be combined with other strategies (like EMA crossovers, support/resistance breaks, etc.) to improve signal quality.
**Use Case Examples:**
***Filter out fakeouts** in breakout strategies by ignoring candles that are overly large and may revert.
***Volatility control**: Avoid entries when market conditions are erratic.
**Confluence**: Combine with EMA or RSI signals for refined entries.
**How to Read:**
* If a candle is larger than the average range by more than the set percentage (default 150%), it's flagged (e.g., no entry signal or optional visual marker).
* Ideal for intraday, swing, or algorithmic trading setups.
**Customizable Inputs:**
**Lookback Period**: Number of previous candles to calculate the average range.
**% Threshold**: Maximum percentage a candle can exceed the average before being filtered or marked.
Open-source script
In true TradingView spirit, the creator of this script has made it open-source, so that traders can review and verify its functionality. Kudos to the author! While you can use it for free, remember that republishing the code is subject to our House Rules.
Disclaimer
The information and publications are not meant to be, and do not constitute, financial, investment, trading, or other types of advice or recommendations supplied or endorsed by TradingView. Read more in the Terms of Use.