OPEN-SOURCE SCRIPT
Updated Dynamic Liquidity Map [Kioseff Trading]
Hello!
Just a quick/fun project here: "Dynamic Heatmap".
This script draws a volume delta or open interest delta heatmap for the asset on your chart.
The adjective "Dynamic" is used for two reasons (:
1: Self-Adjusting Lower Timeframe Data
The script requests ~10 lower timeframe volume and open interest data sets.
When using the fixed range feature the script will, beginning at the start time, check the ~10 requested lower timeframes to see which of the lower timeframes has available data.
The script will always use the lowest timeframe available during the calculation period. As time continues, the script will continue to check if new lower timeframe data (lower than the currently used lowest timeframe) is available. This process repeats until bar time is close enough to the current time that 1-minute data can be retrieved.

The image above exemplifies the process.
Incrementally lower timeframe data will be used as it becomes available.
1: Fixed range capabilities
The script features a "fixed range" tool, where you can manually set a start time (or drag & drop a bar on the chart) to determine the interval the heatmap covers.
From the start date, the script will calculate the calculate the sub-intervals necessary to draw a rows x columns heatmap. Consequently, setting the start time further back will draw a heat map with larger rows x columns, whereas, a start time closer to the current bar time will draw a more "precise" heatmap with smaller rows x columns.
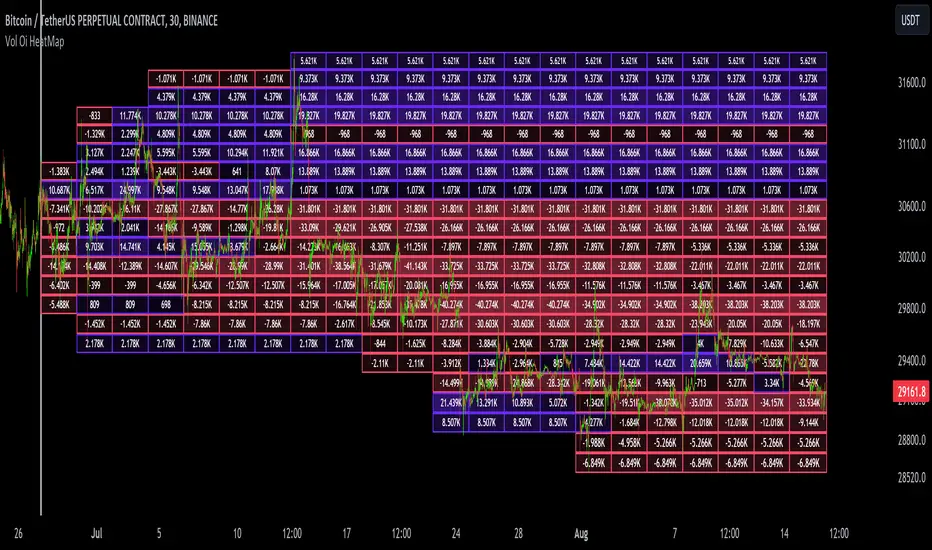
Additionally, the heatmap can be calculated using open interest data.

The image above shows the heatmap displaying open interest delta.

The image above shows alternative settings for the heatmap.
Delta values have been hidden alongside grid border colors. These settings can be replicated to achieve a more "traditional" feel for the heatmap.
Thanks for checking this out!
Just a quick/fun project here: "Dynamic Heatmap".
This script draws a volume delta or open interest delta heatmap for the asset on your chart.
The adjective "Dynamic" is used for two reasons (:
1: Self-Adjusting Lower Timeframe Data
The script requests ~10 lower timeframe volume and open interest data sets.
When using the fixed range feature the script will, beginning at the start time, check the ~10 requested lower timeframes to see which of the lower timeframes has available data.
The script will always use the lowest timeframe available during the calculation period. As time continues, the script will continue to check if new lower timeframe data (lower than the currently used lowest timeframe) is available. This process repeats until bar time is close enough to the current time that 1-minute data can be retrieved.
The image above exemplifies the process.
Incrementally lower timeframe data will be used as it becomes available.
1: Fixed range capabilities
The script features a "fixed range" tool, where you can manually set a start time (or drag & drop a bar on the chart) to determine the interval the heatmap covers.
From the start date, the script will calculate the calculate the sub-intervals necessary to draw a rows x columns heatmap. Consequently, setting the start time further back will draw a heat map with larger rows x columns, whereas, a start time closer to the current bar time will draw a more "precise" heatmap with smaller rows x columns.
Additionally, the heatmap can be calculated using open interest data.
The image above shows the heatmap displaying open interest delta.
The image above shows alternative settings for the heatmap.
Delta values have been hidden alongside grid border colors. These settings can be replicated to achieve a more "traditional" feel for the heatmap.
Thanks for checking this out!
Release Notes
Fixed timeframe.period issueThank you Trendoscope for noticing (:
Release Notes
Fixed bug with oi data! Thank you again for noticing Trendoscope
Open-source script
In true TradingView spirit, the creator of this script has made it open-source, so that traders can review and verify its functionality. Kudos to the author! While you can use it for free, remember that republishing the code is subject to our House Rules.
•Access to Next-Gen Optimization Tools: tradingiq.io
•Discord Server: discord.gg/aKWPuM4HPy
•Discord Server: discord.gg/aKWPuM4HPy
Disclaimer
The information and publications are not meant to be, and do not constitute, financial, investment, trading, or other types of advice or recommendations supplied or endorsed by TradingView. Read more in the Terms of Use.