OPEN-SOURCE SCRIPT
CME Futures RTH net change % levels
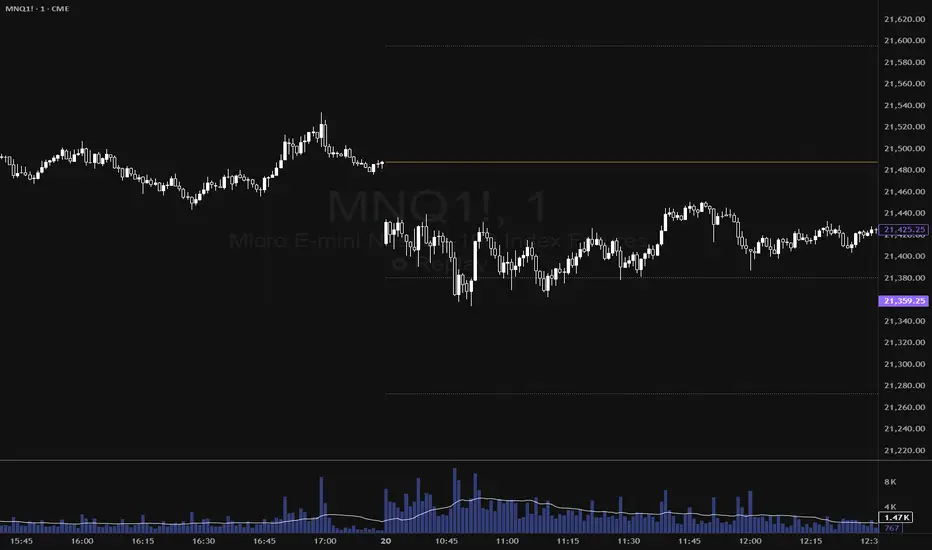
RTH Session time calculated for AMERICAN FUTURES ONLY.
Plots the net change % from the last session's RTH close, a.k.a daily % change for that specific instrument. Best used as support and resistance zones in confluence with other analysis, and also serve as a gauge for how volatile the session is.
Plots the net change % from the last session's RTH close, a.k.a daily % change for that specific instrument. Best used as support and resistance zones in confluence with other analysis, and also serve as a gauge for how volatile the session is.
Open-source script
In true TradingView spirit, the creator of this script has made it open-source, so that traders can review and verify its functionality. Kudos to the author! While you can use it for free, remember that republishing the code is subject to our House Rules.
Disclaimer
The information and publications are not meant to be, and do not constitute, financial, investment, trading, or other types of advice or recommendations supplied or endorsed by TradingView. Read more in the Terms of Use.