OPEN-SOURCE SCRIPT
Updated RSI Pie
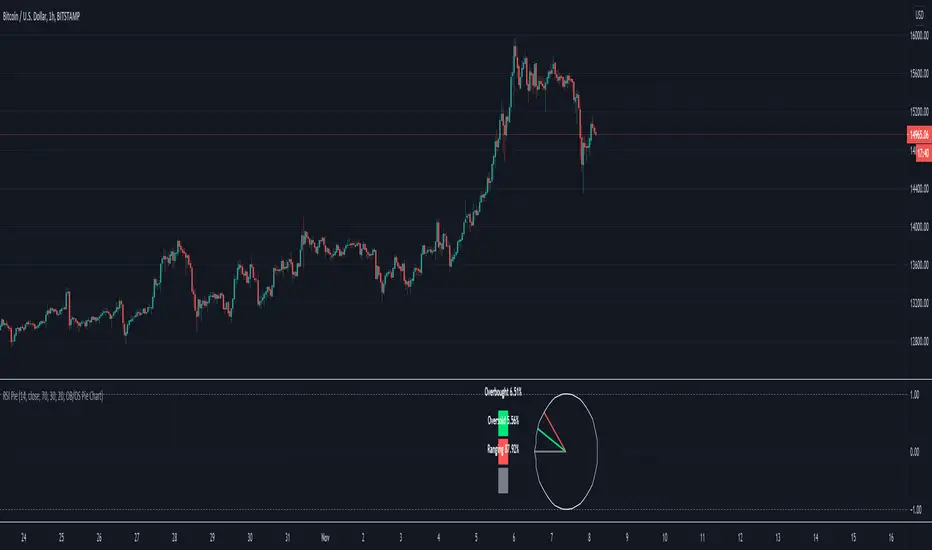
More a novelty than anything useful. Measures the % of overbought/sold RSI and renders as a pie chart. RSI % -> Radians -> (x,y) -> bar_time. 24hr market charts only.
Release Notes
Defunct. See : [url=https://tradingview.sweetlogin.com/script/pHlXdeXI-Pie-Chart-Toolbox/]Pie Chart ToolboxRelease Notes
See script Pie Chart Toolbox 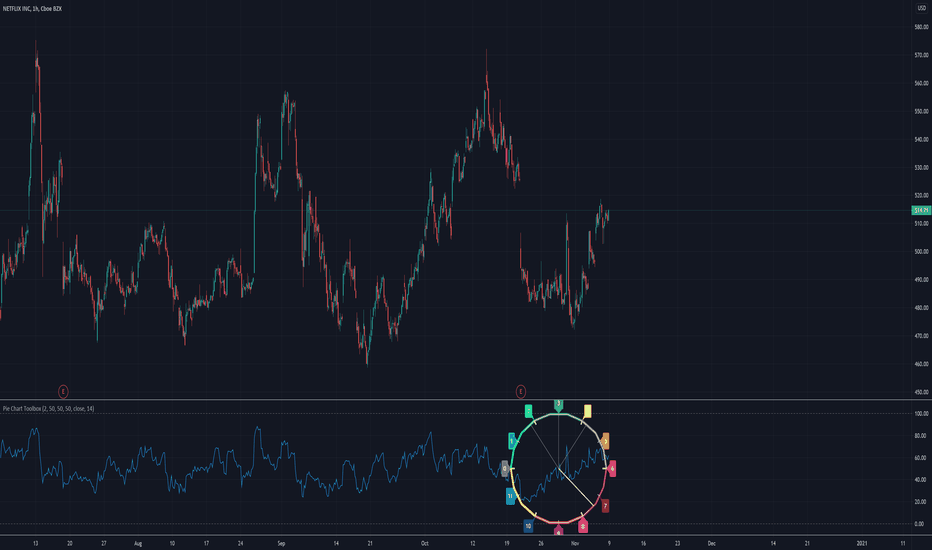
Open-source script
In true TradingView spirit, the creator of this script has made it open-source, so that traders can review and verify its functionality. Kudos to the author! While you can use it for free, remember that republishing the code is subject to our House Rules.
Disclaimer
The information and publications are not meant to be, and do not constitute, financial, investment, trading, or other types of advice or recommendations supplied or endorsed by TradingView. Read more in the Terms of Use.